Roselle Park: Fire Incidents, New Jersey (NJ)
Where are fire incidents reported in Roselle Park, NJ
Something went wrong! Please refresh the page.
|
| |||||||||||||||||||||||||||||||||||||||||||||||||||||||||||||||||||||||||||||||||||||||||||||||||||||||||||||
2004 - 2018 National Fire Incident Reporting System (NFIRS) incidents
- Incident types reported to NFIRS in Roselle Park, NJ
- 67735.8%Hazardous Condition
- 42122.3%Fire
- 32717.3%False Alarm
- 21811.5%Rescue & EMS
- 1196.3%Service Call
- 1136.0%Good Intent Call
- 110.6%Special Incident
- 20.1%Severe Weather
- Fire incident types reported to NFIRS in Roselle Park, NJ
- 24458.0%Structure Fires
- 9823.3%Outside Fires
- 4410.5%Other
- 358.3%Mobile Property/Vehicle Fires
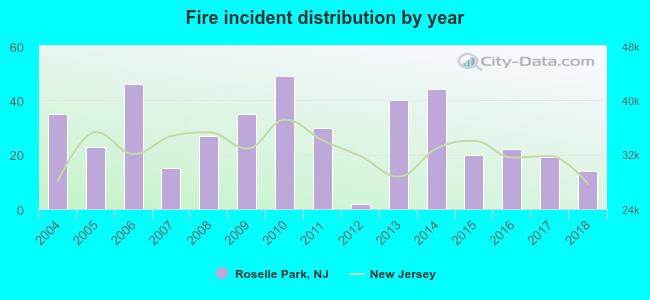 Based on the data from the years 2004 - 2018 the average number of fire incidents per year is 28. The highest number of reported fires - 49 took place in 2010, and the least - 2 in 2012. The data has a decreasing trend.
The average number of yearly fire incidents per 10k residents in Roselle Park, NJ compared to nearest cities:
(Note: Based on data for the last 3 years, including only cities with population 5,000 and above)
| Roselle Park: | 13.5 |
| Roselle: | 24.1 |
| Kenilworth: | 14.3 |
| Cranford: | 27.6 |
| Union: | 27.8 |
| Linden: | 28.5 |
| Hillside: | 34.1 |
| Elizabeth: | 38.7 |
| Springfield: | 44.0 |

 According to the reports from the years 2004 - 2018 the average number of fire-related casualties per year is 0. The highest number of reported injuries - 2 took place in 2016, and the lowest - 0 in 2004. The data has a growing trend.
 29.0% incidents where reported in the morning and 71.0% in the evening. The most fires (17.8%) took place on Sunday, and the least (12.1%) on Wednesday.
 Based on the 421 fires from years 2004 - 2018 most fires (11.6%) took place during January, and the least (5.5%) in February.
 Out of all 1,889 cases reported during the years 2004 - 2018, the most belonged to the categories: Hazardous Condition (35.8%), Fire (22.3%), and False Alarm (17.3%).
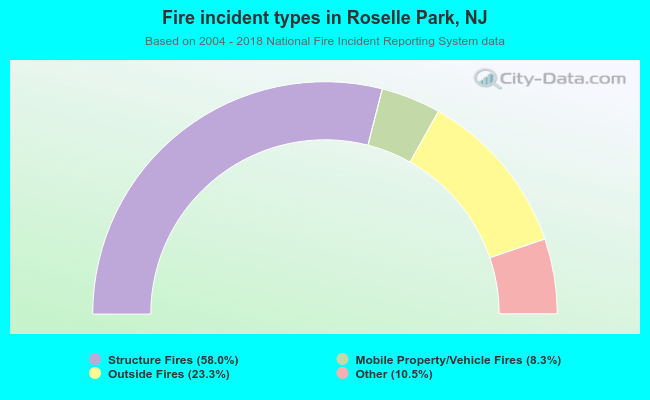 When looking into fire subcategories, the most incidents belonged to: Structure Fires (58.0%), and Outside Fires (23.3%).