Kenilworth: Fire Incidents, New Jersey (NJ)
Where are fire incidents reported in Kenilworth, NJ
Something went wrong! Please refresh the page.
|
| |||||||||||||||||||||||||||||||||||||||||||||||||||||||||||||||||||||||||||||||||||||||||||||||||||||||||||||
2003 - 2018 National Fire Incident Reporting System (NFIRS) incidents
- Incident types reported to NFIRS in Kenilworth, NJ
- 66340.0%Hazardous Condition
- 39323.7%Rescue & EMS
- 24815.0%Fire
- 20112.1%False Alarm
- 1126.8%Service Call
- 392.4%Good Intent Call
- Fire incident types reported to NFIRS in Kenilworth, NJ
- 13454.0%Structure Fires
- 5020.2%Mobile Property/Vehicle Fires
- 5020.2%Outside Fires
- 145.6%Other
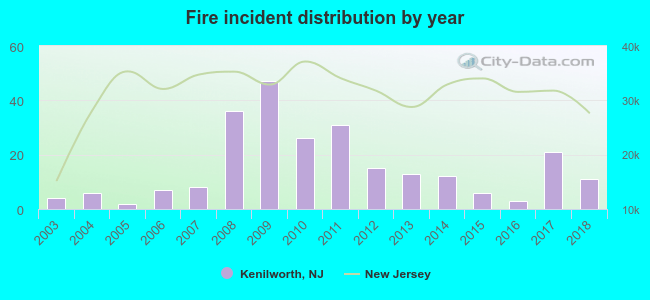 Based on the data from the years 2003 - 2018 the average number of fires per year is 16. The highest number of reported fire incidents - 47 took place in 2009, and the least - 2 in 2005. The data has an increasing trend.
The average number of yearly fire incidents per 10k residents in Kenilworth, NJ compared to nearest cities:
(Note: Based on data for the last 3 years, including only cities with population 5,000 and above)
| Kenilworth: | 14.3 |
| Roselle Park: | 13.5 |
| Cranford: | 27.6 |
| Union: | 27.8 |
| Roselle: | 24.1 |
| Springfield: | 44.0 |
| Westfield: | 18.3 |
| Mountainside: | 19.0 |
| Linden: | 28.5 |
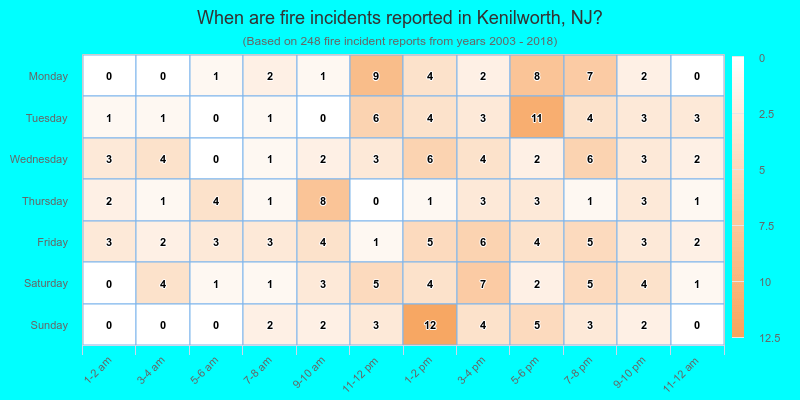
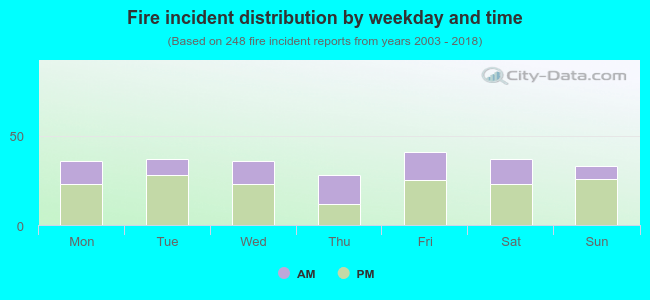 35.5% incidents where reported in the morning and 64.5% in the evening. The most fires (16.5%) took place on Friday, and the least (11.3%) on Thursday.
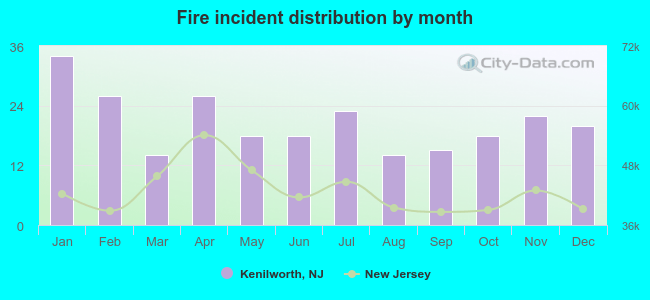 According to the 248 incident reports from years 2003 - 2018 most fires (13.7%) took place during January, and the least (5.6%) in March.
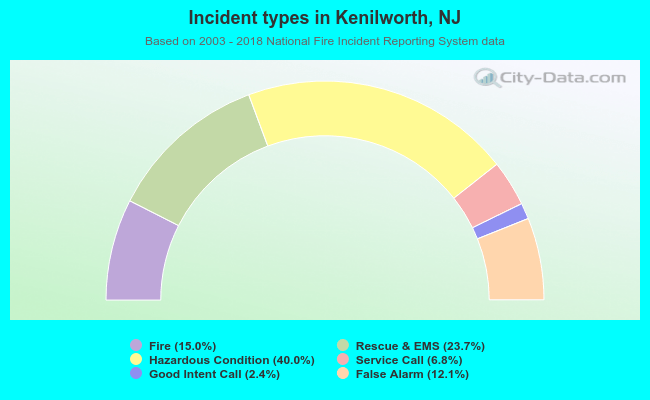 Out of all 1,656 cases reported during the years 2003 - 2018, the most belonged to the categories: Rescue & EMS (40.0%), Overpressure Rupture (23.7%), and Fire (15.0%).
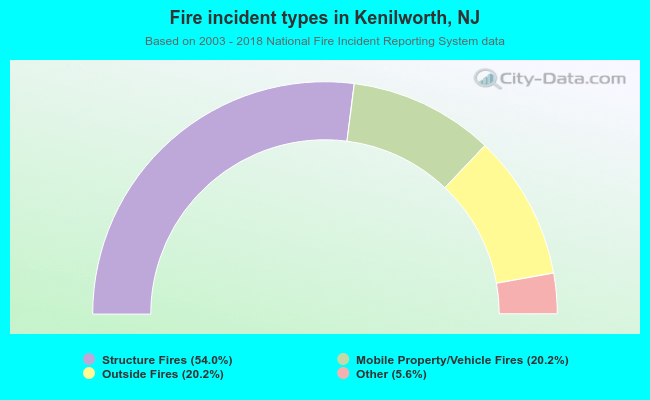 When looking into fire subcategories, the most reports belonged to: Structure Fires (54.0%), and Mobile Property/Vehicle Fires (20.2%).