Mountainside: Fire Incidents, New Jersey (NJ)
Where are fire incidents reported in Mountainside, NJ
Something went wrong! Please refresh the page.
|
| |||||||||||||||||||||||||||||||||||||||||||||||||||||||||||||||||||||||||||||||||||||||||||||||||||||||||||||
2002 - 2018 National Fire Incident Reporting System (NFIRS) incidents
- Incident types reported to NFIRS in Mountainside, NJ
- 58836.9%Hazardous Condition
- 48530.5%False Alarm
- 29918.8%Fire
- 966.0%Service Call
- 905.7%Good Intent Call
- 291.8%Rescue & EMS
- 40.3%Overpressure Rupture
- Fire incident types reported to NFIRS in Mountainside, NJ
- 15050.2%Structure Fires
- 8628.8%Outside Fires
- 5418.1%Mobile Property/Vehicle Fires
- 93.0%Other
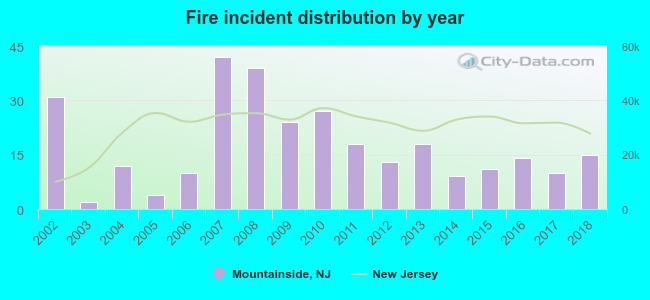 Based on the data from the years 2002 - 2018 the average number of fires per year is 18. The highest number of fire incidents - 42 took place in 2007, and the least - 2 in 2003. The data has a dropping trend.
The average number of yearly fire incidents per 10k residents in Mountainside, NJ compared to nearest cities:
(Note: Based on data for the last 3 years, including only cities with population 5,000 and above)
| Mountainside: | 19.0 |
| Woodland Park: | 33.6 |
| Westfield: | 18.3 |
| Springfield: | 44.0 |
| Summit: | 46.5 |
| New Providence: | 16.9 |
| Scotch Plains: | 31.4 |
| Fanwood: | 9.6 |
| Cranford: | 27.6 |

 29.8% incidents where reported in the morning and 70.2% in the evening. The most fires (18.1%) took place on Friday, and the least (12.7%) on Sunday.
 According to the 299 incident reports from years 2002 - 2018 most fires (12.7%) took place during July, and the least (6.0%) in June.
 Out of all 1,592 cases reported during the years 2002 - 2018, the most belonged to the categories: Hazardous Condition (36.9%), False Alarm (30.5%), and Fire (18.8%).
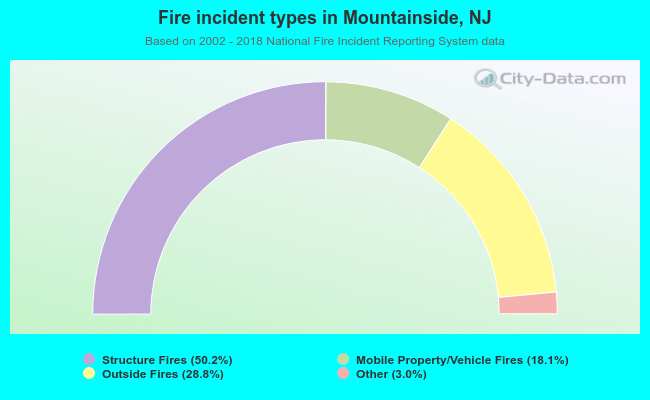 When looking into fire subcategories, the most incidents belonged to: Structure Fires (50.2%), and Outside Fires (28.8%).