Summit: Fire Incidents, New Jersey (NJ)
Where are fire incidents reported in Summit, NJ
Something went wrong! Please refresh the page.
| Fire incidents reported | |
|---|---|
| Sreet name | Count |
| SPRINGFIELD AVE | 222 |
| MORRIS AVE | 166 |
| BEAUVOIR AVE | 108 |
| SUMMIT AVE | 102 |
| UNION PL | 94 |
| MAPLE ST | 86 |
| BROAD ST | 76 |
| BEECHWOOD RD | 62 |
| PARK AVE | 60 |
| KENT PLACE BLVD | 50 |
| CHESTNUT AVE | 48 |
| BLACKBURN RD | 44 |
| ROUTE 78 WEST | 40 |
| WALNUT ST | 38 |
| ASHWOOD AVE | 36 |
| NORWOOD AVE | 36 |
| GLENSIDE AVE | 34 |
| OAK RIDGE AVE | 34 |
| BALTUSROL RD | 30 |
| EDGEWOOD RD | 30 |
| NEW ENGLAND AVE | 30 |
| ROUTE 24 WEST | 30 |
| ASHLAND RD | 28 |
| ORCHARD ST | 28 |
| ROUTE 24 EAST | 28 |
| WOODLAND AVE | 28 |
| INTERSTATE 78 | 26 |
| PROSPECT ST | 26 |
| ROUTE 78 | 26 |
| HOBART AVE | 24 |
2003 - 2018 National Fire Incident Reporting System (NFIRS) incidents
- Incident types reported to NFIRS in Summit, NJ
- 5,14734.2%Hazardous Condition
- 2,70018.0%False Alarm
- 2,10614.0%Service Call
- 1,88212.5%Rescue & EMS
- 1,64210.9%Fire
- 1,2918.6%Good Intent Call
- 1781.2%Severe Weather
- 630.4%Overpressure Rupture
- 290.2%Special Incident
- Fire incident types reported to NFIRS in Summit, NJ
- 1,05364.1%Structure Fires
- 33320.3%Outside Fires
- 21212.9%Mobile Property/Vehicle Fires
- 442.7%Other
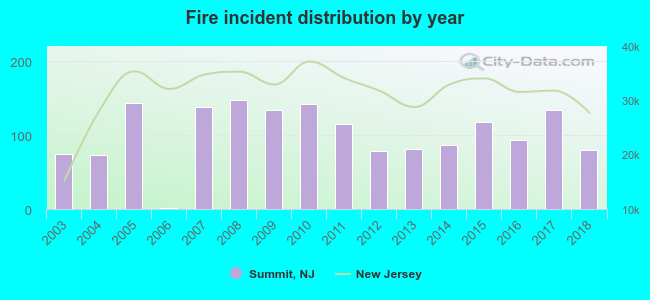 Based on the data from the years 2003 - 2018 the average number of fire incidents per year is 103. The highest number of fires - 147 took place in 2008, and the least - 2 in 2006. The data has a rising trend.
The average number of yearly fire incidents per 10k residents in Summit, NJ compared to nearest cities:
(Note: Based on data for the last 3 years, including only cities with population 5,000 and above)
| Summit: | 46.5 |
| Woodland Park: | 33.6 |
| Chatham: | 42.1 |
| Springfield: | 44.0 |
| New Providence: | 16.9 |
| Mountainside: | 19.0 |
| Millburn: | 10.6 |
| Short Hills: | 49.6 |
| Madison: | 14.5 |
 The median response time based on all reported fire incidents is 5 minutes. This is comparable to the New Jersey median value.
The median response time in Summit, NJ compared to nearest cities:
(Note: Based on data for all years, including only cities with at least 500 fire incidents)
| Summit: | 5 minutes |
| Springfield: | 5 minutes |
| Millburn: | 4 minutes |
| Short Hills: | 5 minutes |
| Berkeley Heights: | 5 minutes |
| Westfield: | 3 minutes |
| Union: | 5 minutes |
| Maplewood: | 3 minutes |
| Cranford: | 4 minutes |
 According to the data from the years 2003 - 2018 the average number of fire-related yearly casualties is 2. The highest number of reported casualties - 6 took place in 2009, and the lowest - 0 in 2004. The data has a decreasing trend.
The average number of injuries per 1,000 fires is 15. This indicator was the highest - 45 in 2009, and the lowest 0 in 2004. The trend for injuries per 1,000 fire incidents is decreasing. Compared to the New Jersey value the number of casualties per 1,000 incidents is higher.
According to the data from the years 2003 - 2018 the average number of fire-related yearly casualties is 2. The highest number of reported casualties - 6 took place in 2009, and the lowest - 0 in 2004. The data has a decreasing trend.
The average number of injuries per 1,000 fires is 15. This indicator was the highest - 45 in 2009, and the lowest 0 in 2004. The trend for injuries per 1,000 fire incidents is decreasing. Compared to the New Jersey value the number of casualties per 1,000 incidents is higher.Casualties per 1,000 incidents in Summit, NJ compared to nearest cities:
(Note: Based on data for all years, including only cities with at least 500 fire incidents)
| Summit: | 15.8 |
| Springfield: | 6.7 |
| Millburn: | 6.9 |
| Short Hills: | 7.0 |
| Berkeley Heights: | 19.2 |
| Westfield: | 9.8 |
| Union: | 26.2 |
| Maplewood: | 18.6 |
| Cranford: | 19.9 |
 28.7% incidents where reported in the morning and 71.3% in the evening. The most fires (16.4%) took place on Monday, and the least (12.9%) on Sunday.
 According to the 1,642 fire incident reports from years 2003 - 2018 most fires (11.9%) took place during April, and the least (6.0%) in August.
 Out of all 15,038 cases reported during the years 2003 - 2018, the most belonged to the categories: Hazardous Condition (34.2%), False Alarm (18.0%), and Service Call (14.0%).
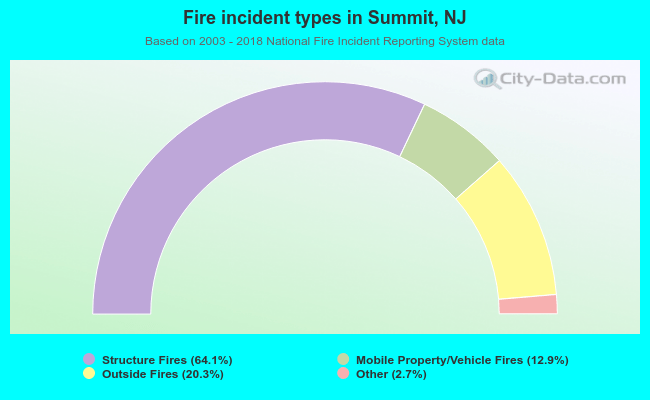 When looking into fire subcategories, the most incidents belonged to: Structure Fires (64.1%), and Outside Fires (20.3%).