Chatham: Fire Incidents, New Jersey (NJ)
Where are fire incidents reported in Chatham, NJ
Something went wrong! Please refresh the page.
|
| |||||||||||||||||||||||||||||||||||||||||||||||||||||||||||||||||||||||||||||||||||||||||||||||||||||||||||||
2004 - 2018 National Fire Incident Reporting System (NFIRS) incidents
- Incident types reported to NFIRS in Chatham, NJ
- 90531.4%Hazardous Condition
- 89931.2%False Alarm
- 36212.6%Fire
- 2739.5%Good Intent Call
- 2097.3%Service Call
- 1645.7%Rescue & EMS
- 632.2%Overpressure Rupture
- 40.1%Special Incident
- 30.1%Severe Weather
- Fire incident types reported to NFIRS in Chatham, NJ
- 21459.1%Structure Fires
- 10027.6%Outside Fires
- 4011.0%Mobile Property/Vehicle Fires
- 82.2%Other
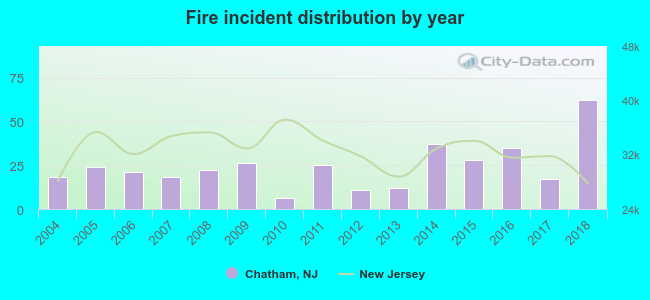 According to the data from the years 2004 - 2018 the average number of fire incidents per year is 24. The highest number of fires - 62 took place in 2018, and the least - 6 in 2010. The data has a rising trend.
The average number of yearly fire incidents per 10k residents in Chatham, NJ compared to nearest cities:
(Note: Based on data for the last 3 years, including only cities with population 5,000 and above)
| Chatham: | 42.1 |
| Madison: | 14.5 |
| Summit: | 46.5 |
| Florham Park: | 15.2 |
| Woodland Park: | 33.6 |
| New Providence: | 16.9 |
| Short Hills: | 49.6 |
| Millburn: | 10.6 |
| Springfield: | 44.0 |
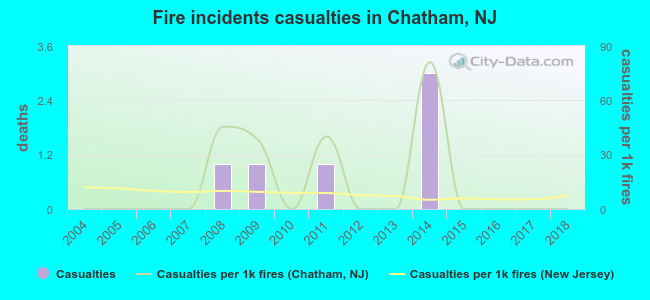 According to the data from the years 2004 - 2018 the average number of fire-related yearly casualties is 0. The highest number of reported injuries - 3 took place in 2014, and the lowest - 0 in 2004. The data has a constant trend.
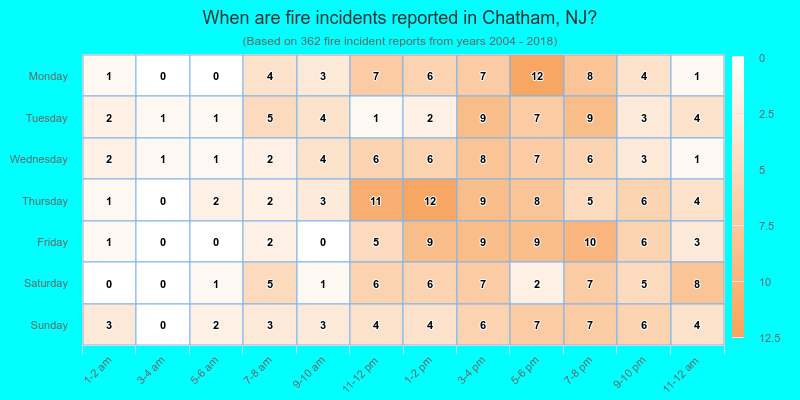
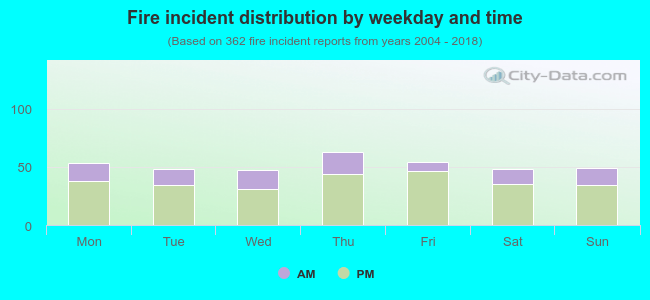 27.6% incidents where reported in the morning and 72.4% in the evening. The most fires (17.4%) took place on Thursday, and the least (13.0%) on Wednesday.
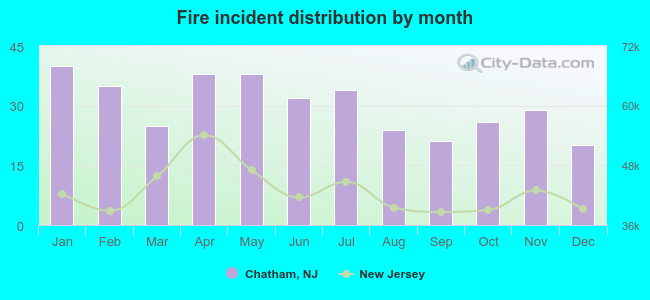 According to the 362 fire incidents from years 2004 - 2018 most fires (11.0%) took place during January, and the least (5.5%) in December.
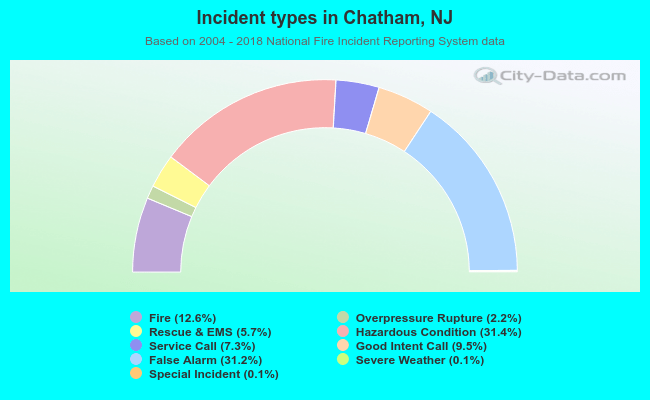 Out of all 2,882 cases reported during the years 2004 - 2018, the most belonged to the categories: Hazardous Condition (31.4%), False Alarm (31.2%), and Fire (12.6%).
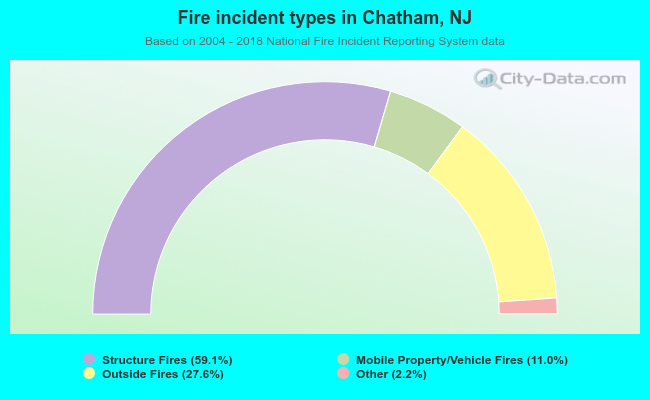 When looking into fire subcategories, the most incidents belonged to: Structure Fires (59.1%), and Outside Fires (27.6%).