Ridgecrest: Fire Incidents, California (CA)
Where are fire incidents reported in Ridgecrest, CA
Something went wrong! Please refresh the page.
| Fire incidents reported | |
|---|---|
| Sreet name | Count |
| CHINA LAKE BLVD | 136 |
| RIDGECREST BLVD | 124 |
| NORMA ST | 82 |
| GOLD CANYON DR | 42 |
| CHURCH AV | 32 |
| DENISE AVE | 32 |
| SANDERS ST | 28 |
| UPJOHN AV | 28 |
| CISCO ST | 26 |
| DOWNS ST | 24 |
| JENNIFER CT | 24 |
| SUNLAND ST | 22 |
| SUNSET ST | 22 |
| UPJOHN | 22 |
| WARNER ST | 22 |
| ALYSA CT | 20 |
| COMMERCIAL AV | 20 |
| BALSAM ST | 18 |
| E RIDGECREST BLVD | 18 |
| FRENCH AV | 18 |
| ALVORD ST | 16 |
| DENISE | 16 |
| FLORENCE ST | 16 |
| HALOID AV | 16 |
| HELENA ST | 16 |
| MARIPOSA AV | 16 |
| OASIS DR | 16 |
| RICHMOND ST | 16 |
| SILVER RIDGE ST | 16 |
| WARD | 16 |
| Other | 153 |
2005 - 2018 National Fire Incident Reporting System (NFIRS) incidents
- Incident types reported to NFIRS in Ridgecrest, CA
- 4,68951.3%Rescue & EMS
- 1,51716.6%Good Intent Call
- 1,07311.7%Fire
- 7538.2%Hazardous Condition
- 6857.5%Service Call
- 3543.9%False Alarm
- 640.7%Special Incident
- Fire incident types reported to NFIRS in Ridgecrest, CA
- 53349.7%Structure Fires
- 39036.3%Outside Fires
- 14213.2%Mobile Property/Vehicle Fires
- 80.7%Other
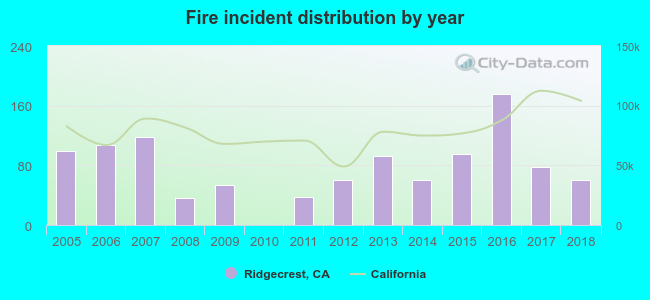 According to the data from the years 2005 - 2018 the average number of fire incidents per year is 77. The highest number of reported fires - 175 took place in 2016, and the least - 0 in 2010. The data has a dropping trend.
The average number of yearly fire incidents per 10k residents in Ridgecrest, CA compared to nearest cities:
(Note: Based on data for the last 3 years, including only cities with population 5,000 and above)
| Ridgecrest: | 36.3 |
| California City: | 5.8 |
| Tehachapi: | 34.8 |
| Golden Hills: | 27.1 |
| Rosamond: | 40.2 |
| Bear Valley Springs: | 1.9 |
| Barstow: | 2.7 |
| Lake Los Angeles: | 46.5 |
| Lancaster: | 21.1 |
 The median response time based on all reported fire incidents is 7 minutes. This is about the same as the state median value.
The median response time in Ridgecrest, CA compared to nearest cities:
(Note: Based on data for all years, including only cities with at least 500 fire incidents)
| Ridgecrest: | 7 minutes |
| Tehachapi: | 7 minutes |
| Rosamond: | 10 minutes |
| Lake Los Angeles: | 6 minutes |
| Lancaster: | 5 minutes |
| Arvin: | 7 minutes |
| Lamont: | 7 minutes |
| Palmdale: | 5 minutes |
| Oildale: | 6 minutes |
 According to the data from the years 2005 - 2018 the average number of fire-related casualties per year is 1. The highest number of casualties - 5 took place in 2016, and the lowest - 0 in 2005. The data has a constant trend.
The average number of casualties per 1,000 fire incidents is 7. This indicator was the highest - 29 in 2016, and the lowest 0 in 2005. The trend for casualties per 1,000 incidents is constant. Compared to the California value the number of casualties per 1,000 incidents is higher.
According to the data from the years 2005 - 2018 the average number of fire-related casualties per year is 1. The highest number of casualties - 5 took place in 2016, and the lowest - 0 in 2005. The data has a constant trend.
The average number of casualties per 1,000 fire incidents is 7. This indicator was the highest - 29 in 2016, and the lowest 0 in 2005. The trend for casualties per 1,000 incidents is constant. Compared to the California value the number of casualties per 1,000 incidents is higher.
 34.3% incidents where reported in the morning and 65.7% in the evening. The most fires (21.0%) took place on Saturday, and the least (11.6%) on Thursday.
 Based on the 1,073 fires from years 2005 - 2018 most fires (14.4%) took place during January, and the least (6.3%) in November.
 Out of all 9,143 cases reported during the years 2005 - 2018, the most belonged to the categories: Rescue & EMS (51.3%), Good Intent Call (16.6%), and Fire (11.7%).
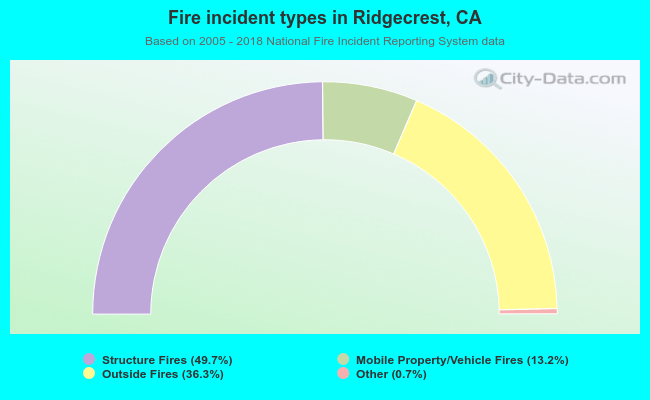 When looking into fire subcategories, the most reports belonged to: Structure Fires (49.7%), and Outside Fires (36.3%).