Lancaster: Fire Incidents, California (CA)
Where are fire incidents reported in Lancaster, CA
Something went wrong! Please refresh the page.
| Fire incidents reported | |
|---|---|
| Sreet name | Count |
| AVENUE I | 362 |
| 10TH | 264 |
| AVENUE J | 246 |
| 20TH | 222 |
| SIERRA | 212 |
| AVENUE K | 196 |
| LANCASTER | 172 |
| 15TH | 162 |
| AVENUE L | 142 |
| DIVISION | 140 |
| 30TH | 132 |
| CHALLENGER | 118 |
| GADSDEN | 98 |
| 25TH | 84 |
| AVENUE H | 84 |
| 6TH | 80 |
| 17TH | 74 |
| 5TH | 74 |
| AVENUE J8 | 74 |
| AVENUE J-8 | 72 |
| VALLEY CENTRAL | 66 |
| 60TH | 60 |
| 3RD | 58 |
| BEECH | 58 |
| 16TH | 54 |
| JACKMAN | 54 |
| DATE | 52 |
| 40TH | 50 |
| FERN | 50 |
| 50TH | 44 |
| Other | 24 |
2005 - 2018 National Fire Incident Reporting System (NFIRS) incidents
- Incident types reported to NFIRS in Lancaster, CA
- 72,89268.7%Rescue & EMS
- 19,46318.3%Good Intent Call
- 6,5136.1%False Alarm
- 3,5783.4%Fire
- 2,5602.4%Service Call
- 1,0101.0%Hazardous Condition
- Fire incident types reported to NFIRS in Lancaster, CA
- 1,86952.2%Outside Fires
- 92525.9%Structure Fires
- 54915.3%Mobile Property/Vehicle Fires
- 2356.6%Other
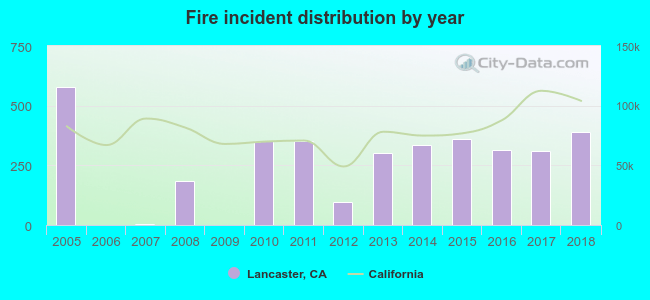 According to the data from the years 2005 - 2018 the average number of fires per year is 256. The highest number of fire incidents - 579 took place in 2005, and the least - 0 in 2006. The data has a declining trend.
The average number of yearly fire incidents per 10k residents in Lancaster, CA compared to nearest cities:
(Note: Based on data for the last 3 years, including only cities with population 5,000 and above)
| Lancaster: | 21.1 |
| Quartz Hill: | 14.4 |
| Palmdale: | 16.5 |
| Rosamond: | 40.2 |
| Acton: | 64.1 |
| Lake Los Angeles: | 46.5 |
| Santa Clarita: | 12.9 |
| Newhall: | 0.1 |
| Castaic: | 21.7 |
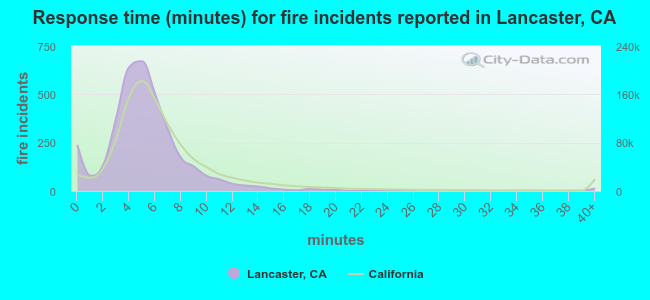 The median response time based on all reported fire incidents is 5 minutes. This is lower compared to the California median value.
The median response time in Lancaster, CA compared to nearest cities:
(Note: Based on data for all years, including only cities with at least 500 fire incidents)
| Lancaster: | 5 minutes |
| Palmdale: | 5 minutes |
| Rosamond: | 10 minutes |
| Lake Los Angeles: | 6 minutes |
| Santa Clarita: | 5 minutes |
| Altadena: | 5 minutes |
| Tehachapi: | 7 minutes |
| Glendale: | 5 minutes |
| Burbank: | 4 minutes |
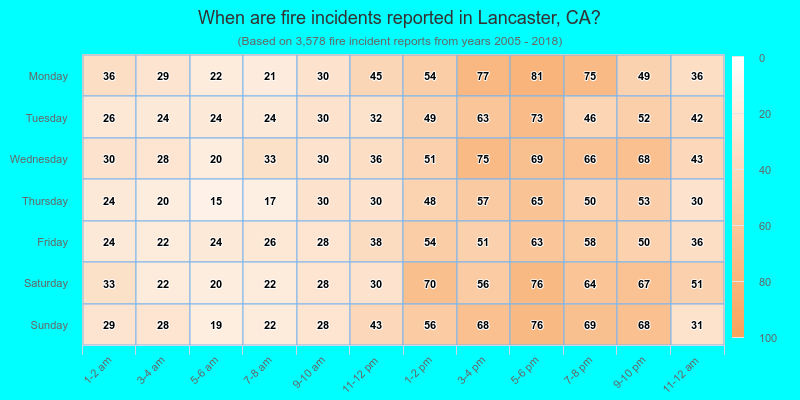
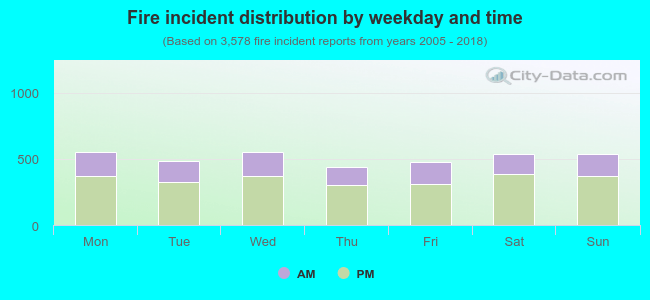 31.9% incidents where reported in the morning and 68.1% in the evening. The most fires (15.5%) took place on Monday, and the least (12.3%) on Thursday.
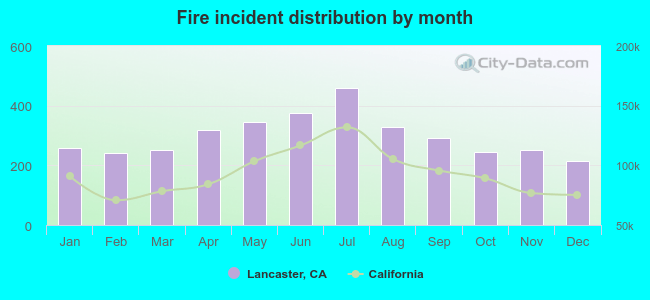 Based on the 3,578 fires from years 2005 - 2018 most fires (12.9%) took place during July, and the least (6.0%) in December.
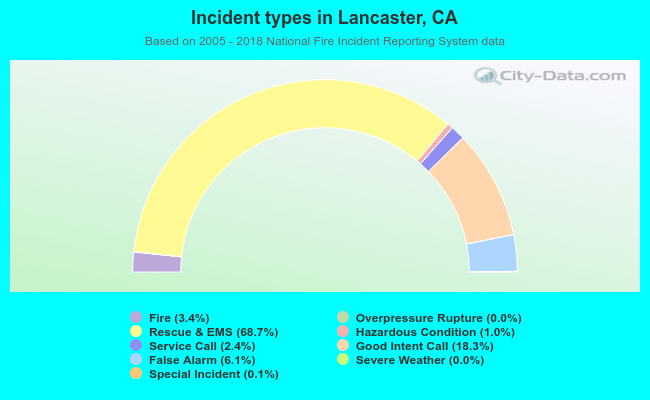 Out of all 106,106 cases reported during the years 2005 - 2018, the most belonged to the categories: Rescue & EMS (68.7%), Good Intent Call (18.3%), and False Alarm (6.1%).
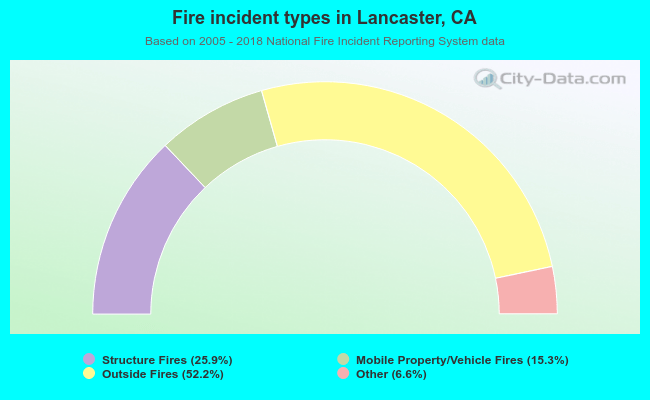 When looking into fire subcategories, the most incidents belonged to: Outside Fires (52.2%), and Structure Fires (25.9%).