Palmdale: Fire Incidents, California (CA)
Where are fire incidents reported in Palmdale, CA
Something went wrong! Please refresh the page.
| Fire incidents reported | |
|---|---|
| Sreet name | Count |
| PALMDALE | 262 |
| AVENUE R | 202 |
| 10TH | 188 |
| AVENUE | 188 |
| 25TH | 160 |
| 5TH | 134 |
| RANCHO VISTA | 122 |
| 30TH | 118 |
| 11TH | 112 |
| 47TH | 112 |
| 20TH | 98 |
| SIERRA | 80 |
| 40TH | 76 |
| AVENUE Q | 74 |
| 3RD | 60 |
| 12TH | 56 |
| 6TH | 56 |
| OLD HAROLD | 56 |
| PEARBLOSSOM | 54 |
| 15TH | 50 |
| 35TH | 48 |
| DIVISION | 48 |
| 37TH | 42 |
| 55TH | 42 |
| AVENUE R12 | 38 |
| 27TH | 36 |
| 4TH | 36 |
| 42ND | 34 |
| AVENUE Q4 | 32 |
| AVENUE R-8 | 32 |
| Other | 231 |
2005 - 2018 National Fire Incident Reporting System (NFIRS) incidents
- Incident types reported to NFIRS in Palmdale, CA
- 45,12167.1%Rescue & EMS
- 13,84720.6%Good Intent Call
- 3,2704.9%False Alarm
- 2,8774.3%Fire
- 1,3172.0%Service Call
- 7141.1%Hazardous Condition
- 750.1%Special Incident
- Fire incident types reported to NFIRS in Palmdale, CA
- 1,51052.5%Outside Fires
- 68323.7%Structure Fires
- 51517.9%Mobile Property/Vehicle Fires
- 1695.9%Other
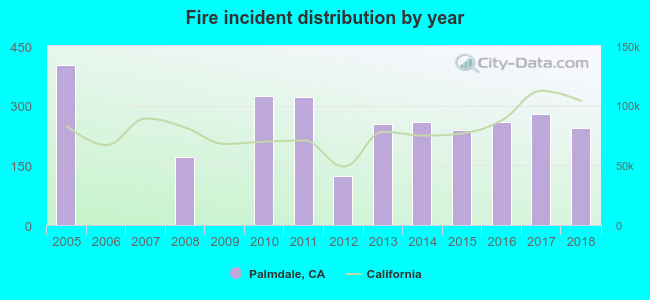 According to the data from the years 2005 - 2018 the average number of fires per year is 206. The highest number of fire incidents - 401 took place in 2005, and the least - 0 in 2006. The data has a decreasing trend.
The average number of yearly fire incidents per 10k residents in Palmdale, CA compared to nearest cities:
(Note: Based on data for the last 3 years, including only cities with population 5,000 and above)
| Palmdale: | 16.5 |
| Lancaster: | 21.1 |
| Quartz Hill: | 14.4 |
| Acton: | 64.1 |
| Lake Los Angeles: | 46.5 |
| Rosamond: | 40.2 |
| Santa Clarita: | 12.9 |
| La Canada Flintridge: | 0.5 |
| Newhall: | 0.1 |
 The median response time based on all reported fire incidents is 5 minutes. This is lower compared to the state median value.
The median response time in Palmdale, CA compared to nearest cities:
(Note: Based on data for all years, including only cities with at least 500 fire incidents)
| Palmdale: | 5 minutes |
| Lancaster: | 5 minutes |
| Lake Los Angeles: | 6 minutes |
| Rosamond: | 10 minutes |
| Santa Clarita: | 5 minutes |
| Altadena: | 5 minutes |
| Pasadena: | 5 minutes |
| Glendale: | 5 minutes |
| Burbank: | 4 minutes |
 29.3% incidents where reported in the morning and 70.7% in the evening. The most fires (14.9%) took place on Saturday, and the least (13.4%) on Wednesday.
 Based on the 2,877 incident reports from years 2005 - 2018 most fires (16.5%) took place during July, and the least (6.0%) in December.
 Out of all 67,250 cases reported during the years 2005 - 2018, the most belonged to the categories: Rescue & EMS (67.1%), Good Intent Call (20.6%), and False Alarm (4.9%).
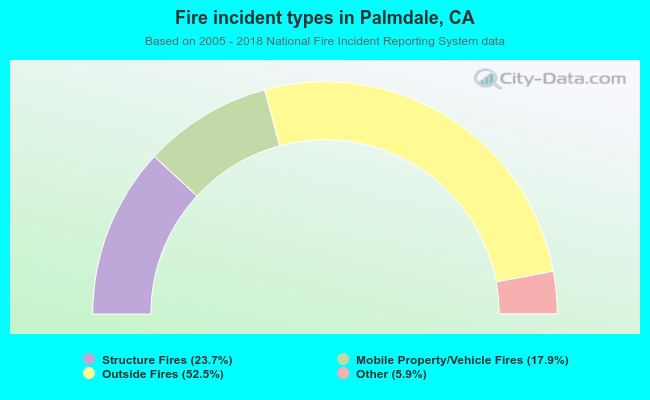 When looking into fire subcategories, the most incidents belonged to: Outside Fires (52.5%), and Structure Fires (23.7%).