Arvin: Fire Incidents, California (CA)
Where are fire incidents reported in Arvin, CA
Something went wrong! Please refresh the page.
| Fire incidents reported | |
|---|---|
| Sreet name | Count |
| BEAR MOUNTAIN BLVD | 142 |
| WALNUT DR | 84 |
| MONROE ST | 50 |
| DERBY ST | 46 |
| MEYER ST | 46 |
| HAVEN DR | 44 |
| BUSH ST | 42 |
| DURHAM ST | 28 |
| SYCAMORE RD | 26 |
| SYCAMORE RD | 26 |
| CAMPUS DR | 22 |
| COMANCHE DR | 22 |
| FRANKLIN ST | 20 |
| TUCKER ST | 20 |
| 5TH | 18 |
| 5TH AV | 18 |
| HILL ST | 18 |
| MARY ST | 18 |
| WALKER ST | 16 |
| A ST | 14 |
| ACALA ST | 14 |
| EL CAMINO REAL | 14 |
| ORANGE AV | 14 |
| RICHARD ST | 14 |
| S DERBY ST | 14 |
| E SYCAMORE RD | 12 |
| GROVE ST | 12 |
| HOOD ST | 12 |
| HWY 223 | 12 |
| MEYER ST | 12 |
2005 - 2018 National Fire Incident Reporting System (NFIRS) incidents
- Incident types reported to NFIRS in Arvin, CA
- 2,31451.4%Rescue & EMS
- 80317.8%Good Intent Call
- 79717.7%Fire
- 2555.7%Hazardous Condition
- 1984.4%Service Call
- 1222.7%False Alarm
- 60.1%Overpressure Rupture
- Fire incident types reported to NFIRS in Arvin, CA
- 39849.9%Outside Fires
- 24530.7%Structure Fires
- 15319.2%Mobile Property/Vehicle Fires
- 10.1%Other
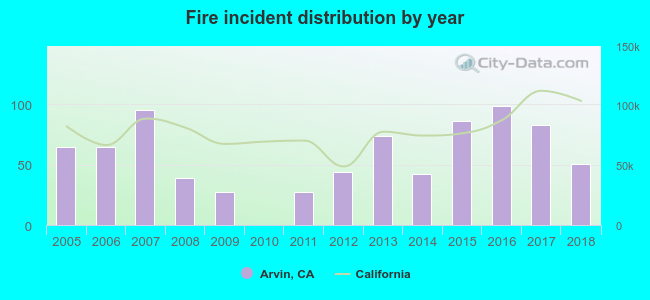 According to the data from the years 2005 - 2018 the average number of fire incidents per year is 57. The highest number of fire incidents - 99 took place in 2016, and the least - 0 in 2010. The data has a declining trend.
The average number of yearly fire incidents per 10k residents in Arvin, CA compared to nearest cities:
(Note: Based on data for the last 3 years, including only cities with population 5,000 and above)
| Arvin: | 37.7 |
| Lamont: | 28.2 |
| Bear Valley Springs: | 1.9 |
| Bakersfield: | 64.4 |
| Oildale: | 38.1 |
| Golden Hills: | 27.1 |
| Greenacres: | 11.4 |
| Tehachapi: | 34.8 |
| Rosedale: | 1.1 |
 The median response time based on all reported fire incidents is 7 minutes. This is close to the state median value.
The median response time in Arvin, CA compared to nearest cities:
(Note: Based on data for all years, including only cities with at least 500 fire incidents)
| Arvin: | 7 minutes |
| Lamont: | 7 minutes |
| Bakersfield: | 7 minutes |
| Oildale: | 6 minutes |
| Tehachapi: | 7 minutes |
| Lebec: | 10 minutes |
| Shafter: | 7 minutes |
| Taft: | 6 minutes |
| Wasco: | 7 minutes |
 According to the reports from the years 2005 - 2018 the average number of fire-related yearly casualties is 1. The highest number of reported injuries - 3 took place in 2012, and the lowest - 0 in 2006. The data has a constant trend.
The average number of casualties per 1,000 fire incidents is 9. This indicator was the highest - 68 in 2012, and the lowest 0 in 2006. The trend for injuries per 1,000 incidents is increasing. Compared to the California value the number of injuries per 1,000 incidents is higher.
According to the reports from the years 2005 - 2018 the average number of fire-related yearly casualties is 1. The highest number of reported injuries - 3 took place in 2012, and the lowest - 0 in 2006. The data has a constant trend.
The average number of casualties per 1,000 fire incidents is 9. This indicator was the highest - 68 in 2012, and the lowest 0 in 2006. The trend for injuries per 1,000 incidents is increasing. Compared to the California value the number of injuries per 1,000 incidents is higher.
 32.6% incidents where reported in the morning and 67.4% in the evening. The most fires (18.3%) took place on Sunday, and the least (11.9%) on Saturday.
 Based on the 797 incident reports from years 2005 - 2018 most fires (14.4%) took place during July, and the least (3.1%) in February.
 Out of all 4,499 cases reported during the years 2005 - 2018, the most belonged to the categories: Rescue & EMS (51.4%), Good Intent Call (17.8%), and Fire (17.7%).
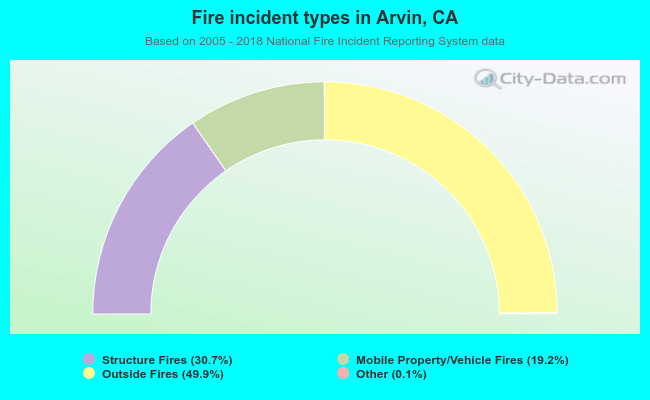 When looking into fire subcategories, the most incidents belonged to: Outside Fires (49.9%), and Structure Fires (30.7%).