California City: Fire Incidents, California (CA)
Where are fire incidents reported in California City, CA
Something went wrong! Please refresh the page.
|
| |||||||||||||||||||||||||||||||||||||||||||||||||||||||||||||||||||||||||||||||||||||||||||||||||||||||||||||
2005 - 2018 National Fire Incident Reporting System (NFIRS) incidents
- Incident types reported to NFIRS in California City, CA
- 71676.8%Good Intent Call
- 13114.1%Fire
- 333.5%Rescue & EMS
- 272.9%Hazardous Condition
- 212.3%Service Call
- 30.3%False Alarm
- 10.1%Overpressure Rupture
- Fire incident types reported to NFIRS in California City, CA
- 10177.1%Structure Fires
- 1713.0%Outside Fires
- 139.9%Mobile Property/Vehicle Fires
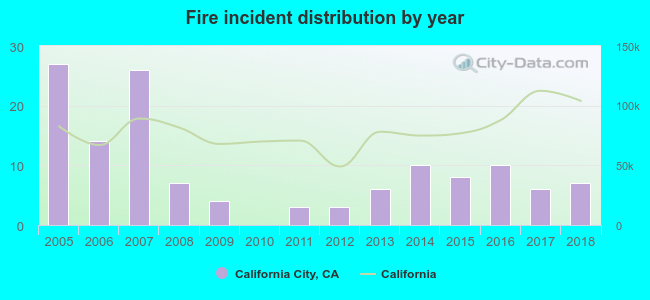 According to the data from the years 2005 - 2018 the average number of fires per year is 9. The highest number of fire incidents - 27 took place in 2005, and the least - 0 in 2010. The data has a declining trend.
The average number of yearly fire incidents per 10k residents in California City, CA compared to nearest cities:
(Note: Based on data for the last 3 years, including only cities with population 5,000 and above)
| California City: | 5.8 |
| Rosamond: | 40.2 |
| Tehachapi: | 34.8 |
| Ridgecrest: | 36.3 |
| Golden Hills: | 27.1 |
| Lancaster: | 21.1 |
| Lake Los Angeles: | 46.5 |
| Quartz Hill: | 14.4 |
| Palmdale: | 16.5 |

 26.7% incidents where reported in the morning and 73.3% in the evening. The most fires (22.1%) took place on Wednesday, and the least (9.9%) on Tuesday.
 According to the 131 fires from years 2005 - 2018 most fires (13.0%) took place during July, and the least (3.1%) in October.
 Out of all 932 cases reported during the years 2005 - 2018, the most belonged to the categories: Good Intent Call (76.8%), Fire (14.1%), and Rescue & EMS (3.5%).
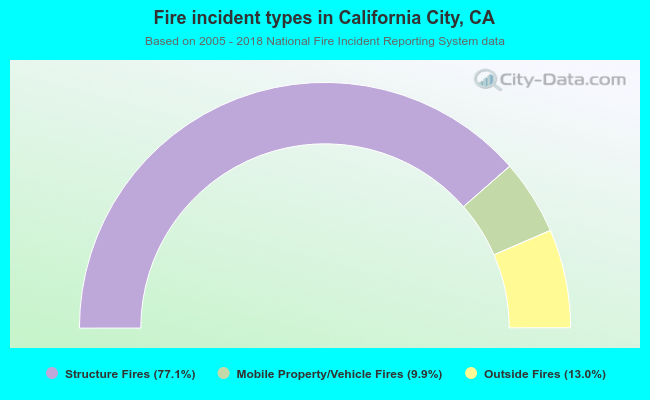 When looking into fire subcategories, the most reports belonged to: Structure Fires (77.1%), and Outside Fires (13.0%).