Lindenwold: Fire Incidents, New Jersey (NJ)
Where are fire incidents reported in Lindenwold, NJ
Something went wrong! Please refresh the page.
| Fire incidents reported | |
|---|---|
| Sreet name | Count |
| GIBBSBORO RD | 794 |
| LAUREL RD | 414 |
| WHITE HORSE PIKE | 258 |
| CHEWS LANDING RD | 120 |
| OAK AVE | 114 |
| EGG HARBOR RD | 84 |
| BLACKWOOD CLEMENTON RD | 82 |
| BILPER AVE | 70 |
| OAK ST | 66 |
| BERLIN RD | 60 |
| WHITE HORSE | 58 |
| ELM AVE | 52 |
| EMERSON AVE | 52 |
| LINDEN AVE | 42 |
| UNITED STATES AVE | 36 |
| BILPER | 32 |
| BLACKWOOD RD | 32 |
| MYRTLE AVE | 32 |
| COLONIAL SQUARE DR | 28 |
| MAPLE AVE | 28 |
| PARK AVE | 28 |
| WHITE HORSE PIKE | 28 |
| OAK | 24 |
| LINDEN | 22 |
| NORCROSS AVE | 20 |
| PINELAWN | 20 |
| 6TH AVE | 18 |
| MAPLE | 18 |
| UNITED STATES | 18 |
| WHITE HORSE AVE | 18 |
2002 - 2018 National Fire Incident Reporting System (NFIRS) incidents
- Incident types reported to NFIRS in Lindenwold, NJ
- 1,91735.0%Hazardous Condition
- 1,72831.6%Fire
- 65512.0%False Alarm
- 64511.8%Good Intent Call
- 2694.9%Service Call
- 2434.4%Rescue & EMS
- 80.1%Special Incident
- Fire incident types reported to NFIRS in Lindenwold, NJ
- 1,12865.3%Structure Fires
- 48728.2%Outside Fires
- 975.6%Mobile Property/Vehicle Fires
- 160.9%Other
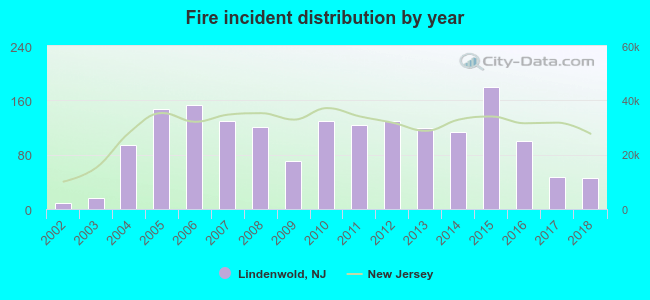 Based on the data from the years 2002 - 2018 the average number of fire incidents per year is 102. The highest number of fires - 180 took place in 2015, and the least - 9 in 2002. The data has a growing trend.
The average number of yearly fire incidents per 10k residents in Lindenwold, NJ compared to nearest cities:
(Note: Based on data for the last 3 years, including only cities with population 5,000 and above)
| Lindenwold: | 36.9 |
| Stratford: | 51.4 |
| Pine Hill: | 69.8 |
| Somerdale: | 85.5 |
| Berlin: | 33.1 |
| Barrington: | 61.0 |
| Runnemede: | 46.2 |
| Haddon Heights: | 29.4 |
| Haddonfield: | 26.9 |
 The median response time based on all reported fire incidents is 7 minutes. This is higher than the New Jersey median value.
The median response time in Lindenwold, NJ compared to nearest cities:
(Note: Based on data for all years, including only cities with at least 500 fire incidents)
| Lindenwold: | 7 minutes |
| Clementon: | 6 minutes |
| Pine Hill: | 6 minutes |
| Berlin: | 5 minutes |
| Magnolia: | 6 minutes |
| Blackwood: | 6 minutes |
| Barrington: | 7 minutes |
| Runnemede: | 7 minutes |
| Turnersville: | 7 minutes |
 Based on the data from the years 2002 - 2018 the average number of fire-related yearly casualties is 0. The highest number of casualties - 2 took place in 2006, and the lowest - 0 in 2002. The data has a constant trend.
The average number of casualties per 1,000 fires is 3. This indicator was the highest - 17 in 2008, and the lowest 0 in 2002. The trend for injuries per 1,000 fires is constant. Compared to the state value the number of casualties per 1,000 incidents is much lower.
Based on the data from the years 2002 - 2018 the average number of fire-related yearly casualties is 0. The highest number of casualties - 2 took place in 2006, and the lowest - 0 in 2002. The data has a constant trend.
The average number of casualties per 1,000 fires is 3. This indicator was the highest - 17 in 2008, and the lowest 0 in 2002. The trend for injuries per 1,000 fires is constant. Compared to the state value the number of casualties per 1,000 incidents is much lower.Casualties per 1,000 incidents in Lindenwold, NJ compared to nearest cities:
(Note: Based on data for all years, including only cities with at least 500 fire incidents)
| Lindenwold: | 4.1 |
| Clementon: | 3.3 |
| Pine Hill: | 0.7 |
| Berlin: | 0.0 |
| Magnolia: | 5.7 |
| Blackwood: | 7.5 |
| Barrington: | 0.0 |
| Runnemede: | 0.0 |
| Turnersville: | 13.6 |
 34.4% incidents where reported in the morning and 65.6% in the evening. The most fires (17.0%) took place on Sunday, and the least (12.2%) on Tuesday.
 According to the 1,728 fires from years 2002 - 2018 most fires (10.2%) took place during January, and the least (6.2%) in June.
 Out of all 5,470 cases reported during the years 2002 - 2018, the most belonged to the categories: Hazardous Condition (35.0%), Fire (31.6%), and False Alarm (12.0%).
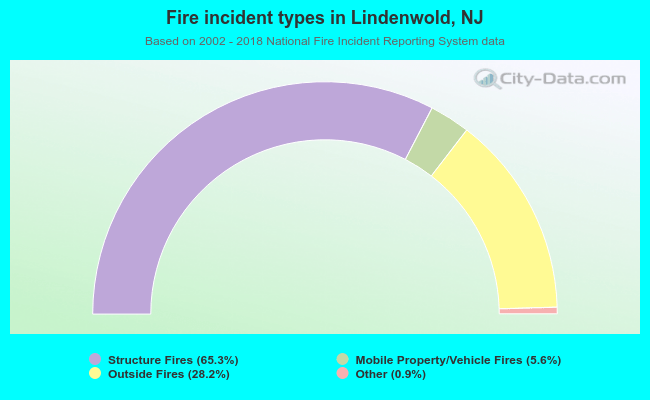 When looking into fire subcategories, the most reports belonged to: Structure Fires (65.3%), and Outside Fires (28.2%).