Fayetteville: Fire Incidents, Georgia (GA)
Where are fire incidents reported in Fayetteville, GA
Something went wrong! Please refresh the page.
| Fire incidents reported | |
|---|---|
| Sreet name | Count |
| 85 HWY | 226 |
| 54 HWY | 224 |
| 92 HWY | 214 |
| GLYNN ST | 156 |
| PAVILION PKY | 120 |
| LANIER AVE | 96 |
| 314 HWY | 92 |
| JEFF DAVIS DR | 92 |
| REDWINE RD | 72 |
| SANDY CREEK RD | 72 |
| KNIGHT WAY | 58 |
| 279 HWY | 48 |
| MCDONOUGH RD | 48 |
| BANKS RD | 44 |
| COBBLESTONE BLVD | 40 |
| FIRST MANASSAS MILE | 40 |
| INMAN RD | 40 |
| TYRONE RD | 38 |
| NEW HOPE RD | 36 |
| ADAMS RD | 34 |
| HOOD AVE | 34 |
| BANKS STA | 32 |
| EBENEZER RD | 32 |
| LONGVIEW RD | 28 |
| RIVERS RD | 28 |
| 1ST MANASSAS MILE | 26 |
| BUSBIN RD | 26 |
| CHASE DR | 26 |
| GINGERCAKE RD | 26 |
| GOZA RD | 26 |
| Other | 1,442 |
2002 - 2018 National Fire Incident Reporting System (NFIRS) incidents
- Incident types reported to NFIRS in Fayetteville, GA
- 40,63166.9%Rescue & EMS
- 4,9888.2%Good Intent Call
- 4,2527.0%Service Call
- 4,2036.9%Hazardous Condition
- 3,5165.8%Fire
- 3,0325.0%False Alarm
- 620.1%Special Incident
- Fire incident types reported to NFIRS in Fayetteville, GA
- 1,48842.3%Structure Fires
- 1,45841.5%Outside Fires
- 48513.8%Mobile Property/Vehicle Fires
- 852.4%Other
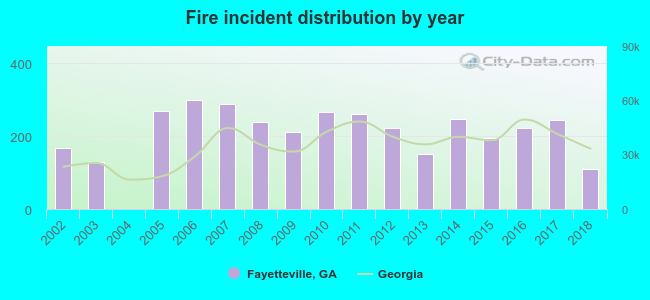 According to the data from the years 2002 - 2018 the average number of fire incidents per year is 207. The highest number of reported fires - 298 took place in 2006, and the least - 0 in 2004. The data has a decreasing trend.
The average number of yearly fire incidents per 10k residents in Fayetteville, GA compared to nearest cities:
(Note: Based on data for the last 3 years, including only cities with population 5,000 and above)
| Fayetteville: | 114.4 |
| Peachtree City: | 15.6 |
| Tyrone: | 30.8 |
| Riverdale: | 147.4 |
| Union City: | 69.7 |
| Fairburn: | 60.6 |
| Hampton: | 159.3 |
| Morrow: | 142.3 |
| Forest Park: | 76.9 |
 The median response time based on all reported fire incidents is 6 minutes. This is comparable to the Georgia median value.
The median response time in Fayetteville, GA compared to nearest cities:
(Note: Based on data for all years, including only cities with at least 500 fire incidents)
| Fayetteville: | 6 minutes |
| Peachtree City: | 5 minutes |
| Jonesboro: | 6 minutes |
| Riverdale: | 5 minutes |
| Union City: | 5 minutes |
| Fairburn: | 6 minutes |
| Hampton: | 8 minutes |
| Senoia: | 7 minutes |
| Morrow: | 5 minutes |
 According to the data from the years 2002 - 2018 the average number of fire-related fatalities per year is 0. The highest number of reported deaths - 3 took place in 2014, and the lowest - 0 in 2002. The data has a constant trend.
The average number of deaths per 1,000 fire incidents is 2. This indicator was the highest - 12 in 2014, and the lowest 0 in 2002. The trend for fatalities per 1,000 incidents is constant. Compared to the state value the number of deaths per 1,000 fire incidents is lower.
According to the data from the years 2002 - 2018 the average number of fire-related fatalities per year is 0. The highest number of reported deaths - 3 took place in 2014, and the lowest - 0 in 2002. The data has a constant trend.
The average number of deaths per 1,000 fire incidents is 2. This indicator was the highest - 12 in 2014, and the lowest 0 in 2002. The trend for fatalities per 1,000 incidents is constant. Compared to the state value the number of deaths per 1,000 fire incidents is lower.Deaths per 1,000 incidents in Fayetteville, GA compared to nearest cities:
(Note: Based on data for all years, including only cities with at least 2,500 fire incidents)
| Fayetteville: | 1.7 |
| Jonesboro: | 1.1 |
| Riverdale: | 1.0 |
| College Park: | 1.9 |
| Stockbridge: | 2.3 |
| Griffin: | 2.1 |
| McDonough: | 0.7 |
| Newnan: | 0.5 |
| Atlanta: | 3.1 |
 Based on the reports from the years 2002 - 2018 the average number of fire-related casualties per year is 3. The highest number of casualties - 6 took place in 2015, and the lowest - 0 in 2004. The data has a growing trend.
The average number of casualties per 1,000 fire incidents is 13. This indicator was the highest - 31 in 2015, and the lowest 0 in 2004. The trend for injuries per 1,000 fires is increasing. Compared to the state value the number of injuries per 1,000 fire incidents is higher.
Based on the reports from the years 2002 - 2018 the average number of fire-related casualties per year is 3. The highest number of casualties - 6 took place in 2015, and the lowest - 0 in 2004. The data has a growing trend.
The average number of casualties per 1,000 fire incidents is 13. This indicator was the highest - 31 in 2015, and the lowest 0 in 2004. The trend for injuries per 1,000 fires is increasing. Compared to the state value the number of injuries per 1,000 fire incidents is higher.Casualties per 1,000 incidents in Fayetteville, GA compared to nearest cities:
(Note: Based on data for all years, including only cities with at least 500 fire incidents)
| Fayetteville: | 12.2 |
| Peachtree City: | 3.8 |
| Jonesboro: | 11.6 |
| Riverdale: | 10.6 |
| Union City: | 4.5 |
| Fairburn: | 7.5 |
| Hampton: | 6.7 |
| Senoia: | 0.0 |
| Morrow: | 13.0 |
 26.6% incidents where reported in the morning and 73.4% in the evening. The most fires (17.2%) took place on Saturday, and the least (12.8%) on Tuesday.
 Based on the 3,516 fire incident reports from years 2002 - 2018 most fires (12.6%) took place during March, and the least (5.2%) in September.
 Out of all 60,779 cases reported during the years 2002 - 2018, the most belonged to the categories: Rescue & EMS (66.9%), Good Intent Call (8.2%), and Service Call (7.0%).
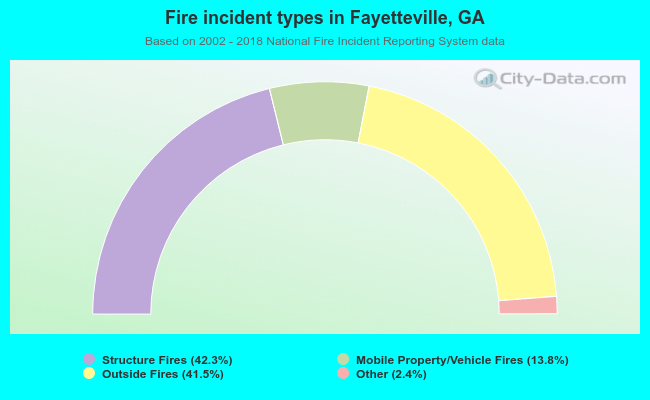 When looking into fire subcategories, the most incidents belonged to: Structure Fires (42.3%), and Outside Fires (41.5%).