Griffin: Fire Incidents, Georgia (GA)
Where are fire incidents reported in Griffin, GA
Something went wrong! Please refresh the page.
| Fire incidents reported | |
|---|---|
| Sreet name | Count |
| MCINTOSH RD | 162 |
| HILL ST | 158 |
| EXPRESS WAY | 150 |
| NORTHSIDE DR | 140 |
| OLD ATLANTA RD | 110 |
| NEWNAN RD | 108 |
| MCDONOUGH RD | 104 |
| POPLAR ST | 94 |
| JACKSON RD | 92 |
| ELLIS RD | 90 |
| WALKERS MILL RD | 88 |
| TAYLOR ST | 84 |
| MERIWETHER ST | 82 |
| EXPRESSWAY HWY | 78 |
| WILLIAMSON RD | 78 |
| HIGH FALLS RD | 76 |
| 9TH ST | 74 |
| EXPRESSWAY | 72 |
| ZEBULON RD | 72 |
| CARVER RD | 68 |
| PATTERSON RD | 68 |
| 8TH ST | 66 |
| SOLOMON ST | 60 |
| PINE HILL RD | 52 |
| KILGORE RD | 50 |
| TEAMON RD | 50 |
| SCHOOL RD | 48 |
| 16 HWY | 46 |
| EVEREE INN RD | 46 |
| COLLEGE ST | 44 |
| Other | 1,687 |
2002 - 2018 National Fire Incident Reporting System (NFIRS) incidents
- Incident types reported to NFIRS in Griffin, GA
- 9,74836.3%Rescue & EMS
- 4,71317.6%Hazardous Condition
- 4,19715.6%Fire
- 3,57913.3%Service Call
- 2,87310.7%Good Intent Call
- 1,5535.8%False Alarm
- 740.3%Overpressure Rupture
- 560.2%Severe Weather
- 490.2%Special Incident
- Fire incident types reported to NFIRS in Griffin, GA
- 1,65539.4%Structure Fires
- 1,62038.6%Outside Fires
- 86920.7%Mobile Property/Vehicle Fires
- 531.3%Other
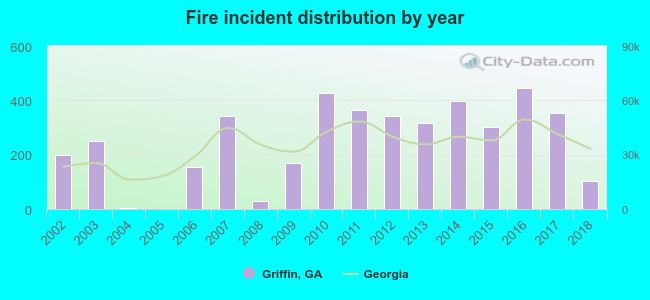 Based on the data from the years 2002 - 2018 the average number of fire incidents per year is 247. The highest number of reported fires - 445 took place in 2016, and the least - 1 in 2005. The data has a declining trend.
The average number of yearly fire incidents per 10k residents in Griffin, GA compared to nearest cities:
(Note: Based on data for the last 3 years, including only cities with population 5,000 and above)
| Griffin: | 128.7 |
| Hampton: | 159.3 |
| Locust Grove: | 116.9 |
| Barnesville: | 151.9 |
| McDonough: | 109.3 |
| Fayetteville: | 114.4 |
| Stockbridge: | 65.5 |
| Peachtree City: | 15.6 |
| Morrow: | 142.3 |
 The median response time based on all reported fire incidents is 5 minutes. This is lower than the state median value.
The median response time in Griffin, GA compared to nearest cities:
(Note: Based on data for all years, including only cities with at least 500 fire incidents)
| Griffin: | 5 minutes |
| Hampton: | 8 minutes |
| Locust Grove: | 8 minutes |
| Barnesville: | 6 minutes |
| McDonough: | 7 minutes |
| Senoia: | 7 minutes |
| Fayetteville: | 6 minutes |
| Jackson: | 6 minutes |
| Jonesboro: | 6 minutes |
 According to the reports from the years 2002 - 2018 the average number of fire-related yearly deaths is 1. The highest number of reported deaths - 4 took place in 2016, and the lowest - 0 in 2002. The data has a constant trend.
The average number of fatalities per 1,000 fire incidents is 1. This indicator was the highest - 9 in 2016, and the lowest 0 in 2002. The trend for deaths per 1,000 fire incidents is constant. Compared to the Georgia value the number of fatalities per 1,000 fire incidents is about the same.
According to the reports from the years 2002 - 2018 the average number of fire-related yearly deaths is 1. The highest number of reported deaths - 4 took place in 2016, and the lowest - 0 in 2002. The data has a constant trend.
The average number of fatalities per 1,000 fire incidents is 1. This indicator was the highest - 9 in 2016, and the lowest 0 in 2002. The trend for deaths per 1,000 fire incidents is constant. Compared to the Georgia value the number of fatalities per 1,000 fire incidents is about the same.Deaths per 1,000 incidents in Griffin, GA compared to nearest cities:
(Note: Based on data for all years, including only cities with at least 2,500 fire incidents)
| Griffin: | 2.1 |
| McDonough: | 0.7 |
| Fayetteville: | 1.7 |
| Jackson: | 0.8 |
| Jonesboro: | 1.1 |
| Stockbridge: | 2.3 |
| Riverdale: | 1.0 |
| College Park: | 1.9 |
| Newnan: | 0.5 |
 Based on the reports from the years 2002 - 2018 the average number of fire-related casualties per year is 3. The highest number of casualties - 13 took place in 2017, and the lowest - 0 in 2004. The data has a declining trend.
The average number of casualties per 1,000 fires is 8. This indicator was the highest - 37 in 2017, and the lowest 0 in 2004. The trend for casualties per 1,000 fires is decreasing. Compared to the Georgia value the number of injuries per 1,000 fires is about the same.
Based on the reports from the years 2002 - 2018 the average number of fire-related casualties per year is 3. The highest number of casualties - 13 took place in 2017, and the lowest - 0 in 2004. The data has a declining trend.
The average number of casualties per 1,000 fires is 8. This indicator was the highest - 37 in 2017, and the lowest 0 in 2004. The trend for casualties per 1,000 fires is decreasing. Compared to the Georgia value the number of injuries per 1,000 fires is about the same.Casualties per 1,000 incidents in Griffin, GA compared to nearest cities:
(Note: Based on data for all years, including only cities with at least 500 fire incidents)
| Griffin: | 10.2 |
| Hampton: | 6.7 |
| Locust Grove: | 6.1 |
| Barnesville: | 0.0 |
| McDonough: | 5.9 |
| Senoia: | 0.0 |
| Fayetteville: | 12.2 |
| Jackson: | 2.0 |
| Jonesboro: | 11.6 |
 26.2% incidents where reported in the morning and 73.8% in the evening. The most fires (15.5%) took place on Saturday, and the least (12.7%) on Friday.
 According to the 4,197 incident reports from years 2002 - 2018 most fires (12.2%) took place during March, and the least (6.6%) in August.
 Out of all 26,842 cases reported during the years 2002 - 2018, the most belonged to the categories: Rescue & EMS (36.3%), Hazardous Condition (17.6%), and Fire (15.6%).
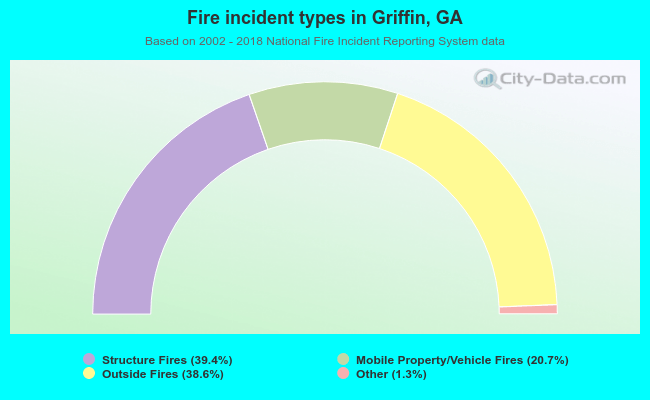 When looking into fire subcategories, the most reports belonged to: Structure Fires (39.4%), and Outside Fires (38.6%).