Peachtree City: Fire Incidents, Georgia (GA)
Where are fire incidents reported in Peachtree City, GA
Something went wrong! Please refresh the page.
| Fire incidents reported | |
|---|---|
| Sreet name | Count |
| HWY 74 | 178 |
| PEACHTREE PARKWAY | 122 |
| HWY 54 | 120 |
| CROSSTOWN DR | 88 |
| STEVENS ENTRY | 62 |
| DIVIDEND DR | 60 |
| PEACHTREE STATION CIR | 56 |
| ROBINSON RD | 56 |
| WYNNMEADE PKY | 32 |
| MERRICK DR | 28 |
| CITY CIR | 24 |
| FAIRFIELD DR | 24 |
| ROCKAWAY RD | 24 |
| SWEETGUM RD | 24 |
| WISDOM RD | 24 |
| GRENOBLE RD | 22 |
| HYACINTH LANE | 22 |
| PEACHTREE PKY | 22 |
| PETROL PT | 22 |
| HUDDLESTON RD | 20 |
| WALT BANKS RD | 20 |
| WILLOWBEND RD | 20 |
| COMMERCE DR | 18 |
| DOUBLETRACE LANE | 18 |
| FALCON DR | 18 |
| MCINTOSH TRL | 18 |
| ROCKSPRAY RDGE | 18 |
| SMOKE RISE TRAC | 18 |
| WESTPARK DR | 18 |
| HIP POCKET RD | 16 |
| Other | 388 |
2002 - 2018 National Fire Incident Reporting System (NFIRS) incidents
- Incident types reported to NFIRS in Peachtree City, GA
- 12,73363.9%Rescue & EMS
- 1,6488.3%Hazardous Condition
- 1,6008.0%Fire
- 1,5627.8%False Alarm
- 1,4757.4%Service Call
- 7783.9%Good Intent Call
- 690.3%Special Incident
- 330.2%Severe Weather
- 300.2%Overpressure Rupture
- Fire incident types reported to NFIRS in Peachtree City, GA
- 79549.7%Outside Fires
- 52532.8%Structure Fires
- 24315.2%Mobile Property/Vehicle Fires
- 372.3%Other
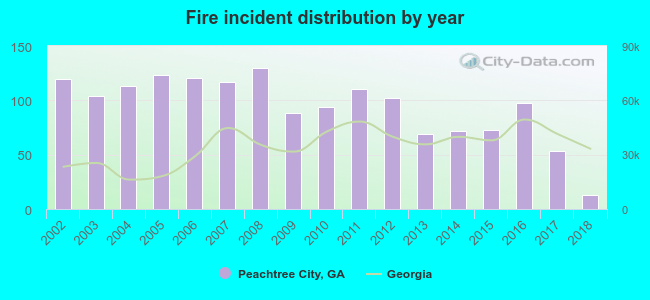 Based on the data from the years 2002 - 2018 the average number of fire incidents per year is 94. The highest number of fire incidents - 130 took place in 2008, and the least - 13 in 2018. The data has a decreasing trend.
The average number of yearly fire incidents per 10k residents in Peachtree City, GA compared to nearest cities:
(Note: Based on data for the last 3 years, including only cities with population 5,000 and above)
| Peachtree City: | 15.6 |
| Tyrone: | 30.8 |
| Fayetteville: | 114.4 |
| Fairburn: | 60.6 |
| Union City: | 69.7 |
| Newnan: | 88.9 |
| Riverdale: | 147.4 |
| Hampton: | 159.3 |
| Morrow: | 142.3 |
 The median response time based on all reported fire incidents is 5 minutes. This is lower compared to the Georgia median value.
The median response time in Peachtree City, GA compared to nearest cities:
(Note: Based on data for all years, including only cities with at least 500 fire incidents)
| Peachtree City: | 5 minutes |
| Sharpsburg: | 6 minutes |
| Senoia: | 7 minutes |
| Fayetteville: | 6 minutes |
| Palmetto: | 6 minutes |
| Fairburn: | 6 minutes |
| Union City: | 5 minutes |
| Newnan: | 6 minutes |
| Riverdale: | 5 minutes |
 Based on the reports from the years 2002 - 2018 the average number of fire-related yearly deaths is 0. The highest number of reported deaths - 1 took place in 2004, and the lowest - 0 in 2002. The data has a constant trend.
 Based on the reports from the years 2002 - 2018 the average number of fire-related yearly casualties is 0. The highest number of reported injuries - 2 took place in 2003, and the lowest - 0 in 2002. The data has a constant trend.
The average number of casualties per 1,000 fires is 3. This indicator was the highest - 20 in 2012, and the lowest 0 in 2002. The trend for casualties per 1,000 fires is constant. Compared to the Georgia value the number of casualties per 1,000 fire incidents is much lower.
Based on the reports from the years 2002 - 2018 the average number of fire-related yearly casualties is 0. The highest number of reported injuries - 2 took place in 2003, and the lowest - 0 in 2002. The data has a constant trend.
The average number of casualties per 1,000 fires is 3. This indicator was the highest - 20 in 2012, and the lowest 0 in 2002. The trend for casualties per 1,000 fires is constant. Compared to the Georgia value the number of casualties per 1,000 fire incidents is much lower.Casualties per 1,000 incidents in Peachtree City, GA compared to nearest cities:
(Note: Based on data for all years, including only cities with at least 500 fire incidents)
| Peachtree City: | 3.8 |
| Sharpsburg: | 6.1 |
| Senoia: | 0.0 |
| Fayetteville: | 12.2 |
| Palmetto: | 6.6 |
| Fairburn: | 7.5 |
| Union City: | 4.5 |
| Newnan: | 3.2 |
| Riverdale: | 10.6 |
 26.1% incidents where reported in the morning and 73.9% in the evening. The most fires (17.1%) took place on Saturday, and the least (12.6%) on Tuesday.
 Based on the 1,600 incident reports from years 2002 - 2018 most fires (11.1%) took place during March, and the least (6.1%) in September.
 Out of all 19,928 cases reported during the years 2002 - 2018, the most belonged to the categories: Rescue & EMS (63.9%), Hazardous Condition (8.3%), and Fire (8.0%).
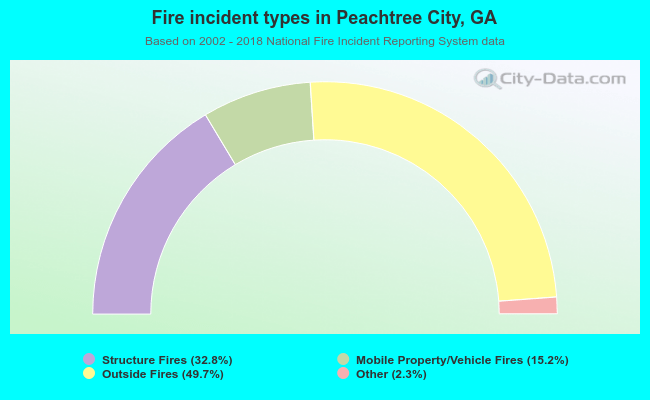 When looking into fire subcategories, the most reports belonged to: Outside Fires (49.7%), and Structure Fires (32.8%).