Tyrone: Fire Incidents, Georgia (GA)
Where are fire incidents reported in Tyrone, GA
Something went wrong! Please refresh the page.
|
| |||||||||||||||||||||||||||||||||||||||||||||||||||||||||||||||||||||||||||||||||||||||||||||||||||||||||||||
2002 - 2018 National Fire Incident Reporting System (NFIRS) incidents
- Incident types reported to NFIRS in Tyrone, GA
- 2,69254.7%Rescue & EMS
- 51710.5%Service Call
- 50410.2%Hazardous Condition
- 4108.3%Fire
- 3887.9%Good Intent Call
- 3877.9%False Alarm
- 130.3%Special Incident
- 60.1%Severe Weather
- Fire incident types reported to NFIRS in Tyrone, GA
- 20550.0%Outside Fires
- 13833.7%Structure Fires
- 5513.4%Mobile Property/Vehicle Fires
- 122.9%Other
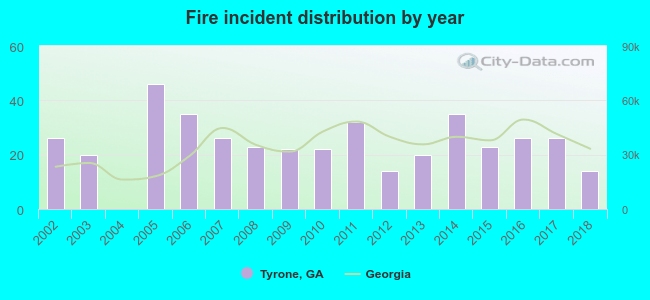 Based on the data from the years 2002 - 2018 the average number of fire incidents per year is 24. The highest number of fires - 46 took place in 2005, and the least - 0 in 2004. The data has a decreasing trend.
The average number of yearly fire incidents per 10k residents in Tyrone, GA compared to nearest cities:
(Note: Based on data for the last 3 years, including only cities with population 5,000 and above)
| Tyrone: | 30.8 |
| Peachtree City: | 15.6 |
| Fairburn: | 60.6 |
| Fayetteville: | 114.4 |
| Union City: | 69.7 |
| Riverdale: | 147.4 |
| Newnan: | 88.9 |
| College Park: | 167.6 |
| East Point: | 37.5 |

 Based on the reports from the years 2002 - 2018 the average number of fire-related casualties per year is 0. The highest number of reported injuries - 1 took place in 2003, and the lowest - 0 in 2002. The data has a constant trend.
 22.7% incidents where reported in the morning and 77.3% in the evening. The most fires (16.8%) took place on Saturday, and the least (11.7%) on Thursday.
 Based on the 410 incident reports from years 2002 - 2018 most fires (12.4%) took place during February, and the least (4.4%) in August.
 Out of all 4,920 cases reported during the years 2002 - 2018, the most belonged to the categories: Rescue & EMS (54.7%), Service Call (10.5%), and Hazardous Condition (10.2%).
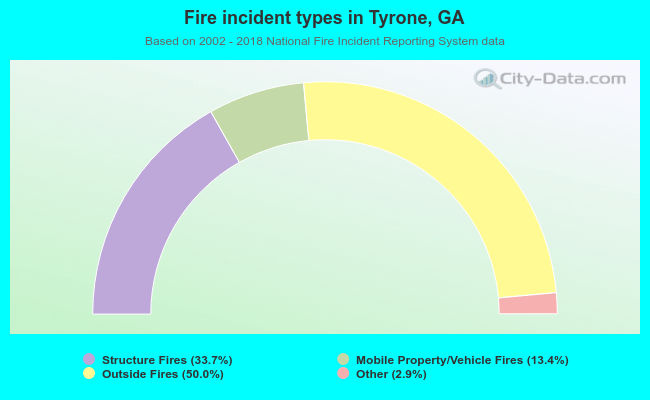 When looking into fire subcategories, the most incidents belonged to: Outside Fires (50.0%), and Structure Fires (33.7%).