Forest Park: Fire Incidents, Georgia (GA)
Where are fire incidents reported in Forest Park, GA
Something went wrong! Please refresh the page.
| Fire incidents reported | |
|---|---|
| Sreet name | Count |
| JONESBORO RD | 342 |
| OLD DIXIE HWY | 184 |
| 75 INTS | 170 |
| FOREST PKY | 168 |
| MORROW RD | 148 |
| OLD DIXIE RD | 126 |
| COURTNEY DR | 116 |
| MAIN ST | 106 |
| 285 INTS | 96 |
| GOVERNORS DR | 86 |
| CONLEY RD | 70 |
| ROCK CUT RD | 66 |
| FRONTAGE RD | 56 |
| FOREST AVE | 54 |
| HENDRIX DR | 52 |
| WALDROP DR | 52 |
| ASH ST | 48 |
| PHILLIPS DR | 40 |
| COLLEGE ST | 38 |
| KENNESAW DR | 38 |
| SOUTH AVE | 38 |
| SYLVIA DR | 38 |
| I75N | 36 |
| GEORGIA AVE | 34 |
| LAKE MIRROR RD | 34 |
| LEE CIR | 28 |
| WEST ST | 28 |
| MURRAY LAKE CIR | 26 |
| ROCK SPRINGS ST | 26 |
| 85 HWY | 24 |
2002 - 2018 National Fire Incident Reporting System (NFIRS) incidents
- Incident types reported to NFIRS in Forest Park, GA
- 15,49859.2%Rescue & EMS
- 2,77710.6%Hazardous Condition
- 2,3609.0%Service Call
- 2,2758.7%Fire
- 1,8106.9%Good Intent Call
- 1,3745.3%False Alarm
- 270.1%Special Incident
- Fire incident types reported to NFIRS in Forest Park, GA
- 85537.6%Outside Fires
- 81635.9%Structure Fires
- 55824.5%Mobile Property/Vehicle Fires
- 462.0%Other
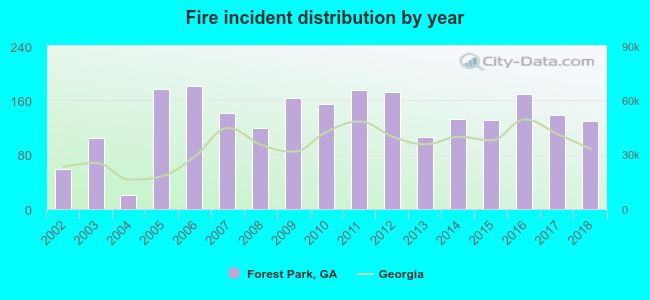 Based on the data from the years 2002 - 2018 the average number of fires per year is 134. The highest number of fire incidents - 181 took place in 2006, and the least - 21 in 2004. The data has a growing trend.
The average number of yearly fire incidents per 10k residents in Forest Park, GA compared to nearest cities:
(Note: Based on data for the last 3 years, including only cities with population 5,000 and above)
| Forest Park: | 76.9 |
| Conley: | 53.0 |
| Morrow: | 142.3 |
| Hapeville: | 43.0 |
| Riverdale: | 147.4 |
| College Park: | 167.6 |
| East Point: | 37.5 |
| Gresham Park: | 5.4 |
| Stockbridge: | 65.5 |
 The median response time based on all reported fire incidents is 6 minutes. This is about the same as the state median value.
The median response time in Forest Park, GA compared to nearest cities:
(Note: Based on data for all years, including only cities with at least 500 fire incidents)
| Forest Park: | 6 minutes |
| Morrow: | 5 minutes |
| Hapeville: | 3 minutes |
| Riverdale: | 5 minutes |
| College Park: | 6 minutes |
| East Point: | 6 minutes |
| Jonesboro: | 6 minutes |
| Stockbridge: | 7 minutes |
| Atlanta: | 5 minutes |
 According to the reports from the years 2002 - 2018 the average number of fire-related yearly deaths is 0. The highest number of reported deaths - 2 took place in 2002, and the lowest - 0 in 2003. The data has a dropping trend.
 Based on the reports from the years 2002 - 2018 the average number of fire-related casualties per year is 5. The highest number of casualties - 10 took place in 2011, and the lowest - 0 in 2004. The data has a growing trend.
The average number of casualties per 1,000 fire incidents is 35. This indicator was the highest - 68 in 2014, and the lowest 0 in 2004. The trend for injuries per 1,000 fires is growing. Compared to the Georgia value the number of casualties per 1,000 incidents is much higher.
Based on the reports from the years 2002 - 2018 the average number of fire-related casualties per year is 5. The highest number of casualties - 10 took place in 2011, and the lowest - 0 in 2004. The data has a growing trend.
The average number of casualties per 1,000 fire incidents is 35. This indicator was the highest - 68 in 2014, and the lowest 0 in 2004. The trend for injuries per 1,000 fires is growing. Compared to the Georgia value the number of casualties per 1,000 incidents is much higher.Casualties per 1,000 incidents in Forest Park, GA compared to nearest cities:
(Note: Based on data for all years, including only cities with at least 500 fire incidents)
| Forest Park: | 36.9 |
| Morrow: | 13.0 |
| Hapeville: | 0.0 |
| Riverdale: | 10.6 |
| College Park: | 4.6 |
| East Point: | 9.2 |
| Jonesboro: | 11.6 |
| Stockbridge: | 11.6 |
| Atlanta: | 6.7 |
 30.4% incidents where reported in the morning and 69.6% in the evening. The most fires (15.6%) took place on Friday, and the least (13.0%) on Wednesday.
 According to the 2,275 incident reports from years 2002 - 2018 most fires (10.1%) took place during January, and the least (6.7%) in April.
 Out of all 26,162 cases reported during the years 2002 - 2018, the most belonged to the categories: Rescue & EMS (59.2%), Hazardous Condition (10.6%), and Service Call (9.0%).
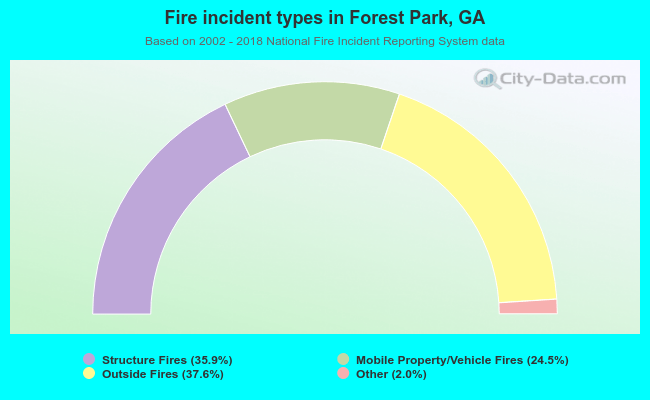 When looking into fire subcategories, the most reports belonged to: Outside Fires (37.6%), and Structure Fires (35.9%).