Conley: Fire Incidents, Georgia (GA)
Where are fire incidents reported in Conley, GA
Something went wrong! Please refresh the page.
|
| |||||||||||||||||||||||||||||||||||||||||||||||||||||||||||||||||||||||||||||||||||||||||||||||||||||||||||||
2003 - 2018 National Fire Incident Reporting System (NFIRS) incidents
- Incident types reported to NFIRS in Conley, GA
- 3,17467.9%Rescue & EMS
- 4209.0%Good Intent Call
- 3758.0%Service Call
- 3277.0%Fire
- 2355.0%Hazardous Condition
- 1252.7%False Alarm
- 90.2%Special Incident
- 50.1%Overpressure Rupture
- Fire incident types reported to NFIRS in Conley, GA
- 13441.0%Outside Fires
- 10130.9%Structure Fires
- 8626.3%Mobile Property/Vehicle Fires
- 61.8%Other
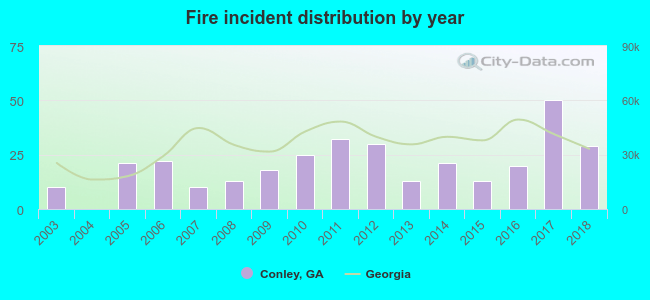 According to the data from the years 2003 - 2018 the average number of fire incidents per year is 20. The highest number of fires - 50 took place in 2017, and the least - 0 in 2004. The data has an increasing trend.
The average number of yearly fire incidents per 10k residents in Conley, GA compared to nearest cities:
(Note: Based on data for the last 3 years, including only cities with population 5,000 and above)
| Conley: | 53.0 |
| Forest Park: | 76.9 |
| Hapeville: | 43.0 |
| Morrow: | 142.3 |
| Gresham Park: | 5.4 |
| Riverdale: | 147.4 |
| College Park: | 167.6 |
| East Point: | 37.5 |
| Atlanta: | 36.1 |

 37.6% incidents where reported in the morning and 62.4% in the evening. The most fires (15.6%) took place on Thursday, and the least (11.9%) on Tuesday.
 According to the 327 incident reports from years 2003 - 2018 most fires (14.4%) took place during January, and the least (4.9%) in October.
 Out of all 4,674 cases reported during the years 2003 - 2018, the most belonged to the categories: Rescue & EMS (67.9%), Good Intent Call (9.0%), and Service Call (8.0%).
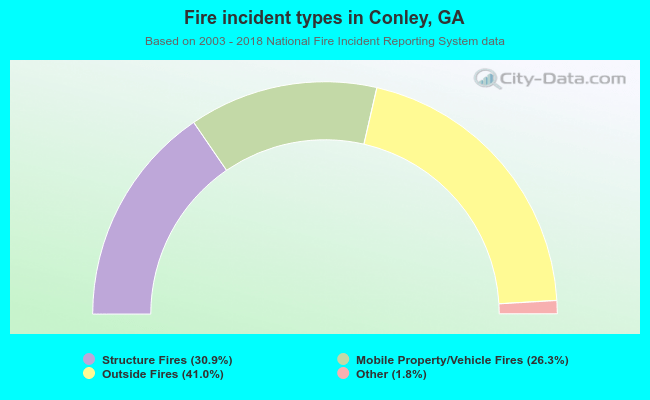 When looking into fire subcategories, the most reports belonged to: Outside Fires (41.0%), and Structure Fires (30.9%).