Estimated zip code population in 2022: 40,975 Zip code population in 2010: 34,794 Zip code population in 2000: 12,925
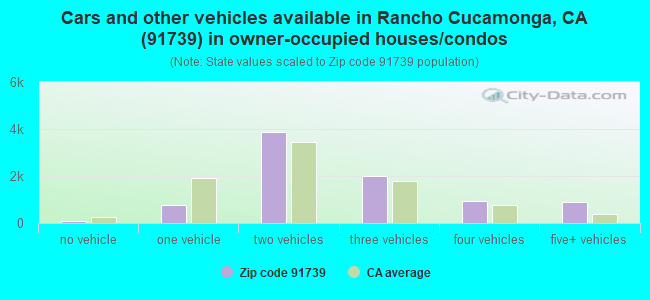
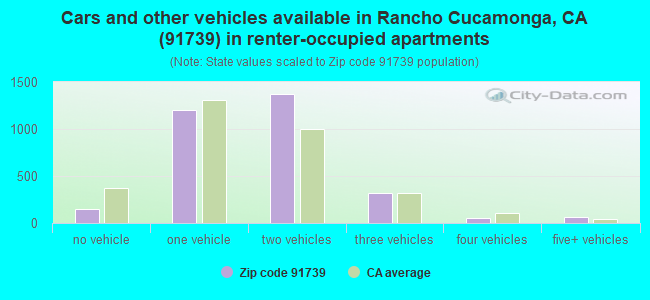
Houses and condos: 12,361 Renter-occupied apartments: 3,165
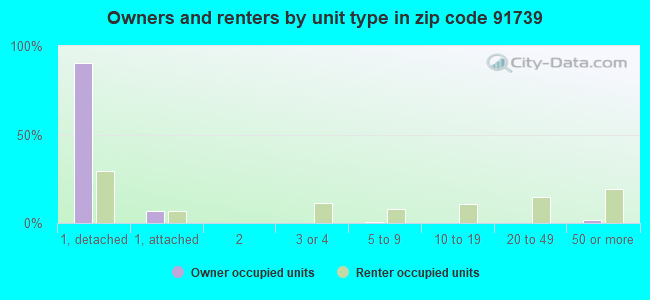
% of renters here:
27%
State:
44%
March 2022 cost of living index in zip code 91739: 83.0 (low, U.S. average is 100)
Land area: 29.4 sq. mi. Water area: 0.0 sq. mi.
Population density: 1,394 people per square mile
(low).
OSM Map
General Map
Google Map
MSN Map
OSM Map
General Map
Google Map
MSN Map
OSM Map
General Map
Google Map
MSN Map
OSM Map
General Map
Google Map
MSN Map
Please wait while loading the map...
Real estate property taxes paid for housing units in 2022:
This zip code:
0.9% ($7,771)
California:
0.7% ($4,831)
Median real estate property taxes paid for housing units with mortgages in 2022: $8,092 (0.9%) Median real estate property taxes paid for housing units with no mortgage in 2022: $6,923 (0.9%)
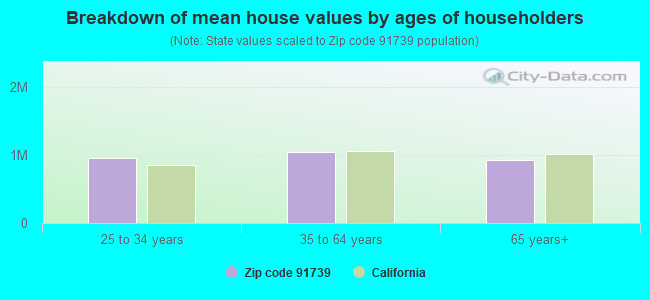
Estimated median house/condo value in 2022: $867,159
91739:
$867,159
California:
$715,900
According to our research of California and other state lists, there were 19 registered sex offenders living in 91739 zip code as of May 03, 2024. The ratio of all residents to sex offenders in zip code 91739 is 2,065 to 1. The ratio of registered sex offenders to all residents in this zip code is much lower than the state average.
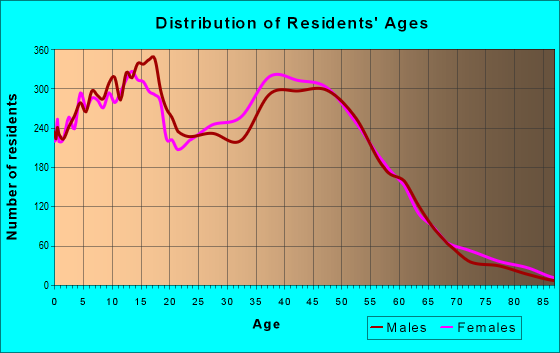
Median resident age:
This zip code:
36.8 years
California median age:
37.9 years
Average household size:
This zip code:
3.3 people
California:
2.8 people
Averages for the 2020 tax year for zip code 91739, filed in 2021:
Average Adjusted Gross Income (AGI) in 2020: $103,542 (Individual Income Tax Returns)
Here:
$103,542
State:
$95,910
Salary/wage: $87,498 (reported on 82.7% of returns)
Here:
$87,498
State:
$77,331
(% of AGI for various income ranges: 1152.8% for AGIs below $25k, 3651.3% for AGIs $25k-50k, 7463.0% for AGIs $50k-75k, 11374.8% for AGIs $75k-100k, 21220.8% for AGIs $100k-200k, 81634.9% for AGIs over 200k)
Taxable interest for individuals: $2,419 (reported on 40.5% of returns)
This zip code:
$2,419
California:
$2,294
(% of AGI for various income ranges: 17.9% for AGIs below $25k, 26.6% for AGIs $25k-50k, 43.9% for AGIs $50k-75k, 68.7% for AGIs $75k-100k, 113.1% for AGIs $100k-200k, 1936.1% for AGIs over 200k)
Ordinary dividends: $7,548 (reported on 18.0% of returns)
Here:
$7,548
State:
$10,949
(% of AGI for various income ranges: 14.9% for AGIs below $25k, 19.6% for AGIs $25k-50k, 43.6% for AGIs $50k-75k, 65.8% for AGIs $75k-100k, 125.6% for AGIs $100k-200k, 2968.2% for AGIs over 200k)
Net capital gain/loss in AGI: +$18,313 (reported on 19.8% of returns)
Here:
+$18,313
State:
+$49,306
(% of AGI for various income ranges: 7.9% for AGIs below $25k, 56.4% for AGIs $25k-50k, 89.3% for AGIs $50k-75k, 112.9% for AGIs $75k-100k, 457.4% for AGIs $100k-200k, 7839.1% for AGIs over 200k)
Profit/loss from business: +$14,975 (reported on 21.1% of returns)
Here:
+$14,975
State:
+$15,671
(% of AGI for various income ranges: 161.9% for AGIs below $25k, 401.4% for AGIs $25k-50k, 413.5% for AGIs $50k-75k, 458.4% for AGIs $75k-100k, 511.5% for AGIs $100k-200k, 3216.9% for AGIs over 200k)
Taxable individual retirement arrangement distribution: $21,314 (reported on 5.0% of returns)
91739:
$21,314
California:
$23,505
(% of AGI for various income ranges: 23.1% for AGIs below $25k, 76.8% for AGIs $25k-50k, 124.8% for AGIs $50k-75k, 266.2% for AGIs $75k-100k, 429.3% for AGIs $100k-200k, 582.4% for AGIs over 200k)
Self-employed (Keogh) retirement plans: $40,660 (reported on 1.1% of returns)
91739:
$40,660
California:
$30,163
(% of AGI for various income ranges: 40.3% for AGIs $100k-200k, 1095.2% for AGIs over 200k)
Total itemized deductions: $37,964 (reported on 25.8% of returns)
Here:
$37,964
State:
$39,517
(% of AGI for various income ranges: 108.5% for AGIs below $25k, 289.4% for AGIs $25k-50k, 779.2% for AGIs $50k-75k, 1591.8% for AGIs $75k-100k, 3158.4% for AGIs $100k-200k, 11658.8% for AGIs over 200k)
Charity contributions: $7,947 (reported on 22.5% of returns)
Here:
$7,947
State:
$12,598
(% of AGI for various income ranges: 5.9% for AGIs below $25k, 31.0% for AGIs $25k-50k, 94.3% for AGIs $50k-75k, 207.6% for AGIs $75k-100k, 538.3% for AGIs $100k-200k, 2611.6% for AGIs over 200k)
Taxes paid: $9,391 (reported on 25.8% of returns)
91739:
$9,391
State:
$8,807
(% of AGI for various income ranges: 24.9% for AGIs below $25k, 74.7% for AGIs $25k-50k, 225.1% for AGIs $50k-75k, 479.2% for AGIs $75k-100k, 925.4% for AGIs $100k-200k, 2266.6% for AGIs over 200k)
Earned income credit: $2,049 (reported on 12.0% of returns)
Here:
$2,049
State:
$2,074
(% of AGI for various income ranges: 76.2% for AGIs below $25k, 75.3% for AGIs $25k-50k, 0.9% for AGIs $50k-75k)
Percentage of individuals using paid preparers for their 2020 taxes: 93.3%
Here:
93%
State:
92%
(% for various income ranges: 93.0% for AGIs below $25k, 93.1% for AGIs $25k-50k, 93.1% for AGIs $50k-75k, 91.4% for AGIs $75k-100k, 93.8% for AGIs $100k-200k, 95.2% for AGIs over 200k)
Averages for the 2012 tax year for zip code 91739, filed in 2013:
Average Adjusted Gross Income (AGI) in 2012: $82,305 (Individual Income Tax Returns)
Here:
$82,305
State:
$72,726
Salary/wage: $74,188 (reported on 87.4% of returns)
Here:
$74,188
State:
$59,079
(% of AGI for various income ranges: 77.3% for AGIs below $25k, 81.3% for AGIs $25k-50k, 84.9% for AGIs $50k-75k, 84.4% for AGIs $75k-100k, 87.6% for AGIs $100k-200k, 62.8% for AGIs over 200k)
Taxable interest for individuals: $828 (reported on 43.2% of returns)
This zip code:
$828
California:
$2,146
(% of AGI for various income ranges: 0.9% for AGIs below $25k, 0.5% for AGIs $25k-50k, 0.4% for AGIs $50k-75k, 0.3% for AGIs $75k-100k, 0.3% for AGIs $100k-200k, 0.6% for AGIs over 200k)
Ordinary dividends: $2,621 (reported on 15.4% of returns)
Here:
$2,621
State:
$9,308
(% of AGI for various income ranges: 0.7% for AGIs below $25k, 0.6% for AGIs $25k-50k, 0.3% for AGIs $50k-75k, 0.5% for AGIs $75k-100k, 0.4% for AGIs $100k-200k, 0.6% for AGIs over 200k)
Net capital gain/loss in AGI: +$7,129 (reported on 14.0% of returns)
Here:
+$7,129
State:
+$30,460
(% of AGI for various income ranges: 0.2% for AGIs $25k-50k, 0.1% for AGIs $50k-75k, 0.5% for AGIs $75k-100k, 0.2% for AGIs $100k-200k, 3.6% for AGIs over 200k)
Profit/loss from business: +$14,710 (reported on 19.2% of returns)
Here:
+$14,710
State:
+$17,064
(% of AGI for various income ranges: 12.7% for AGIs below $25k, 7.6% for AGIs $25k-50k, 3.8% for AGIs $50k-75k, 3.0% for AGIs $75k-100k, 2.3% for AGIs $100k-200k, 2.5% for AGIs over 200k)
Taxable individual retirement arrangement distribution: $16,406 (reported on 5.3% of returns)
91739:
$16,406
California:
$19,557
(% of AGI for various income ranges: 1.8% for AGIs below $25k, 1.5% for AGIs $25k-50k, 1.2% for AGIs $50k-75k, 1.2% for AGIs $75k-100k, 0.9% for AGIs $100k-200k, 0.9% for AGIs over 200k)
Self-employment retirement plans: $31,917 (reported on 0.8% of returns)
91739:
$31,917
California:
$24,530
(% of AGI for various income ranges: 0.2% for AGIs $25k-50k, 0.2% for AGIs $100k-200k, 0.8% for AGIs over 200k)
Total itemized deductions: $34,669 (27% of AGI, reported on 53.3% of returns)
Here:
$34,669
State:
$34,004
Here:
26.9% of AGI
State:
22.7% of AGI
(% of AGI for various income ranges: 14.3% for AGIs below $25k, 18.8% for AGIs $25k-50k, 23.0% for AGIs $50k-75k, 25.1% for AGIs $75k-100k, 25.0% for AGIs $100k-200k, 20.1% for AGIs over 200k)
Charity contributions: $4,327 (reported on 46.7% of returns)
Here:
$4,327
State:
$4,659
(% of AGI for various income ranges: 0.8% for AGIs below $25k, 1.8% for AGIs $25k-50k, 2.4% for AGIs $50k-75k, 2.4% for AGIs $75k-100k, 2.5% for AGIs $100k-200k, 2.8% for AGIs over 200k)
Taxes paid: $12,767 (reported on 53.3% of returns)
91739:
$12,767
State:
$14,448
(% of AGI for various income ranges: 3.8% for AGIs below $25k, 4.8% for AGIs $25k-50k, 6.6% for AGIs $50k-75k, 8.0% for AGIs $75k-100k, 9.0% for AGIs $100k-200k, 9.6% for AGIs over 200k)
Earned income credit: $2,153 (reported on 13.0% of returns)
Here:
$2,153
State:
$2,286
(% of AGI for various income ranges: 6.0% for AGIs below $25k, 1.2% for AGIs $25k-50k)
Percentage of individuals using paid preparers for their 2012 taxes: 66.7%
Here:
67%
State:
64%
(% for various income ranges: 58.0% for AGIs below $25k, 63.4% for AGIs $25k-50k, 69.9% for AGIs $50k-75k, 70.7% for AGIs $75k-100k, 73.1% for AGIs $100k-200k, 79.4% for AGIs over 200k)
Averages for the 2004 tax year for zip code 91739, filed in 2005:
Average Adjusted Gross Income (AGI) in 2004: $70,680 (Individual Income Tax Returns)
Here:
$70,680
State:
$58,600
Salary/wage: $63,848 (reported on 89.8% of returns)
Here:
$63,848
State:
$49,455
(% of AGI for various income ranges: 241.6% for AGIs below $10k, 81.3% for AGIs $10k-25k, 85.6% for AGIs $25k-50k, 88.0% for AGIs $50k-75k, 89.0% for AGIs $75k-100k, 75.3% for AGIs over 100k)
Taxable interest for individuals: $906 (reported on 53.5% of returns)
This zip code:
$906
California:
$2,365
(% of AGI for various income ranges: 9.2% for AGIs below $10k, 1.1% for AGIs $10k-25k, 0.7% for AGIs $25k-50k, 0.5% for AGIs $50k-75k, 0.5% for AGIs $75k-100k, 0.7% for AGIs over 100k)
Taxable dividends: $1,232 (reported on 18.2% of returns)
Here:
$1,232
State:
$4,746
(% of AGI for various income ranges: 2.9% for AGIs below $10k, 0.4% for AGIs $10k-25k, 0.3% for AGIs $25k-50k, 0.3% for AGIs $50k-75k, 0.2% for AGIs $75k-100k, 0.3% for AGIs over 100k)
Net capital gain/loss: +$14,662 (reported on 16.7% of returns)
Here:
+$14,662
State:
+$23,418
(% of AGI for various income ranges: 1.9% for AGIs below $10k, 0.1% for AGIs $10k-25k, 0.3% for AGIs $25k-50k, 1.0% for AGIs $50k-75k, 1.2% for AGIs $75k-100k, 5.5% for AGIs over 100k)
Profit/loss from business: +$16,340 (reported on 20.4% of returns)
Here:
+$16,340
State:
+$16,826
(% of AGI for various income ranges: 8.2% for AGIs below $10k, 10.6% for AGIs $10k-25k, 7.0% for AGIs $25k-50k, 4.9% for AGIs $50k-75k, 3.2% for AGIs $75k-100k, 4.3% for AGIs over 100k)
IRA payment deduction: $3,293 (reported on 2.8% of returns)
91739:
$3,293
California:
$3,192
(% of AGI for various income ranges: 0.2% for AGIs $10k-25k, 0.2% for AGIs $25k-50k, 0.2% for AGIs $50k-75k, 0.1% for AGIs $75k-100k, 0.1% for AGIs over 100k)
Self-employed pension: $16,085 (reported on 1.1% of returns)
Here:
$16,085
California:
$17,688
(% of AGI for various income ranges: 0.1% for AGIs $25k-50k, 0.1% for AGIs $50k-75k, 0.1% for AGIs $75k-100k, 0.4% for AGIs over 100k)
Total itemized deductions: $31,979 (31% of AGI, reported on 60.3% of returns)
Here:
$31,979
State:
$28,113
Here:
31.0% of AGI
State:
25.3% of AGI
(% of AGI for various income ranges: 53.8% for AGIs below $10k, 19.5% for AGIs $10k-25k, 28.2% for AGIs $25k-50k, 31.9% for AGIs $50k-75k, 32.1% for AGIs $75k-100k, 24.9% for AGIs over 100k)
Charity contributions deductions: $3,725 (3% of AGI, reported on 55.5% of returns)
Here:
$3,725
State:
$3,923
Here:
3.5% of AGI
State:
3.3% of AGI
(% of AGI for various income ranges: 1.9% for AGIs below $10k, 1.3% for AGIs $10k-25k, 2.9% for AGIs $25k-50k, 3.1% for AGIs $50k-75k, 3.3% for AGIs $75k-100k, 2.9% for AGIs over 100k)
Total tax: $10,413 (reported on 80.6% of returns)
91739:
$10,413
State:
$10,761
(% of AGI for various income ranges: 8.6% for AGIs below $10k, 5.0% for AGIs $10k-25k, 6.1% for AGIs $25k-50k, 7.0% for AGIs $50k-75k, 7.7% for AGIs $75k-100k, 15.7% for AGIs over 100k)
Earned income credit: $1,674 (reported on 9.6% of returns)
Here:
$1,674
State:
$1,763
Percentage of individuals using paid preparers for their 2004 taxes: 69.3%
Here:
69%
State:
66%
(% for various income ranges: 54.8% for AGIs below $10k, 64.9% for AGIs $10k-25k, 69.3% for AGIs $25k-50k, 71.6% for AGIs $50k-75k, 75.3% for AGIs $75k-100k, 77.1% for AGIs over 100k)
Likely homosexual households (counted as self-reported same-sex unmarried-partner households)
Lesbian couples: 0.1% of all households
Gay men: 0.6% of all households
Household received Food Stamps/SNAP in the past 12 months: 519 Household did not receive Food Stamps/SNAP in the past 12 months: 11,061
Women who had a birth in the past 12 months: 365 (278 now married, 87 unmarried) Women who did not have a birth in the past 12 months: 9,318 (4,392 now married, 4,896 unmarried)
Housing units in zip code 91739 with a mortgage: 6,927 (713 second mortgage, 38 home equity loan, 547 both second mortgage and home equity loan) Houses without a mortgage: 64
Median monthly owner costs for units with a mortgage: $3,272 Median monthly owner costs for units without a mortgage: $1,017
Residents with income below the poverty level in 2022:
This zip code:
4.9%
Whole state:
12.2%
Residents with income below 50% of the poverty level in 2022:
This zip code:
1.7%
Whole state:
6.2%
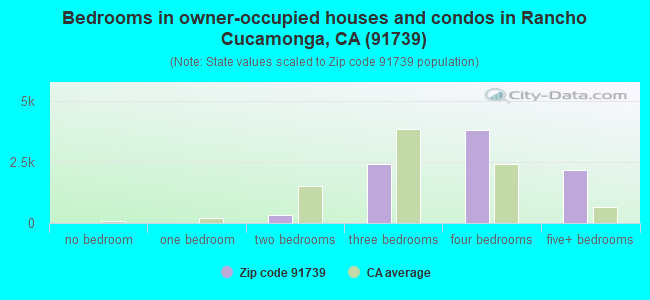
Median number of rooms in houses and condos:
Here:
7.4
State:
6.0
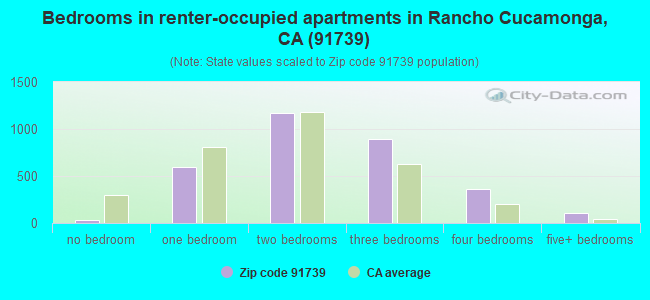
Median number of rooms in apartments:
Here:
4.3
State:
3.9
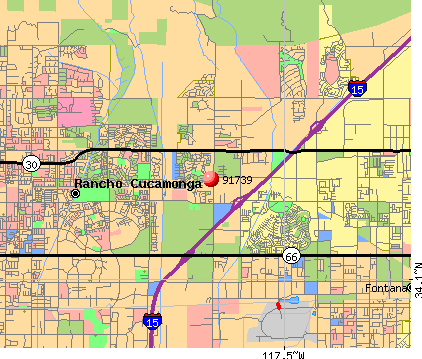
Notable locations in this zip code not listed on our city pages
Notable locations in zip code 91739: Day Canyon Station (A), San Sevaine Lookout (B), San Sevaine Cow Camp (C), Etiwanda (D), United States Forest Service San Bernardino National Forest Station 37 Etiwanda (E), Rancho Cucamonga Fire Protection District Station 176 (F), Rancho Cucamonga Fire Protection District Station 173 (G). Display/hide their locations on the map
Shopping Centers: Victoria Gardens Shopping Center (1), Terra Vista Promenade Shopping Center (2), Foothill Marketplace Shopping Center (3). Display/hide their locations on the map
Parks in zip code 91739 include: Joe Elliot Tree Memorial (1), North East Community Park (2), Windrows Park (3), Chaffey-Garcia House Historic Site (4), Victoria Lakes Park (5). Display/hide their locations on the map
7,250 married couples with children.
1,365 single-parent households (584 men, 781 women).
62.0% of residents of 91739 zip code speak English at home.
18.3% of residents speak Spanish at home (83% very well, 11% well, 5% not well, 1% not at all).
4.4% of residents speak other Indo-European language at home (79% very well, 14% well, 6% not well, 1% not at all).
11.6% of residents speak Asian or Pacific Island language at home (56% very well, 23% well, 13% not well, 7% not at all).
3.6% of residents speak other language at home (70% very well, 7% well, 23% not well).
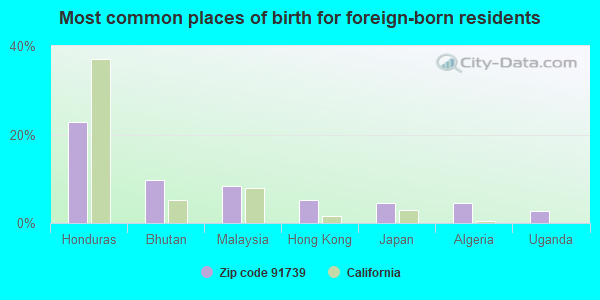
Foreign born population: 9,090 (22.2%) (67.1% of them are naturalized citizens)
This zip code:
22.2%
Whole state:
26.7%
23%Honduras
10%Bhutan
8%Malaysia
5%Hong Kong
5%Japan
5%Algeria
3%Uganda
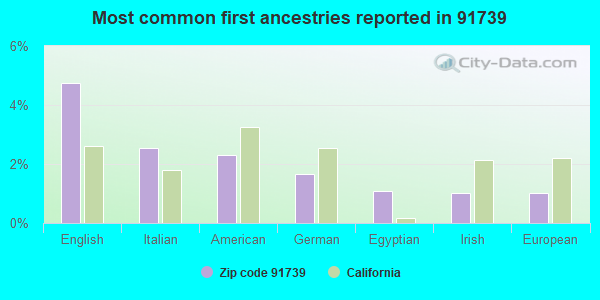
5%English
3%Italian
2%American
2%German
1%Egyptian
1%Irish
1%European
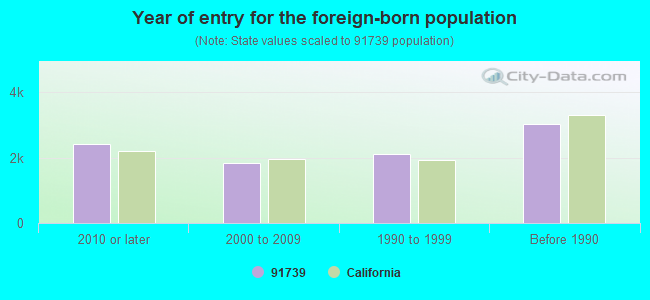
Year of entry for the foreign-born population
2,4052010 or later
1,8352000 to 2009
2,1201990 to 1999
3,013Before 1990
Public high school in in zip code 91739 not listed on the city page:
ETIWANDA HIGH(Students: 2,341, Location: 13500 VICTORIA AVE., Grades: 9-12)
Public elementary/middle schools in in zip code 91739 not listed on the city page:
Major facilities with environmental interests located in this zip code:
AMERON INTERNATIONAL CONCRETE STEEL PIPE GROUP SOUTHERN CALFORNIA DIVISION (12455 ARROW ROUTE in ETIWANDA, CA)
STATE MASTER (California - Hazardous Waste Tracking) - HAZARDOU WASTE PROGRAM CRITERIA AND HAZARDOUS AIR POLLUTANT INVENTORY (Inventory of air pollution sources) Small Quantity Generators, between 100 kg and 1000 kg of hazardous waste/month (Resource Conservation and Recovery Act (tracking hazardous waste)) TRI REPORTER (Tracking of toxic chemicals releasing facilities) Business SIC classification: CONCRETE PRODUCTS, EXCEPT BLOCK AND BRICK Alternative names: AMERON INTL., AMERON INTERNATIONAL CONCRETE STEEL PIPE GROUP SO DIVISION, AMERON SO CA DIV
CHEVRON STATION NO 201595 (12659 FOOTHILL BLVD in RANCHO CUCAMONGA, CA)
STATE MASTER (California - Hazardous Waste Tracking) - HAZARDOU WASTE PROGRAM Small Quantity Generators, between 100 kg and 1000 kg of hazardous waste/month (Resource Conservation and Recovery Act (tracking hazardous waste)) - notification Organizations: CHEVRON PRODUCTS CO (CONTACT/OWNER)
CHEVRON STATION NO 99956 (12576 BASELINE RD in ETIWANDA, CA)
STATE MASTER (California - Hazardous Waste Tracking) - HAZARDOU WASTE PROGRAM Small Quantity Generators, between 100 kg and 1000 kg of hazardous waste/month (Resource Conservation and Recovery Act (tracking hazardous waste)) - notification Organizations: CHEVRON PRODUCTS CO (CONTACT/OWNER)
ETIWANDA HIGH (13500 VICTORIA ST. in ETIWANDA, CA)
(National Center for Education Statistics) - STATE ID-3630373 Organizations: CHAFFEY JOINT UNION HIGH (SCHOOL DISTRICT)
ETIWANDA INTERMEDIATE (6925 ETIWANDA AVE. in ETIWANDA, CA)
(National Center for Education Statistics) - STATE ID-6035778 Organizations: ETIWANDA ELEMENTARY (SCHOOL DISTRICT)
GRAPELAND ELEMENTARY SCHOOL (7171 ETIWANDA AVE. in ETIWANDA, CA)
(National Center for Education Statistics) - STATE ID-6119622 Organizations: ETIWANDA ELEMENTARY (SCHOOL DISTRICT)
JOHN L. GOLDEN ELEMENTARY (12400 BANYAN in ETIWANDA, CA)
(National Center for Education Statistics) - STATE ID-6118467 Organizations: ETIWANDA ELEMENTARY (SCHOOL DISTRICT)
CARYN ELEMENTARY (6290 SIERRA CREST LOOP in ETIWANDA, CA)
(National Center for Education Statistics) - STATE ID-6107569 Organizations: ETIWANDA ELEMENTARY (SCHOOL DISTRICT)
AMERON STEEL WIRE DIV (12459 ARROW HWY A in ETIWANDA, CA)
HAZARDOUS WASTE BIENNIAL REPORTER (Resource Conservation and Recovery Act (tracking hazardous waste)) Large Quantity Generators, more that 1000 kg of hazardous waste/month (Resource Conservation and Recovery Act (tracking hazardous waste)) TRI REPORTER (Tracking of toxic chemicals releasing facilities) Business SIC classification: STEEL WIREDRAWING AND STEEL NAILS AND SPIKES Business NAICS classification: OTHER COMMERCIAL PRINTING.; IRON AND STEEL MILLS.; OTHER FABRICATED WIRE PRODUCT MANUFACTURING. Organizations: TREEISLAND WIRE USA INC (CONTACT/OPERATOR)
Alternative names: I W P A D INCORPORATED
CHAPARRAL TRUCKING (8729 ETIWANDA in ETIWANDA, CA)
(Resource Conservation and Recovery Act (tracking hazardous waste)) Organizations: CHAPARRAL TRUCKING CO (CONTACT/OWNER)
CHEVRON 301784 (8075 MONET AVE in RANCHO CUCAMONGA, CA)
Large Quantity Generators, more that 1000 kg of hazardous waste/month (Resource Conservation and Recovery Act (tracking hazardous waste)) Organizations: CHEVRON USA INC (CONTACT/OPERATOR)
FREEWAY TRUCK PARTS (8613 ETIWANDA AVE in ETIWANDA, CA)
Small Quantity Generators, between 100 kg and 1000 kg of hazardous waste/month (Resource Conservation and Recovery Act (tracking hazardous waste)) - notification Organizations: BUD CO (CONTACT/OWNER)
MARKET PLACE CLEANERS (12859 FOOTHILL BLVD STE B in RANCHO CUCAMONGA, CA)
Small Quantity Generators, between 100 kg and 1000 kg of hazardous waste/month (Resource Conservation and Recovery Act (tracking hazardous waste)) - notification Organizations: NABIL SAAD (CONTACT/OWNER)
Housing units lacking complete plumbing facilities: 0.0% Housing units lacking complete kitchen facilities: 1.4%
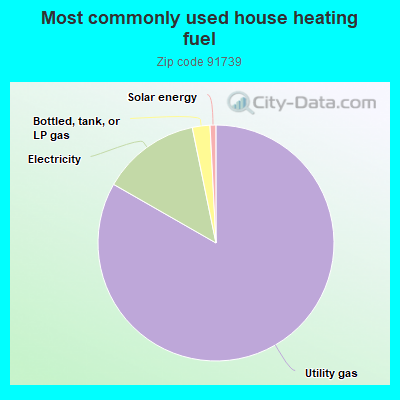
82.7%Utility gas
13.4%Electricity
2.4%Bottled, tank, or LP gas
0.8%Solar energy
Population in 1990: 13,553.
Place of birth for U.S.-born residents:
This state: 25,955
Northeast: 1,130
Midwest: 1,612
South: 2,059
West: 891
44% of the 91739 zip code residents lived in the same house 5 years ago. Out of people who lived in different houses, 69% lived in this county. Out of people who lived in different counties, 50% lived in California.
88% of the 91739 zip code residents lived in the same house 1 year ago. Out of people who lived in different houses, 45% moved from this county. Out of people who lived in different houses, 37% moved from different county within same state. Out of people who lived in different houses, 17% moved from different state. Out of people who lived in different houses, 1% moved from abroad.
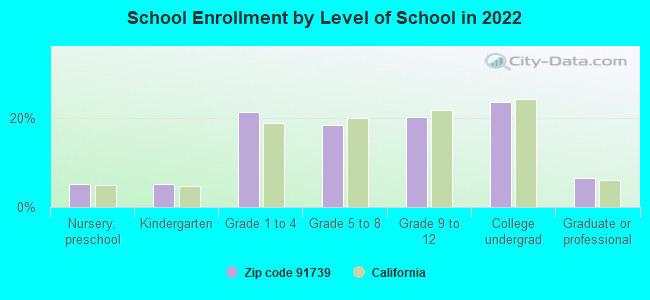
Private vs. public school enrollment:
Students in private schools in grades 1 to 8 (elementary and middle school): 523
Here:
11.3%
California:
10.5%
Students in private schools in grades 9 to 12 (high school): 127
Here:
5.4%
California:
8.5%
Students in private undergraduate colleges: 361
Here:
13.1%
California:
15.9%
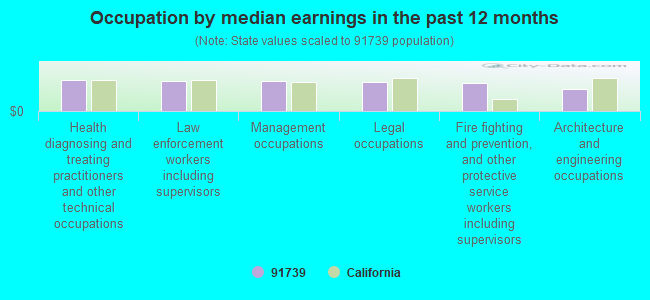
Occupation by median earnings in the past 12 months ($)
118,847Health diagnosing and treating practitioners and other technical occupations
114,449Law enforcement workers including supervisors
114,344Management occupations
111,100Legal occupations
106,143Fire fighting and prevention, and other protective service workers including supervisors
83,660Architecture and engineering occupations
Companies with federal contracts located in this zip code:
OFFICE & ERGONOMIC SOLUTIONS, (12223 HIGHLAND AVE #254 in RANCHO CUCAMON, CA; small business)
$7,808 with Army for Miscellaneous Furniture and Fixtures. Signed on 2005-08-22. Completion date: 2005-09-02.
Top industries in this zip code by the number of employees in 2005:
2005 - 2018 National Fire Incident Reporting System (NFIRS) incidents
Based on the data from the years 2005 - 2018 the average number of fire incidents per year is 44. The highest number of reported fires - 82 took place in 2009, and the least - 1 in 2012. The data has a rising trend.
When looking into fire subcategories, the most reports belonged to: Outside Fires (45.4%), and Structure Fires (26.0%).
Fire incident types reported to NFIRS in Zip Code 91739
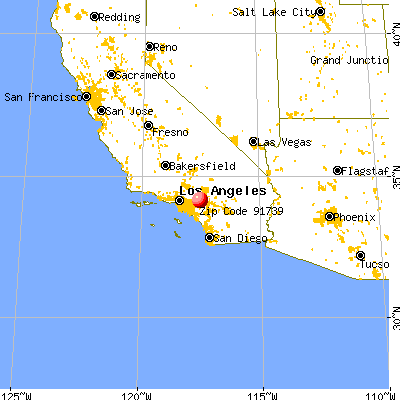


 Nearest zip codes: 91737, 92336, 91701, 92358, 91730, 92335.
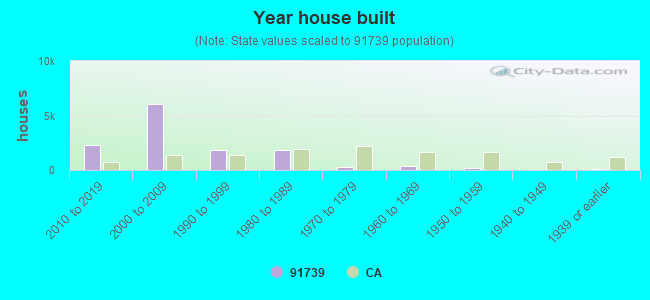


 (Students: 2,341, Location: 13500 VICTORIA AVE., Grades: 9-12)


 Based on the data from the years 2005 - 2018 the average number of fire incidents per year is 44. The highest number of reported fires - 82 took place in 2009, and the least - 1 in 2012. The data has a rising trend.
 When looking into fire subcategories, the most reports belonged to: Outside Fires (45.4%), and Structure Fires (26.0%).