Estimated zip code population in 2022: 99,735 Zip code population in 2010: 88,419 Zip code population in 2000: 54,585
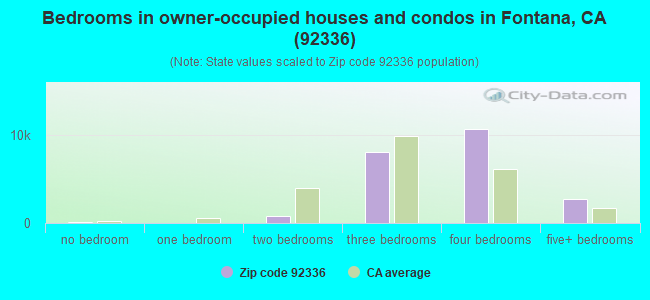
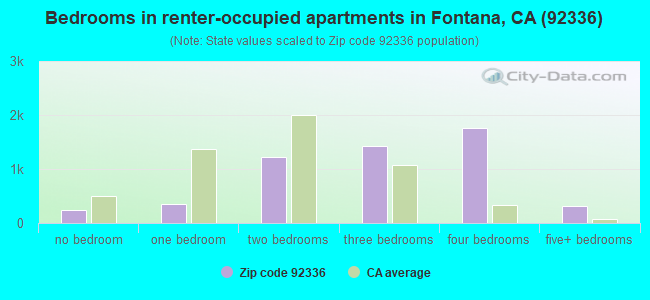
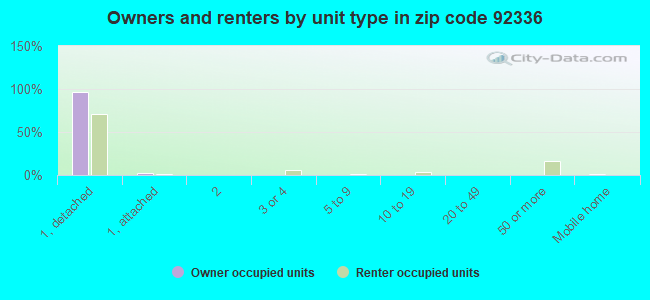
Houses and condos: 27,769 Renter-occupied apartments: 5,331
% of renters here:
19%
State:
44%
March 2022 cost of living index in zip code 92336: 82.1 (low, U.S. average is 100)
Land area: 24.9 sq. mi. Water area: 0.1 sq. mi.
Population density: 4,011 people per square mile
(average).
OSM Map
General Map
Google Map
MSN Map
OSM Map
General Map
Google Map
MSN Map
OSM Map
General Map
Google Map
MSN Map
OSM Map
General Map
Google Map
MSN Map
Please wait while loading the map...
Real estate property taxes paid for housing units in 2022:
This zip code:
0.9% ($5,671)
California:
0.7% ($4,831)
Median real estate property taxes paid for housing units with mortgages in 2022: $5,971 (0.9%) Median real estate property taxes paid for housing units with no mortgage in 2022: $3,943 (0.7%)
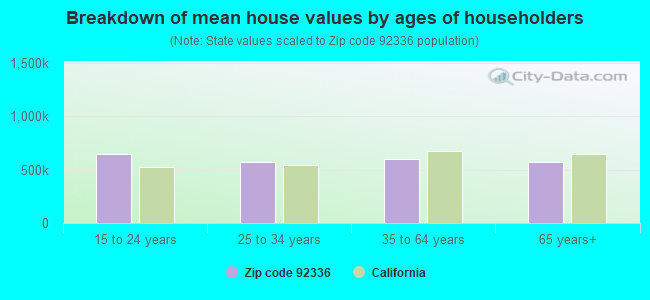
Estimated median house/condo value in 2022: $624,146
92336:
$624,146
California:
$715,900
According to our research of California and other state lists, there were 86 registered sex offenders living in 92336 zip code as of May 03, 2024. The ratio of all residents to sex offenders in zip code 92336 is 1,089 to 1. The ratio of registered sex offenders to all residents in this zip code is lower than the state average.
Median resident age:
This zip code:
35.0 years
California median age:
37.9 years
Average household size:
This zip code:
3.6 people
California:
2.8 people
Averages for the 2020 tax year for zip code 92336, filed in 2021:
Average Adjusted Gross Income (AGI) in 2020: $63,945 (Individual Income Tax Returns)
Here:
$63,945
State:
$95,910
Salary/wage: $60,938 (reported on 86.8% of returns)
Here:
$60,938
State:
$77,331
(% of AGI for various income ranges: 1182.9% for AGIs below $25k, 3846.6% for AGIs $25k-50k, 7553.2% for AGIs $50k-75k, 11287.1% for AGIs $75k-100k, 21960.4% for AGIs $100k-200k, 66670.2% for AGIs over 200k)
Taxable interest for individuals: $340 (reported on 32.2% of returns)
This zip code:
$340
California:
$2,294
(% of AGI for various income ranges: 5.3% for AGIs below $25k, 7.1% for AGIs $25k-50k, 11.3% for AGIs $50k-75k, 20.9% for AGIs $75k-100k, 34.5% for AGIs $100k-200k, 244.7% for AGIs over 200k)
Ordinary dividends: $1,253 (reported on 7.9% of returns)
Here:
$1,253
State:
$10,949
(% of AGI for various income ranges: 3.2% for AGIs below $25k, 6.3% for AGIs $25k-50k, 11.2% for AGIs $50k-75k, 14.8% for AGIs $75k-100k, 35.5% for AGIs $100k-200k, 236.0% for AGIs over 200k)
Net capital gain/loss in AGI: +$8,638 (reported on 9.7% of returns)
Here:
+$8,638
State:
+$49,306
(% of AGI for various income ranges: 1.8% for AGIs below $25k, 10.4% for AGIs $25k-50k, 20.1% for AGIs $50k-75k, 62.7% for AGIs $75k-100k, 231.9% for AGIs $100k-200k, 4838.2% for AGIs over 200k)
Profit/loss from business: +$8,422 (reported on 18.6% of returns)
Here:
+$8,422
State:
+$15,671
(% of AGI for various income ranges: 167.3% for AGIs below $25k, 208.7% for AGIs $25k-50k, 234.9% for AGIs $50k-75k, 255.3% for AGIs $75k-100k, 230.8% for AGIs $100k-200k, 1662.9% for AGIs over 200k)
Taxable individual retirement arrangement distribution: $17,697 (reported on 2.9% of returns)
92336:
$17,697
California:
$23,505
(% of AGI for various income ranges: 16.0% for AGIs below $25k, 27.5% for AGIs $25k-50k, 53.4% for AGIs $50k-75k, 130.8% for AGIs $75k-100k, 221.1% for AGIs $100k-200k, 626.7% for AGIs over 200k)
Self-employed (Keogh) retirement plans: $21,775 (reported on 0.2% of returns)
92336:
$21,775
California:
$30,163
(% of AGI for various income ranges: 12.1% for AGIs $100k-200k, 210.2% for AGIs over 200k)
Total itemized deductions: $30,502 (reported on 19.6% of returns)
Here:
$30,502
State:
$39,517
(% of AGI for various income ranges: 58.4% for AGIs below $25k, 226.1% for AGIs $25k-50k, 811.3% for AGIs $50k-75k, 1559.4% for AGIs $75k-100k, 2881.0% for AGIs $100k-200k, 7913.1% for AGIs over 200k)
Charity contributions: $6,078 (reported on 17.0% of returns)
Here:
$6,078
State:
$12,598
(% of AGI for various income ranges: 4.1% for AGIs below $25k, 28.0% for AGIs $25k-50k, 117.2% for AGIs $50k-75k, 227.9% for AGIs $75k-100k, 532.6% for AGIs $100k-200k, 1825.8% for AGIs over 200k)
Taxes paid: $9,064 (reported on 19.6% of returns)
92336:
$9,064
State:
$8,807
(% of AGI for various income ranges: 15.8% for AGIs below $25k, 62.9% for AGIs $25k-50k, 243.4% for AGIs $50k-75k, 486.2% for AGIs $75k-100k, 890.9% for AGIs $100k-200k, 1961.8% for AGIs over 200k)
Earned income credit: $2,108 (reported on 15.9% of returns)
Here:
$2,108
State:
$2,074
(% of AGI for various income ranges: 86.2% for AGIs below $25k, 75.2% for AGIs $25k-50k, 1.5% for AGIs $50k-75k)
Percentage of individuals using paid preparers for their 2020 taxes: 93.1%
Here:
93%
State:
92%
(% for various income ranges: 92.5% for AGIs below $25k, 93.3% for AGIs $25k-50k, 92.7% for AGIs $50k-75k, 93.3% for AGIs $75k-100k, 93.7% for AGIs $100k-200k, 94.8% for AGIs over 200k)
Averages for the 2012 tax year for zip code 92336, filed in 2013:
Average Adjusted Gross Income (AGI) in 2012: $51,814 (Individual Income Tax Returns)
Here:
$51,814
State:
$72,726
Salary/wage: $50,711 (reported on 89.3% of returns)
Here:
$50,711
State:
$59,079
(% of AGI for various income ranges: 77.8% for AGIs below $25k, 87.1% for AGIs $25k-50k, 88.4% for AGIs $50k-75k, 90.2% for AGIs $75k-100k, 90.4% for AGIs $100k-200k, 73.0% for AGIs over 200k)
Taxable interest for individuals: $287 (reported on 31.9% of returns)
This zip code:
$287
California:
$2,146
(% of AGI for various income ranges: 0.3% for AGIs below $25k, 0.1% for AGIs $25k-50k, 0.2% for AGIs $50k-75k, 0.1% for AGIs $75k-100k, 0.2% for AGIs $100k-200k, 0.3% for AGIs over 200k)
Ordinary dividends: $1,056 (reported on 6.3% of returns)
Here:
$1,056
State:
$9,308
(% of AGI for various income ranges: 0.1% for AGIs below $25k, 0.1% for AGIs $25k-50k, 0.1% for AGIs $50k-75k, 0.1% for AGIs $75k-100k, 0.1% for AGIs $100k-200k, 0.2% for AGIs over 200k)
Net capital gain/loss in AGI: +$1,239 (reported on 5.8% of returns)
Here:
+$1,239
State:
+$30,460
(% of AGI for various income ranges: 0.2% for AGIs $100k-200k, 2.0% for AGIs over 200k)
Profit/loss from business: +$9,042 (reported on 17.4% of returns)
Here:
+$9,042
State:
+$17,064
(% of AGI for various income ranges: 13.0% for AGIs below $25k, 5.0% for AGIs $25k-50k, 1.8% for AGIs $50k-75k, 1.2% for AGIs $75k-100k, 1.0% for AGIs $100k-200k, 3.1% for AGIs over 200k)
Taxable individual retirement arrangement distribution: $14,266 (reported on 3.1% of returns)
92336:
$14,266
California:
$19,557
(% of AGI for various income ranges: 0.8% for AGIs below $25k, 0.6% for AGIs $25k-50k, 1.0% for AGIs $50k-75k, 0.7% for AGIs $75k-100k, 0.9% for AGIs $100k-200k, 1.9% for AGIs over 200k)
Self-employment retirement plans: $19,380 (reported on 0.1% of returns)
92336:
$19,380
California:
$24,530
Total itemized deductions: $25,804 (31% of AGI, reported on 44.3% of returns)
Here:
$25,804
State:
$34,004
Here:
30.6% of AGI
State:
22.7% of AGI
(% of AGI for various income ranges: 9.9% for AGIs below $25k, 18.1% for AGIs $25k-50k, 24.8% for AGIs $50k-75k, 25.8% for AGIs $75k-100k, 24.1% for AGIs $100k-200k, 19.8% for AGIs over 200k)
Charity contributions: $2,936 (reported on 37.3% of returns)
Here:
$2,936
State:
$4,659
(% of AGI for various income ranges: 0.6% for AGIs below $25k, 1.6% for AGIs $25k-50k, 2.3% for AGIs $50k-75k, 2.5% for AGIs $75k-100k, 2.5% for AGIs $100k-200k, 2.0% for AGIs over 200k)
Taxes paid: $8,044 (reported on 44.2% of returns)
92336:
$8,044
State:
$14,448
(% of AGI for various income ranges: 2.7% for AGIs below $25k, 4.4% for AGIs $25k-50k, 6.9% for AGIs $50k-75k, 7.9% for AGIs $75k-100k, 8.3% for AGIs $100k-200k, 8.3% for AGIs over 200k)
Earned income credit: $2,454 (reported on 22.4% of returns)
Here:
$2,454
State:
$2,286
(% of AGI for various income ranges: 8.6% for AGIs below $25k, 1.7% for AGIs $25k-50k)
Percentage of individuals using paid preparers for their 2012 taxes: 69.4%
Here:
69%
State:
64%
(% for various income ranges: 65.3% for AGIs below $25k, 71.3% for AGIs $25k-50k, 73.2% for AGIs $50k-75k, 71.9% for AGIs $75k-100k, 71.6% for AGIs $100k-200k, 72.2% for AGIs over 200k)
Averages for the 2004 tax year for zip code 92336, filed in 2005:
Average Adjusted Gross Income (AGI) in 2004: $45,848 (Individual Income Tax Returns)
Here:
$45,848
State:
$58,600
Salary/wage: $44,548 (reported on 91.7% of returns)
Here:
$44,548
State:
$49,455
(% of AGI for various income ranges: 109.7% for AGIs below $10k, 83.6% for AGIs $10k-25k, 90.0% for AGIs $25k-50k, 92.5% for AGIs $50k-75k, 92.7% for AGIs $75k-100k, 83.0% for AGIs over 100k)
Taxable interest for individuals: $344 (reported on 40.1% of returns)
This zip code:
$344
California:
$2,365
(% of AGI for various income ranges: 1.3% for AGIs below $10k, 0.5% for AGIs $10k-25k, 0.2% for AGIs $25k-50k, 0.3% for AGIs $50k-75k, 0.3% for AGIs $75k-100k, 0.3% for AGIs over 100k)
Taxable dividends: $590 (reported on 8.4% of returns)
Here:
$590
State:
$4,746
(% of AGI for various income ranges: 0.4% for AGIs below $10k, 0.1% for AGIs $10k-25k, 0.1% for AGIs $25k-50k, 0.1% for AGIs $50k-75k, 0.1% for AGIs $75k-100k, 0.1% for AGIs over 100k)
Net capital gain/loss: +$12,270 (reported on 7.2% of returns)
Here:
+$12,270
State:
+$23,418
(% of AGI for various income ranges: -0.2% for AGIs below $10k, 0.2% for AGIs $10k-25k, 0.2% for AGIs $25k-50k, 0.4% for AGIs $50k-75k, 0.5% for AGIs $75k-100k, 6.4% for AGIs over 100k)
Profit/loss from business: +$8,672 (reported on 17.1% of returns)
Here:
+$8,672
State:
+$16,826
(% of AGI for various income ranges: 9.0% for AGIs below $10k, 10.3% for AGIs $10k-25k, 4.6% for AGIs $25k-50k, 1.9% for AGIs $50k-75k, 1.7% for AGIs $75k-100k, 2.0% for AGIs over 100k)
IRA payment deduction: $2,786 (reported on 1.6% of returns)
92336:
$2,786
California:
$3,192
(% of AGI for various income ranges: 0.2% for AGIs below $10k, 0.1% for AGIs $10k-25k, 0.1% for AGIs $25k-50k, 0.1% for AGIs $50k-75k, 0.1% for AGIs $75k-100k, 0.1% for AGIs over 100k)
Self-employed pension: $13,085 (reported on 0.3% of returns)
Here:
$13,085
California:
$17,688
(% of AGI for various income ranges: 0.0% for AGIs $25k-50k, 0.0% for AGIs $50k-75k, 0.0% for AGIs $75k-100k, 0.2% for AGIs over 100k)
Total itemized deductions: $24,805 (36% of AGI, reported on 53.2% of returns)
Here:
$24,805
State:
$28,113
Here:
36.2% of AGI
State:
25.3% of AGI
(% of AGI for various income ranges: 17.0% for AGIs below $10k, 16.1% for AGIs $10k-25k, 29.6% for AGIs $25k-50k, 33.6% for AGIs $50k-75k, 31.4% for AGIs $75k-100k, 26.6% for AGIs over 100k)
Charity contributions deductions: $2,756 (4% of AGI, reported on 47.3% of returns)
Here:
$2,756
State:
$3,923
Here:
3.9% of AGI
State:
3.3% of AGI
(% of AGI for various income ranges: 0.5% for AGIs below $10k, 1.0% for AGIs $10k-25k, 2.6% for AGIs $25k-50k, 3.1% for AGIs $50k-75k, 3.2% for AGIs $75k-100k, 3.2% for AGIs over 100k)
Total tax: $4,644 (reported on 70.2% of returns)
92336:
$4,644
State:
$10,761
(% of AGI for various income ranges: 3.8% for AGIs below $10k, 3.9% for AGIs $10k-25k, 4.3% for AGIs $25k-50k, 5.4% for AGIs $50k-75k, 6.9% for AGIs $75k-100k, 12.2% for AGIs over 100k)
Earned income credit: $1,899 (reported on 19.1% of returns)
Here:
$1,899
State:
$1,763
Percentage of individuals using paid preparers for their 2004 taxes: 73.4%
Here:
73%
State:
66%
(% for various income ranges: 63.7% for AGIs below $10k, 74.3% for AGIs $10k-25k, 76.8% for AGIs $25k-50k, 75.4% for AGIs $50k-75k, 72.9% for AGIs $75k-100k, 74.4% for AGIs over 100k)
Likely homosexual households (counted as self-reported same-sex unmarried-partner households)
Lesbian couples: 0.4% of all households
Gay men: 0.1% of all households
Household received Food Stamps/SNAP in the past 12 months: 3,494 Household did not receive Food Stamps/SNAP in the past 12 months: 24,090
Women who had a birth in the past 12 months: 1,606 (1,046 now married, 561 unmarried) Women who did not have a birth in the past 12 months: 24,885 (10,649 now married, 14,203 unmarried)
Housing units in zip code 92336 with a mortgage: 18,188 (1,063 second mortgage, 47 home equity loan, 829 both second mortgage and home equity loan) Houses without a mortgage: 154
Median monthly owner costs for units with a mortgage: $2,610 Median monthly owner costs for units without a mortgage: $763
Residents with income below the poverty level in 2022:
This zip code:
7.5%
Whole state:
12.2%
Residents with income below 50% of the poverty level in 2022:
This zip code:
4.5%
Whole state:
6.2%
Median number of rooms in houses and condos:
Here:
6.4
State:
6.0
Median number of rooms in apartments:
Here:
5.5
State:
3.9
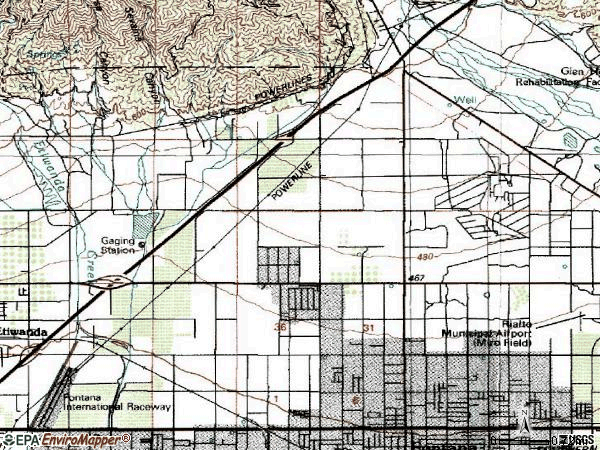
Notable locations in this zip code not listed on our city pages
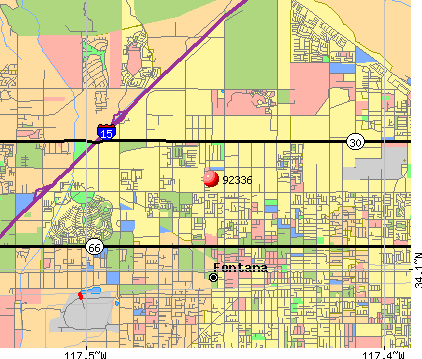
Notable locations in zip code 92336: Six-M Egg Ranch (A), San Bernardino County Fire Department Station 79 Fontana (B), San Bernardino County Fire Department Station 78 (C), Jessie Turner Community Center (D). Display/hide their locations on the map
Churches in zip code 92336 include: North Fontana Community Baptist Church (A), Bethel African Methodist Episcopal Church (B), Juniper Avenue Seventh Day Adventist Church (C), Resurrection Catholic Church (D). Display/hide their locations on the map
17,265 married couples with children.
5,244 single-parent households (1,161 men, 4,083 women).
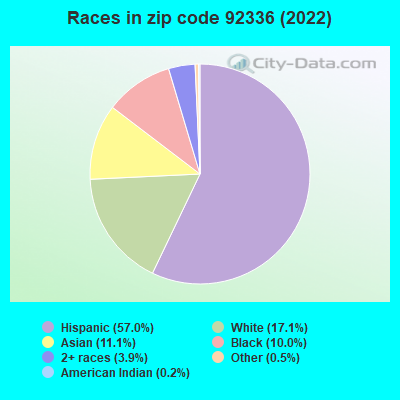
52.8% of residents of 92336 zip code speak English at home.
35.0% of residents speak Spanish at home (73% very well, 11% well, 11% not well, 5% not at all).
1.7% of residents speak other Indo-European language at home (78% very well, 16% well, 5% not well, 1% not at all).
8.0% of residents speak Asian or Pacific Island language at home (63% very well, 21% well, 13% not well, 4% not at all).
2.1% of residents speak other language at home (76% very well, 17% well, 5% not well, 2% not at all).
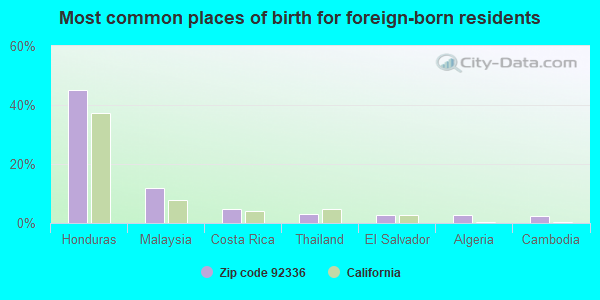
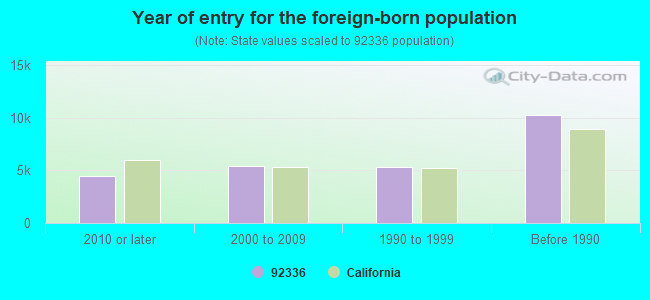
Foreign born population: 24,418 (24.5%) (63.4% of them are naturalized citizens)
Major facilities with environmental interests located in this zip code:
FONTANA REFUSE DISPOSAL SITE MID VALLEY LANDFILL (SIERRA AVENUE & HIGHLAND AVENUE in FONTANA, CA)
SUPERFUND (Superfund database) STATE MASTER (California - Hazardous Waste Tracking) - HAZARDOU WASTE PROGRAM Small Quantity Generators, between 100 kg and 1000 kg of hazardous waste/month (Resource Conservation and Recovery Act (tracking hazardous waste)) - notification (Resource Conservation and Recovery Act (tracking hazardous waste)) REFUSE DISPOSAL (Solid waste facilities tracking) Organizations: CO OF SAN BERNARDINO SOLID WASTE MGT DIV (CONTACT/OPERATOR)
, CO OF SAN BERNARDINO SOLID WASTE MGT DIV (CONTACT/OWNER)
, SAN BERNARDINO CNTY (CONTACT/OWNER)
Alternative names: CNTY SAN BERNARDINO/MID VALLEY LANDFILL, FONTANA REFUSE DISPOSAL SITE(MID-VALLEY), FONTANA SAN LDFL, MID-VALLEY SANITARY LANDFILL, MID-VALLEY SANITARY LANDFILL NORTHEAST EXPANSION AREA
CHEVRON STATION NO 209515 (14526 BASELINE RD in FONTANA, CA)
STATE MASTER (California - Hazardous Waste Tracking) - HAZARDOU WASTE PROGRAM Small Quantity Generators, between 100 kg and 1000 kg of hazardous waste/month (Resource Conservation and Recovery Act (tracking hazardous waste)) - notification Organizations: CHEVRON PRODUCTS CO (CONTACT/OWNER)
EAST HERITAGE ELEMENTARY (14250 E. CONSTITUTION WAY in FONTANA, CA)
(National Center for Education Statistics) - STATE ID-6112130 Organizations: ETIWANDA ELEMENTARY (SCHOOL DISTRICT)
HEMLOCK ELEMENTARY (15080 MILLER AVE. in FONTANA, CA)
(National Center for Education Statistics) - STATE ID-6111173 Organizations: FONTANA UNIFIED (SCHOOL DISTRICT)
HERITAGE INTEMEDIATE SCHOOL (13766 SOUTH HERITAGE CIRCLE in FONTANA, CA)
(National Center for Education Statistics) - STATE ID-6119630 Organizations: ETIWANDA ELEMENTARY (SCHOOL DISTRICT)
JUNIPER ELEMENTARY (7655 JUNIPER AVE. in FONTANA, CA)
(National Center for Education Statistics) - STATE ID-6035794 Organizations: FONTANA UNIFIED (SCHOOL DISTRICT)
MANGO ELEMENTARY (7450 MANGO AVE. in FONTANA, CA)
(National Center for Education Statistics) - STATE ID-6110688 Organizations: FONTANA UNIFIED (SCHOOL DISTRICT)
NORTH TAMARIND ELEMENTARY (7961 TAMARIND AVE. in FONTANA, CA)
(National Center for Education Statistics) - STATE ID-6035836 Organizations: FONTANA UNIFIED (SCHOOL DISTRICT)
CECILIA L. SOLORIO ELEMENTARY (15172 WALNUT ST. in FONTANA, CA)
(National Center for Education Statistics) - STATE ID-6117519 Organizations: ETIWANDA ELEMENTARY (SCHOOL DISTRICT)
FONTANA NISSAN (17050 FOOTHILL BLVD in FONTANA, CA)
Small Quantity Generators, between 100 kg and 1000 kg of hazardous waste/month (Resource Conservation and Recovery Act (tracking hazardous waste)) - notification Organizations: JOE PERRI (CONTACT/OWNER)
CESAR LIRA TRUCKING (16477 EL REVINO DR in FONTANA, CA)
TRANSPORTER (Resource Conservation and Recovery Act (tracking hazardous waste))
CHEVRON 211869 (15160 SUMMIT AVE in FONTANA, CA)
Small Quantity Generators, between 100 kg and 1000 kg of hazardous waste/month (Resource Conservation and Recovery Act (tracking hazardous waste)) Organizations: CHEVRON PRODUCTS CO. (CONTACT/OPERATOR)
F S A REBUILDER (14570 MEYER CYN DR in FONTANA, CA)
Small Quantity Generators, between 100 kg and 1000 kg of hazardous waste/month (Resource Conservation and Recovery Act (tracking hazardous waste)) - notification Organizations: BRENCO INCORPORATED (CONTACT/OWNER)
Housing units lacking complete plumbing facilities: 0.3% Housing units lacking complete kitchen facilities: 0.5%
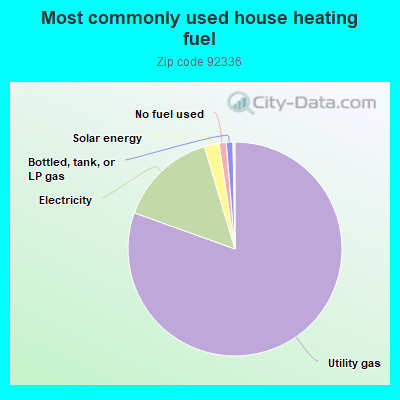
80.5%Utility gas
14.9%Electricity
2.2%Solar energy
1.1%No fuel used
1.0%Bottled, tank, or LP gas
Population in 1990: 27,957. Population change in the 1990s: +26,628 (+95.2%).
Place of birth for U.S.-born residents:
This state: 66,208
Northeast: 1,027
Midwest: 2,518
South: 2,611
West: 1,823
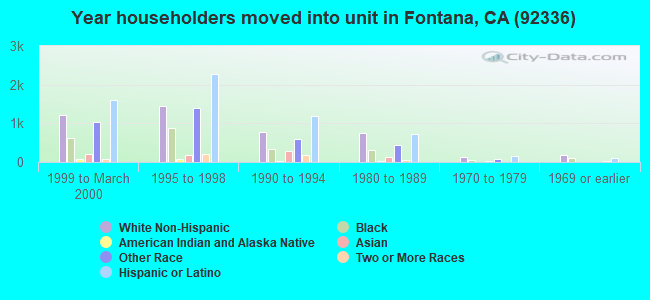
45% of the 92336 zip code residents lived in the same house 5 years ago. Out of people who lived in different houses, 57% lived in this county. Out of people who lived in different counties, 50% lived in California.
91% of the 92336 zip code residents lived in the same house 1 year ago. Out of people who lived in different houses, 57% moved from this county. Out of people who lived in different houses, 29% moved from different county within same state. Out of people who lived in different houses, 3% moved from different state. Out of people who lived in different houses, 12% moved from abroad.
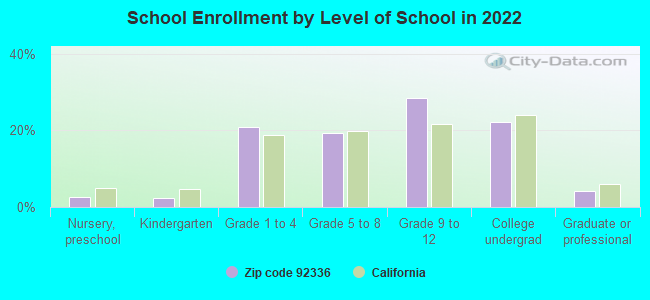
Private vs. public school enrollment:
Students in private schools in grades 1 to 8 (elementary and middle school): 729
Here:
6.1%
California:
10.5%
Students in private schools in grades 9 to 12 (high school): 586
Here:
6.9%
California:
8.5%
Students in private undergraduate colleges: 1,181
Here:
17.6%
California:
15.9%
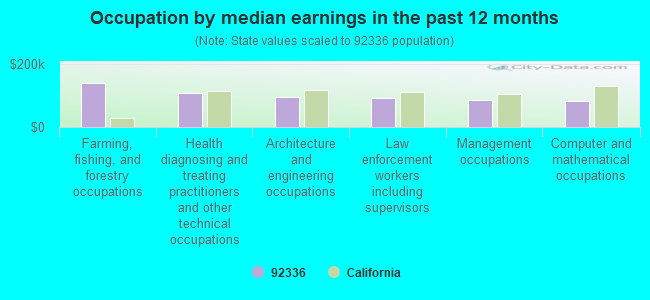
Occupation by median earnings in the past 12 months ($)
140,227Farming, fishing, and forestry occupations
108,839Health diagnosing and treating practitioners and other technical occupations
96,082Architecture and engineering occupations
92,731Law enforcement workers including supervisors
85,270Management occupations
84,054Computer and mathematical occupations
Companies with federal contracts located in this zip code:
NETKOMP, INC (16113 COPPERHEAD CT in FONTANA, CA; small business) : $3,008,580 in 234 contractsfrom 2003 to 2006
Contracts for Antennas, Waveguides, and Related Equipment, Batteries, Rechargeable, Batteries, Nonrechargeable, Radio Navigation Equipment, Except Airborne, and moreby Defense Logistics Agency, Army Signed by year:2000: $0; 2001: $0; 2002: $0; 2003: $346,559; 2004: $871,524; 2005: $1,484,476; 2006: $306,021.
Biggest contracts:
$97,393 with Defense Logistics Agency for Antennas, Waveguides, and Related Equipment. Signed on 2003-10-15. Completion date: 2003-11-29.
$94,966 with Defense Logistics Agency for Batteries, Rechargeable. Signed on 2004-05-07. Completion date: 2004-08-15.
$93,408 with Defense Logistics Agency for Batteries, Nonrechargeable. Signed on 2004-05-20. Completion date: 2004-10-17.
$89,496, same as above.Signed on 2005-10-28. Completion date: 2006-04-26.
Top industries in this zip code by the number of employees in 2005:
2005 - 2018 National Fire Incident Reporting System (NFIRS) incidents
According to the data from the years 2005 - 2018 the average number of fire incidents per year is 55. The highest number of fires - 107 took place in 2008, and the least - 7 in 2012. The data has a growing trend.
When looking into fire subcategories, the most incidents belonged to: Outside Fires (43.6%), and Structure Fires (28.1%).
Fire incident types reported to NFIRS in Zip Code 92336


 Nearest zip codes: 92377, 92335, 91739, 92376, 92337, 92407.


 According to the data from the years 2005 - 2018 the average number of fire incidents per year is 55. The highest number of fires - 107 took place in 2008, and the least - 7 in 2012. The data has a growing trend.
 When looking into fire subcategories, the most incidents belonged to: Outside Fires (43.6%), and Structure Fires (28.1%).