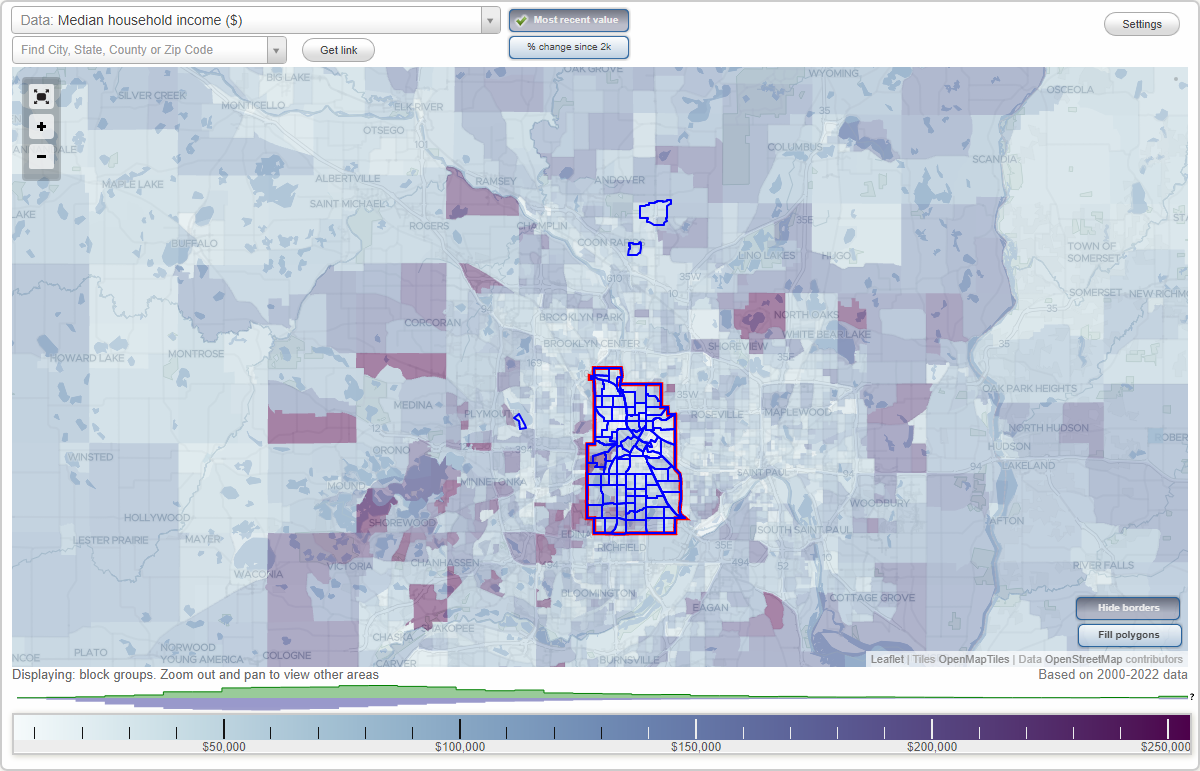
Minneapolis, Minnesota Neighborhood Map - Income, House Prices, Occupations, Boundaries
Settings
X

- City boundary
- Neighborhood boundaries
Business Search - 14 Million verified businesses
Neighborhoods:
Armatage, Audubon Park, Bancroft, Beltrami, Bottineau, Bryant, Bryn-Mawr, Calhoun Isles, Camden, Camden Industrial, Carag, Cedar-Isles, Cedar-Riverside, Central, Cleveland, Columbia, Como, Cooper, Corcoran, Diamond Lake, Downtown East, Downtown West, East Harriet, East Isles, Ecco, Elliot Park, Ericsson, Field, Folwell, Fulton, Greater Central, Greater Longfellow, Greater Near North, Hale, Harrison, Hawthorne, Hiawatha, Holland, Howe, Humboldt Industrial, Johnsville, Jordan, Keewaydin, Kenny, Kenwood, King Field, Lind-Bohanon, Linden Hills, Logan Park, Longfellow, Loring Park, Lowry Hill, Lowry Hill East, Lyndale, Lynnhurst, Marcy-Holmes, Marshall Terrace, Mckinley, Medicine Lake, Mid-City Industrial, Minnehaha, Morris Park, Near North, Nicollet Island, Nokomis, North Loop, Northeast, Northeast Park, Northrup, Oak Park, Page, Phillips, Powderhorn, Powderhorn Park, Prospect Park, Regina, Seward, Sheridan, Shingle Creek, Southwest, St. Anthony East, St. Anthony West, Standish, Stevens Square, Sumner-glenwood, Tangletown, University, University Of Minnesota, Victory, Waite Park, Webber-Camden, Wenonah, West Calhoun, Whittier, Willard-Hay, Windom, Windom ParkArmatage neighborhood in Minneapolis statistics: (Find on map)
Area: 0.742 square miles
Population: 5,516
Population density:
Median household income in 2021:
Median rent in in 2021:
Male vs Females
Median age
Housing prices:
Average estimated value of detached houses in 2021 (87.6% of all units):
Average estimated value of townhouses or other attached units in 2021 (5.7% of all units):
Average estimated value of housing units in 2-unit structures in 2021 (4.9% of all units):
Most popular occupations of males: management occupations (except farmers) (16.6%); business and financial operations occupations (12.2%); life, physical, and social science occupations (10.6%); architecture and engineering occupations (7.5%); arts, design, entertainment, sports, and media occupations (7.2%); computer and mathematical occupations (7.0%); education, training, and library occupations (6.8%)
Most popular occupations of females: sales and office occupations (25.6%); management occupations (except farmers) (18.0%); business and financial operations occupations (10.8%); education, training, and library occupations (10.3%); arts, design, entertainment, sports, and media occupations (9.4%); computer and mathematical occupations (8.7%); healthcare practitioners and technical occupations (5.9%)
Highways in this neighborhood: State Hwy 62 (Crosstown Hwy).
Roads and streets: Oliver Ave S; W 56th St; W 58th St; W 60th St; Upton Ave S; Vincent Ave S; W 55th St; Morgan Ave S; Co Rd 32 (Penn Ave S); Washburn Ave S; W 59th St; W 62nd St; W 57th St; W 61st St; Newton Ave S; Logan Ave S; Sheridan Ave S; Thomas Ave S; Russell Ave S; Queen Ave S; Robbins St; Cumberland Rd; Richmond Curve; Thomas Cir S; Morgan Ct.
Armatage neighborhood detailed profile
Area: 0.742 square miles
Population: 5,516
Population density:
| Armatage: | 7,431 people per square mile |
| Minneapolis: | 7,749 people per square mile |
Median household income in 2021:
| Armatage: | $132,498 |
| Minneapolis: | $69,397 |
Median rent in in 2021:
| Armatage: | $1,406 |
| Minneapolis: | $1,138 |
Male vs Females
| Males: | 2,988 |
| Females: | 2,527 |
Median age
| Males: | 37.5 years |
| Females: | 37.6 years |
Housing prices:
Average estimated value of detached houses in 2021 (87.6% of all units):
| Armatage: | $437,330 |
| Minneapolis: | $398,431 |
Average estimated value of townhouses or other attached units in 2021 (5.7% of all units):
| This neighborhood: | $472,695 |
| city: | $376,360 |
Average estimated value of housing units in 2-unit structures in 2021 (4.9% of all units):
| This neighborhood: | $326,622 |
| Minneapolis: | $353,466 |
Most popular occupations of males: management occupations (except farmers) (16.6%); business and financial operations occupations (12.2%); life, physical, and social science occupations (10.6%); architecture and engineering occupations (7.5%); arts, design, entertainment, sports, and media occupations (7.2%); computer and mathematical occupations (7.0%); education, training, and library occupations (6.8%)
Most popular occupations of females: sales and office occupations (25.6%); management occupations (except farmers) (18.0%); business and financial operations occupations (10.8%); education, training, and library occupations (10.3%); arts, design, entertainment, sports, and media occupations (9.4%); computer and mathematical occupations (8.7%); healthcare practitioners and technical occupations (5.9%)
Highways in this neighborhood: State Hwy 62 (Crosstown Hwy).
Roads and streets: Oliver Ave S; W 56th St; W 58th St; W 60th St; Upton Ave S; Vincent Ave S; W 55th St; Morgan Ave S; Co Rd 32 (Penn Ave S); Washburn Ave S; W 59th St; W 62nd St; W 57th St; W 61st St; Newton Ave S; Logan Ave S; Sheridan Ave S; Thomas Ave S; Russell Ave S; Queen Ave S; Robbins St; Cumberland Rd; Richmond Curve; Thomas Cir S; Morgan Ct.
Armatage neighborhood detailed profile
Audubon Park neighborhood in Minneapolis statistics: (Find on map)
Area: 0.665 square miles
Population: 4,919
Population density:
Median household income in 2021:
Median rent in in 2021:
Male vs Females
Median age
Housing prices:
Average estimated value of detached houses in 2021 (73.5% of all units):
Average estimated value of housing units in 2-unit structures in 2021 (21.6% of all units):
Most popular occupations of males: sales and office occupations (15.8%); computer and mathematical occupations (13.5%); business and financial operations occupations (11.5%); service occupations (10.7%); management occupations (except farmers) (8.3%); arts, design, entertainment, sports, and media occupations (7.9%); construction, extraction, and maintenance occupations (4.3%)
Most popular occupations of females: service occupations (20.1%); sales and office occupations (17.7%); management occupations (except farmers) (17.1%); healthcare practitioners and technical occupations (9.4%); education, training, and library occupations (8.6%); business and financial operations occupations (8.2%); computer and mathematical occupations (4.0%)
Roads and streets: Lowry Ave NE (Co Rd 153); 26th Ave NE; 27th Ave NE; 28th Ave NE; Co Rd 94 (29th Ave NE, Co Rd C); 30th Ave NE; Fillmore St NE; NE Lincoln St; Johnson St NE; NE Pierce St; NE Ulysses St; Hayes St NE; Brighton Ave NE; NE Arthur St; Taylor St NE; Polk St NE; NE Cleveland St; NE Benjamin St (Benjamin St NE); Buchanan St NE; Garfield St; St Anthony Pkwy Svc Rd; NE Tyler St; McKinley St NE; NE Polk St; NE Taylor St; Saint Anthony Pkwy (Saint Anthony Blvd); NE Buchanan St; Stinson Blvd (Co Rd 27); NE Garfield St; 31st Ave NE; 25th 1/2 Ave NE; Garfield St NE.
Audubon Park neighborhood detailed profile
Area: 0.665 square miles
Population: 4,919
Population density:
| Audubon Park: | 7,400 people per square mile |
| Minneapolis: | 7,749 people per square mile |
Median household income in 2021:
| Audubon Park: | $85,208 |
| Minneapolis: | $69,397 |
Median rent in in 2021:
| Audubon Park: | $1,193 |
| Minneapolis: | $1,138 |
Male vs Females
| Males: | 2,495 |
| Females: | 2,424 |
Median age
| Males: | 35.2 years |
| Females: | 35.4 years |
Housing prices:
Average estimated value of detached houses in 2021 (73.5% of all units):
| Audubon Park: | $276,327 |
| Minneapolis: | $398,431 |
Average estimated value of housing units in 2-unit structures in 2021 (21.6% of all units):
| This neighborhood: | $276,528 |
| Minneapolis: | $353,466 |
Most popular occupations of males: sales and office occupations (15.8%); computer and mathematical occupations (13.5%); business and financial operations occupations (11.5%); service occupations (10.7%); management occupations (except farmers) (8.3%); arts, design, entertainment, sports, and media occupations (7.9%); construction, extraction, and maintenance occupations (4.3%)
Most popular occupations of females: service occupations (20.1%); sales and office occupations (17.7%); management occupations (except farmers) (17.1%); healthcare practitioners and technical occupations (9.4%); education, training, and library occupations (8.6%); business and financial operations occupations (8.2%); computer and mathematical occupations (4.0%)
Roads and streets: Lowry Ave NE (Co Rd 153); 26th Ave NE; 27th Ave NE; 28th Ave NE; Co Rd 94 (29th Ave NE, Co Rd C); 30th Ave NE; Fillmore St NE; NE Lincoln St; Johnson St NE; NE Pierce St; NE Ulysses St; Hayes St NE; Brighton Ave NE; NE Arthur St; Taylor St NE; Polk St NE; NE Cleveland St; NE Benjamin St (Benjamin St NE); Buchanan St NE; Garfield St; St Anthony Pkwy Svc Rd; NE Tyler St; McKinley St NE; NE Polk St; NE Taylor St; Saint Anthony Pkwy (Saint Anthony Blvd); NE Buchanan St; Stinson Blvd (Co Rd 27); NE Garfield St; 31st Ave NE; 25th 1/2 Ave NE; Garfield St NE.
Audubon Park neighborhood detailed profile
Bancroft neighborhood in Minneapolis statistics: (Find on map)
Area: 0.369 square miles
Population: 2,901
Population density:
Median household income in 2021:
Median rent in in 2021:
Male vs Females
Median age
Housing prices:
Average estimated value of detached houses in 2021 (61.3% of all units):
Average estimated value of townhouses or other attached units in 2021 (9.6% of all units):
Average estimated value of housing units in 2-unit structures in 2021 (16.3% of all units):
Average estimated '21 value of housing units in 5-or-more-unit structures (8.5% of all units):
Most popular occupations of males: service occupations (18.2%); sales and office occupations (17.7%); architecture and engineering occupations (12.3%); management occupations (except farmers) (8.5%); computer and mathematical occupations (6.7%); education, training, and library occupations (6.3%); arts, design, entertainment, sports, and media occupations (4.7%)
Most popular occupations of females: sales and office occupations (18.0%); service occupations (14.5%); business and financial operations occupations (12.4%); management occupations (except farmers) (11.4%); healthcare practitioners and technical occupations (11.4%); education, training, and library occupations (9.6%); arts, design, entertainment, sports, and media occupations (8.6%)
Roads and streets: E 41st St; E 40th St; E 39th St; E 42nd St; Elliot Ave S; 12th Ave S; 11th Ave S; 13th Ave S; 10th Ave S; 14th Ave S; 15th Ave S; 16th Ave S; 17th Ave S; 18th Ave S; Bloomington Ave S; Cedar Ave S.
Bancroft neighborhood detailed profile
Area: 0.369 square miles
Population: 2,901
Population density:
| Bancroft: | 7,867 people per square mile |
| Minneapolis: | 7,749 people per square mile |
Median household income in 2021:
| Bancroft: | $86,970 |
| Minneapolis: | $69,397 |
Median rent in in 2021:
| Bancroft: | $1,099 |
| Minneapolis: | $1,138 |
Male vs Females
| Males: | 1,419 |
| Females: | 1,482 |
Median age
| Males: | 35.6 years |
| Females: | 36.0 years |
Housing prices:
Average estimated value of detached houses in 2021 (61.3% of all units):
| Bancroft: | $511,429 |
| Minneapolis: | $398,431 |
Average estimated value of townhouses or other attached units in 2021 (9.6% of all units):
| This neighborhood: | $1,538,626 |
| city: | $376,360 |
Average estimated value of housing units in 2-unit structures in 2021 (16.3% of all units):
| This neighborhood: | $94,598 |
| Minneapolis: | $353,466 |
Average estimated '21 value of housing units in 5-or-more-unit structures (8.5% of all units):
| Bancroft: | $25,362 |
| Minneapolis: | $317,891 |
Most popular occupations of males: service occupations (18.2%); sales and office occupations (17.7%); architecture and engineering occupations (12.3%); management occupations (except farmers) (8.5%); computer and mathematical occupations (6.7%); education, training, and library occupations (6.3%); arts, design, entertainment, sports, and media occupations (4.7%)
Most popular occupations of females: sales and office occupations (18.0%); service occupations (14.5%); business and financial operations occupations (12.4%); management occupations (except farmers) (11.4%); healthcare practitioners and technical occupations (11.4%); education, training, and library occupations (9.6%); arts, design, entertainment, sports, and media occupations (8.6%)
Roads and streets: E 41st St; E 40th St; E 39th St; E 42nd St; Elliot Ave S; 12th Ave S; 11th Ave S; 13th Ave S; 10th Ave S; 14th Ave S; 15th Ave S; 16th Ave S; 17th Ave S; 18th Ave S; Bloomington Ave S; Cedar Ave S.
Bancroft neighborhood detailed profile
Beltrami neighborhood in Minneapolis statistics: (Find on map)
Area: 0.267 square miles
Population: 1,725
Population density:
Median household income in 2021:
Median rent in in 2021:
Male vs Females
Median age
Housing prices:
Average estimated value of detached houses in 2021 (44.7% of all units):
Average estimated value of townhouses or other attached units in 2021 (3.8% of all units):
Average estimated value of housing units in 2-unit structures in 2021 (39.5% of all units):
Average estimated '21 value of housing units in 5-or-more-unit structures (3.1% of all units):
Most popular occupations of males: management occupations (except farmers) (16.1%); sales and office occupations (14.8%); service occupations (13.2%); construction, extraction, and maintenance occupations (10.0%); transportation occupations (8.9%); business and financial operations occupations (6.1%); healthcare practitioners and technical occupations (5.7%)
Most popular occupations of females: service occupations (41.4%); sales and office occupations (26.0%); management occupations (except farmers) (14.5%); business and financial operations occupations (4.9%); legal occupations (4.1%); computer and mathematical occupations (2.9%); life, physical, and social science occupations (1.7%)
Limited-access highways (interstate or state) in this neighborhood: I- 35.
Roads and streets: Buchanan St NE; Pierce St NE; Broadway St NE; Summer St NE; Fillmore St NE; Spring St NE; E Hennepin Ave; Winter St NE; Taylor St NE; Polk St NE; Lincoln St NE; Tyler St NE; 12th Ave NE; Cemetery St NE.
Railroad features: Burlington Northern Santa Fe Rlwy.
Beltrami neighborhood detailed profile
Area: 0.267 square miles
Population: 1,725
Population density:
| Beltrami: | 6,459 people per square mile |
| Minneapolis: | 7,749 people per square mile |
Median household income in 2021:
| Beltrami: | $80,900 |
| Minneapolis: | $69,397 |
Median rent in in 2021:
| Beltrami: | $1,270 |
| Minneapolis: | $1,138 |
Male vs Females
| Males: | 1,046 |
| Females: | 678 |
Median age
| Males: | 36.1 years |
| Females: | 33.4 years |
Housing prices:
Average estimated value of detached houses in 2021 (44.7% of all units):
| Beltrami: | $247,260 |
| Minneapolis: | $398,431 |
Average estimated value of townhouses or other attached units in 2021 (3.8% of all units):
| This neighborhood: | $395,455 |
| city: | $376,360 |
Average estimated value of housing units in 2-unit structures in 2021 (39.5% of all units):
| This neighborhood: | $280,758 |
| Minneapolis: | $353,466 |
Average estimated '21 value of housing units in 5-or-more-unit structures (3.1% of all units):
| Beltrami: | $148,786 |
| Minneapolis: | $317,891 |
Most popular occupations of males: management occupations (except farmers) (16.1%); sales and office occupations (14.8%); service occupations (13.2%); construction, extraction, and maintenance occupations (10.0%); transportation occupations (8.9%); business and financial operations occupations (6.1%); healthcare practitioners and technical occupations (5.7%)
Most popular occupations of females: service occupations (41.4%); sales and office occupations (26.0%); management occupations (except farmers) (14.5%); business and financial operations occupations (4.9%); legal occupations (4.1%); computer and mathematical occupations (2.9%); life, physical, and social science occupations (1.7%)
Limited-access highways (interstate or state) in this neighborhood: I- 35.
Roads and streets: Buchanan St NE; Pierce St NE; Broadway St NE; Summer St NE; Fillmore St NE; Spring St NE; E Hennepin Ave; Winter St NE; Taylor St NE; Polk St NE; Lincoln St NE; Tyler St NE; 12th Ave NE; Cemetery St NE.
Railroad features: Burlington Northern Santa Fe Rlwy.
Beltrami neighborhood detailed profile
Bottineau neighborhood in Minneapolis statistics: (Find on map)
Area: 0.283 square miles
Population: 1,647
Population density:
Median household income in 2021:
Median rent in in 2021:
Male vs Females
Median age
Housing prices:
Average estimated value of detached houses in 2021 (26.6% of all units):
Average estimated value of townhouses or other attached units in 2021 (6.2% of all units):
Average estimated value of housing units in 2-unit structures in 2021 (31.5% of all units):
Most popular occupations of males: sales and office occupations (22.3%); business and financial operations occupations (17.2%); service occupations (11.8%); management occupations (except farmers) (10.3%); transportation occupations (7.2%); arts, design, entertainment, sports, and media occupations (5.7%); construction, extraction, and maintenance occupations (4.3%)
Most popular occupations of females: service occupations (23.2%); sales and office occupations (16.8%); management occupations (except farmers) (14.0%); business and financial operations occupations (13.3%); community and social services occupations (10.8%); healthcare practitioners and technical occupations (8.4%); production occupations (3.9%)
Highways in this neighborhood: State Hwy 47 (University Ave NE).
Roads and streets: 22nd Ave NE; 23rd Ave NE; 3rd St NE; 2nd St NE; Marshall St NE (Co Rd 23); NE Grand St; 17th Ave NE; 19th Ave NE; 24th Ave NE; 20th Ave NE; 18th Ave NE; California St NE; 1st St NE.
Railroad features: Burlington Northern Santa Fe Rlwy.
Bottineau neighborhood detailed profile
Area: 0.283 square miles
Population: 1,647
Population density:
| Bottineau: | 5,822 people per square mile |
| Minneapolis: | 7,749 people per square mile |
Median household income in 2021:
| Bottineau: | $66,213 |
| Minneapolis: | $69,397 |
Median rent in in 2021:
| Bottineau: | $1,011 |
| Minneapolis: | $1,138 |
Male vs Females
| Males: | 881 |
| Females: | 765 |
Median age
| Males: | 35.5 years |
| Females: | 33.5 years |
Housing prices:
Average estimated value of detached houses in 2021 (26.6% of all units):
| Bottineau: | $255,993 |
| Minneapolis: | $398,431 |
Average estimated value of townhouses or other attached units in 2021 (6.2% of all units):
| This neighborhood: | $269,286 |
| city: | $376,360 |
Average estimated value of housing units in 2-unit structures in 2021 (31.5% of all units):
| This neighborhood: | $298,296 |
| Minneapolis: | $353,466 |
Most popular occupations of males: sales and office occupations (22.3%); business and financial operations occupations (17.2%); service occupations (11.8%); management occupations (except farmers) (10.3%); transportation occupations (7.2%); arts, design, entertainment, sports, and media occupations (5.7%); construction, extraction, and maintenance occupations (4.3%)
Most popular occupations of females: service occupations (23.2%); sales and office occupations (16.8%); management occupations (except farmers) (14.0%); business and financial operations occupations (13.3%); community and social services occupations (10.8%); healthcare practitioners and technical occupations (8.4%); production occupations (3.9%)
Highways in this neighborhood: State Hwy 47 (University Ave NE).
Roads and streets: 22nd Ave NE; 23rd Ave NE; 3rd St NE; 2nd St NE; Marshall St NE (Co Rd 23); NE Grand St; 17th Ave NE; 19th Ave NE; 24th Ave NE; 20th Ave NE; 18th Ave NE; California St NE; 1st St NE.
Railroad features: Burlington Northern Santa Fe Rlwy.
Bottineau neighborhood detailed profile
Bryant neighborhood in Minneapolis statistics: (Find on map)
Area: 0.298 square miles
Population: 3,088
Population density:
Median household income in 2021:
Median rent in in 2021:
Male vs Females
Median age
Housing prices:
Average estimated value of detached houses in 2021 (73.3% of all units):
Average estimated value of townhouses or other attached units in 2021 (4.8% of all units):
Most popular occupations of males: service occupations (15.2%); business and financial operations occupations (13.3%); computer and mathematical occupations (12.8%); management occupations (except farmers) (8.4%); material moving occupations (6.5%); construction, extraction, and maintenance occupations (6.3%); arts, design, entertainment, sports, and media occupations (6.0%)
Most popular occupations of females: service occupations (24.5%); sales and office occupations (21.4%); management occupations (except farmers) (15.3%); education, training, and library occupations (13.0%); production occupations (5.0%); transportation occupations (4.7%); business and financial operations occupations (4.5%)
Roads and streets: E 39th St; E 40th St; E 41st St; E 42nd St; 4th Ave S; 2nd Ave S; 3rd Ave S; 5th Ave S; Co Rd 35 (Portland Ave S); Oakland Ave S; Park Ave S (Co Rd 33); Clinton Ave S; Columbus Ave S; Chicago Ave S.
Bryant neighborhood detailed profile
Area: 0.298 square miles
Population: 3,088
Population density:
| Bryant: | 10,352 people per square mile |
| Minneapolis: | 7,749 people per square mile |
Median household income in 2021:
| Bryant: | $98,094 |
| Minneapolis: | $69,397 |
Median rent in in 2021:
| Bryant: | $1,112 |
| Minneapolis: | $1,138 |
Male vs Females
| Males: | 1,545 |
| Females: | 1,542 |
Median age
| Males: | 36.3 years |
| Females: | 36.0 years |
Housing prices:
Average estimated value of detached houses in 2021 (73.3% of all units):
| Bryant: | $293,469 |
| Minneapolis: | $398,431 |
Average estimated value of townhouses or other attached units in 2021 (4.8% of all units):
| This neighborhood: | $189,978 |
| city: | $376,360 |
Most popular occupations of males: service occupations (15.2%); business and financial operations occupations (13.3%); computer and mathematical occupations (12.8%); management occupations (except farmers) (8.4%); material moving occupations (6.5%); construction, extraction, and maintenance occupations (6.3%); arts, design, entertainment, sports, and media occupations (6.0%)
Most popular occupations of females: service occupations (24.5%); sales and office occupations (21.4%); management occupations (except farmers) (15.3%); education, training, and library occupations (13.0%); production occupations (5.0%); transportation occupations (4.7%); business and financial operations occupations (4.5%)
Roads and streets: E 39th St; E 40th St; E 41st St; E 42nd St; 4th Ave S; 2nd Ave S; 3rd Ave S; 5th Ave S; Co Rd 35 (Portland Ave S); Oakland Ave S; Park Ave S (Co Rd 33); Clinton Ave S; Columbus Ave S; Chicago Ave S.
Bryant neighborhood detailed profile
Bryn-Mawr neighborhood in Minneapolis statistics: (Find on map)
Area: 1.348 square miles
Population: 3,316
Population density:
Median household income in 2021:
Median rent in in 2021:
Male vs Females
Median age
Housing prices:
Average estimated value of detached houses in 2021 (77.9% of all units):
Average estimated value of townhouses or other attached units in 2021 (6.1% of all units):
Average estimated '21 value of housing units in 5-or-more-unit structures (30.4% of all units):
Most popular occupations of males: sales and office occupations (17.0%); management occupations (except farmers) (15.4%); business and financial operations occupations (12.1%); service occupations (8.8%); computer and mathematical occupations (8.4%); healthcare practitioners and technical occupations (7.3%); education, training, and library occupations (7.1%)
Most popular occupations of females: management occupations (except farmers) (21.5%); sales and office occupations (11.9%); business and financial operations occupations (11.4%); education, training, and library occupations (11.2%); service occupations (10.7%); healthcare practitioners and technical occupations (7.9%); computer and mathematical occupations (6.7%)
Limited-access highways (interstate or state) in this neighborhood: US Hwy 12 (I- 394).
Roads and streets: Cedar Lake Rd S; Cedar Lake Pkwy; Theodore Wirth Pkwy; Thomas Ave S; Penn Ave S (Co Rd 2); Chestnut Ave W; Morgan Ave S; Mount View Ave; Russell Ave S; Upton Ave S; S Cedar Lake Rd; W Hawthorne Ave; Sheridan Ave S; W Laurel Ave; Oliver Ave S; Newton Ave S; Cedar View Dr; Drew Ave S; Lakeview Ave S; Queen Ave S; Laurel Ave W; Washburn Ave S; Vincent Ave S; Madeira Ave; Hawthorne Ave W; Xerxes Ave S; W Franklin Ave; Antoinette Ave; 2nd Ave N; Ewing Ave S; Vincent Ave N; Washburn Ave N; Edlin Pl; W 21st St; W 22nd St; Brownie Rd; Cedar Lake Pl; N Cedar Lake Rd; Cedar View Cir; Co Rd 2 (Penn Ave N).
Railroad features: Burlington Northern Santa Fe Rlwy; Burlington Northern Santa Fe Rlwy (Union Pacific RR); Canadian Pacific Rlwy; Burlington Northern Santa Fe Rlwy (Twin Cities & Western RR).
Other features: Bassett Crk.
Bryn-Mawr neighborhood detailed profile
Area: 1.348 square miles
Population: 3,316
Population density:
| Bryn-Mawr: | 2,460 people per square mile |
| Minneapolis: | 7,749 people per square mile |
Median household income in 2021:
| Bryn-Mawr: | $124,209 |
| Minneapolis: | $69,397 |
Median rent in in 2021:
| Bryn-Mawr: | $1,385 |
| Minneapolis: | $1,138 |
Male vs Females
| Males: | 1,670 |
| Females: | 1,645 |
Median age
| Males: | 39.8 years |
| Females: | 41.3 years |
Housing prices:
Average estimated value of detached houses in 2021 (77.9% of all units):
| Bryn-Mawr: | $859,248 |
| Minneapolis: | $398,431 |
Average estimated value of townhouses or other attached units in 2021 (6.1% of all units):
| This neighborhood: | $282,292 |
| city: | $376,360 |
Average estimated '21 value of housing units in 5-or-more-unit structures (30.4% of all units):
| Bryn-Mawr: | $128,676 |
| Minneapolis: | $317,891 |
Most popular occupations of males: sales and office occupations (17.0%); management occupations (except farmers) (15.4%); business and financial operations occupations (12.1%); service occupations (8.8%); computer and mathematical occupations (8.4%); healthcare practitioners and technical occupations (7.3%); education, training, and library occupations (7.1%)
Most popular occupations of females: management occupations (except farmers) (21.5%); sales and office occupations (11.9%); business and financial operations occupations (11.4%); education, training, and library occupations (11.2%); service occupations (10.7%); healthcare practitioners and technical occupations (7.9%); computer and mathematical occupations (6.7%)
Limited-access highways (interstate or state) in this neighborhood: US Hwy 12 (I- 394).
Roads and streets: Cedar Lake Rd S; Cedar Lake Pkwy; Theodore Wirth Pkwy; Thomas Ave S; Penn Ave S (Co Rd 2); Chestnut Ave W; Morgan Ave S; Mount View Ave; Russell Ave S; Upton Ave S; S Cedar Lake Rd; W Hawthorne Ave; Sheridan Ave S; W Laurel Ave; Oliver Ave S; Newton Ave S; Cedar View Dr; Drew Ave S; Lakeview Ave S; Queen Ave S; Laurel Ave W; Washburn Ave S; Vincent Ave S; Madeira Ave; Hawthorne Ave W; Xerxes Ave S; W Franklin Ave; Antoinette Ave; 2nd Ave N; Ewing Ave S; Vincent Ave N; Washburn Ave N; Edlin Pl; W 21st St; W 22nd St; Brownie Rd; Cedar Lake Pl; N Cedar Lake Rd; Cedar View Cir; Co Rd 2 (Penn Ave N).
Railroad features: Burlington Northern Santa Fe Rlwy; Burlington Northern Santa Fe Rlwy (Union Pacific RR); Canadian Pacific Rlwy; Burlington Northern Santa Fe Rlwy (Twin Cities & Western RR).
Other features: Bassett Crk.
Bryn-Mawr neighborhood detailed profile
Calhoun Isles neighborhood in Minneapolis statistics: (Find on map)
Area: 5.520 square miles
Population: 32,461
Population density:
Median household income in 2021:
Median rent in in 2021:
Male vs Females
Median age
Housing prices:
Average estimated value of detached houses in 2021 (23.2% of all units):
Average estimated value of townhouses or other attached units in 2021 (4.4% of all units):
Average estimated value of housing units in 2-unit structures in 2021 (9.3% of all units):
Average estimated '21 value of housing units in 3-to-4-unit structures (18.9% of all units):
Average estimated '21 value of housing units in 5-or-more-unit structures (30.8% of all units):
Most popular occupations of males: management occupations (except farmers) (16.6%); sales and office occupations (16.4%); business and financial operations occupations (14.5%); computer and mathematical occupations (10.7%); service occupations (6.8%); architecture and engineering occupations (5.7%); healthcare practitioners and technical occupations (5.1%)
Most popular occupations of females: sales and office occupations (17.8%); business and financial operations occupations (15.3%); management occupations (except farmers) (11.0%); service occupations (10.5%); education, training, and library occupations (8.9%); healthcare practitioners and technical occupations (7.8%); arts, design, entertainment, sports, and media occupations (7.2%)
Limited-access highways (interstate or state) in this neighborhood: US Hwy 12 (I- 394); US Hwy 52 (I- 94, US Hwy 12).
Roads and streets: W Lake St (Co Rd 5); Kenwood Pkwy; Bryant Ave S; Lyndale Ave S; Dupont Ave S; Irving Ave S; Humboldt Ave S; Hennepin Ave S; Emerson Ave S; Colfax Ave S; W Lake of the Isles Pkwy; W 28th St; Fremont Ave S; Aldrich Ave S; Girard Ave S; W Franklin Ave; W 32nd St; Cedar Lake Pkwy; Douglas Ave; W 31st St; W 22nd St; Thomas Ave S; Lake of the Isles Pkwy E; Sheridan Ave S; Mount Curve Ave; W 26th St; W 24th St; James Ave S; Summit Ave; W 25th St; W 34th St; W 33rd St; Penn Ave S; W 29th St; Dean Blvd (Dean Pkwy); Cedar Lake Rd S; W 35th St; W 27th St; Oliver Ave S; Lagoon Ave; W 21st St; The Mall; Lincoln Ave; E Calhoun Pkwy; Cedar Lake Ave; Drew Ave S; Newton Ave S; Theodore Wirth Pkwy; Morgan Ave S; Knox Ave S; W Calhoun Pkwy; Chestnut Ave W; Holmes Ave S; Burnham Rd; Russell Ave S; Dunwoody Blvd; Ewing Ave S; Queen Ave S; Excelsior Blvd; Mount View Ave; Groveland Ter; Upton Ave S; S Cedar Lake Rd; W Hawthorne Ave; Washburn Ave S; Hennepin Ave; W Laurel Ave; Linden Ave W; Cedar View Dr; S Upton Ave; Burnham Blvd; Lyndale Ave N; Xerxes Ave S; Lakeview Ave S; St Louis Ave; Sunset Blvd; Chowen Ave S; Laurel Ave W; Logan Ave S; Kenilworth Pl; Park Ln; Lake Pl; St Paul Ave; Stadium Pkwy; Vincent Ave S; Benton Blvd; Madeira Ave; S Chowen Ave; Hawthorne Ave W; Antoinette Ave; Vineland Pl; Euclid Pl; Summit Pl; Ivy Ln; W Calhoun Pkwy (Calhoun Blvd); W Calhoun Blvd; Kenwood Isles Dr; 25th 1/2 St W; Cedar Shore Dr; Aldrich Ave N; 2nd Ave N; Depot St; Holmes Ave; Vincent Ave N; Washburn Ave N; Zenith Ave S; Waverly Pl; Edlin Pl; Brownie Rd; Oliver Pl S; W 36th St; Ontario Ave W; W 34th 1/2 St; Coniaris Way; Abbott Ave S; List Pl; Rose Ln; Lakeshore Dr; Market Plz; Cedar Lake Pl; N Cedar Lake Rd; Chowen Pl; Kenwood Triangle; Northrup Ln; Cedar View Cir; Calhoun Pkwy W; Thomas Ln; Basswood Rd; Co Rd 2 (Penn Ave N).
Railroad features: Burlington Northern Santa Fe Rlwy; Twin Cities & Western RR; Burlington Northern Santa Fe Rlwy (Union Pacific RR); Canadian Pacific Rlwy.
Other features: Bassett Crk.
Calhoun Isles neighborhood detailed profile
Area: 5.520 square miles
Population: 32,461
Population density:
| Calhoun Isles: | 5,881 people per square mile |
| Minneapolis: | 7,749 people per square mile |
Median household income in 2021:
| Calhoun Isles: | $100,258 |
| Minneapolis: | $69,397 |
Median rent in in 2021:
| Calhoun Isles: | $1,333 |
| Minneapolis: | $1,138 |
Male vs Females
| Males: | 17,003 |
| Females: | 15,458 |
Median age
| Males: | 36.8 years |
| Females: | 36.9 years |
Housing prices:
Average estimated value of detached houses in 2021 (23.2% of all units):
| Calhoun Isles: | $923,493 |
| Minneapolis: | $398,431 |
Average estimated value of townhouses or other attached units in 2021 (4.4% of all units):
| This neighborhood: | $282,292 |
| city: | $376,360 |
Average estimated value of housing units in 2-unit structures in 2021 (9.3% of all units):
| This neighborhood: | $88,602 |
| Minneapolis: | $353,466 |
Average estimated '21 value of housing units in 3-to-4-unit structures (18.9% of all units):
| Calhoun Isles: | $494,070 |
| city: | $335,939 |
Average estimated '21 value of housing units in 5-or-more-unit structures (30.8% of all units):
| Calhoun Isles: | $82,483 |
| Minneapolis: | $317,891 |
Most popular occupations of males: management occupations (except farmers) (16.6%); sales and office occupations (16.4%); business and financial operations occupations (14.5%); computer and mathematical occupations (10.7%); service occupations (6.8%); architecture and engineering occupations (5.7%); healthcare practitioners and technical occupations (5.1%)
Most popular occupations of females: sales and office occupations (17.8%); business and financial operations occupations (15.3%); management occupations (except farmers) (11.0%); service occupations (10.5%); education, training, and library occupations (8.9%); healthcare practitioners and technical occupations (7.8%); arts, design, entertainment, sports, and media occupations (7.2%)
Limited-access highways (interstate or state) in this neighborhood: US Hwy 12 (I- 394); US Hwy 52 (I- 94, US Hwy 12).
Roads and streets: W Lake St (Co Rd 5); Kenwood Pkwy; Bryant Ave S; Lyndale Ave S; Dupont Ave S; Irving Ave S; Humboldt Ave S; Hennepin Ave S; Emerson Ave S; Colfax Ave S; W Lake of the Isles Pkwy; W 28th St; Fremont Ave S; Aldrich Ave S; Girard Ave S; W Franklin Ave; W 32nd St; Cedar Lake Pkwy; Douglas Ave; W 31st St; W 22nd St; Thomas Ave S; Lake of the Isles Pkwy E; Sheridan Ave S; Mount Curve Ave; W 26th St; W 24th St; James Ave S; Summit Ave; W 25th St; W 34th St; W 33rd St; Penn Ave S; W 29th St; Dean Blvd (Dean Pkwy); Cedar Lake Rd S; W 35th St; W 27th St; Oliver Ave S; Lagoon Ave; W 21st St; The Mall; Lincoln Ave; E Calhoun Pkwy; Cedar Lake Ave; Drew Ave S; Newton Ave S; Theodore Wirth Pkwy; Morgan Ave S; Knox Ave S; W Calhoun Pkwy; Chestnut Ave W; Holmes Ave S; Burnham Rd; Russell Ave S; Dunwoody Blvd; Ewing Ave S; Queen Ave S; Excelsior Blvd; Mount View Ave; Groveland Ter; Upton Ave S; S Cedar Lake Rd; W Hawthorne Ave; Washburn Ave S; Hennepin Ave; W Laurel Ave; Linden Ave W; Cedar View Dr; S Upton Ave; Burnham Blvd; Lyndale Ave N; Xerxes Ave S; Lakeview Ave S; St Louis Ave; Sunset Blvd; Chowen Ave S; Laurel Ave W; Logan Ave S; Kenilworth Pl; Park Ln; Lake Pl; St Paul Ave; Stadium Pkwy; Vincent Ave S; Benton Blvd; Madeira Ave; S Chowen Ave; Hawthorne Ave W; Antoinette Ave; Vineland Pl; Euclid Pl; Summit Pl; Ivy Ln; W Calhoun Pkwy (Calhoun Blvd); W Calhoun Blvd; Kenwood Isles Dr; 25th 1/2 St W; Cedar Shore Dr; Aldrich Ave N; 2nd Ave N; Depot St; Holmes Ave; Vincent Ave N; Washburn Ave N; Zenith Ave S; Waverly Pl; Edlin Pl; Brownie Rd; Oliver Pl S; W 36th St; Ontario Ave W; W 34th 1/2 St; Coniaris Way; Abbott Ave S; List Pl; Rose Ln; Lakeshore Dr; Market Plz; Cedar Lake Pl; N Cedar Lake Rd; Chowen Pl; Kenwood Triangle; Northrup Ln; Cedar View Cir; Calhoun Pkwy W; Thomas Ln; Basswood Rd; Co Rd 2 (Penn Ave N).
Railroad features: Burlington Northern Santa Fe Rlwy; Twin Cities & Western RR; Burlington Northern Santa Fe Rlwy (Union Pacific RR); Canadian Pacific Rlwy.
Other features: Bassett Crk.
Calhoun Isles neighborhood detailed profile
Camden neighborhood in Minneapolis statistics: (Find on map)
Area: 4.992 square miles
Population: 36,280
Population density:
Median household income in 2021:
Median rent in in 2021:
Male vs Females
Median age
Housing prices:
Average estimated value of detached houses in 2021 (84.2% of all units):
Average estimated value of townhouses or other attached units in 2021 (3.4% of all units):
Average estimated '21 value of housing units in 5-or-more-unit structures (26.6% of all units):
Most popular occupations of males: service occupations (17.1%); sales and office occupations (14.2%); production occupations (13.8%); material moving occupations (8.9%); management occupations (except farmers) (8.0%); computer and mathematical occupations (6.3%); construction, extraction, and maintenance occupations (5.8%)
Most popular occupations of females: sales and office occupations (27.1%); service occupations (16.4%); education, training, and library occupations (11.4%); healthcare practitioners and technical occupations (7.9%); management occupations (except farmers) (7.8%); arts, design, entertainment, sports, and media occupations (5.3%); production occupations (5.0%)
Limited-access highways (interstate or state) in this neighborhood: I- 94 (US Hwy 52).
Roads and streets: Lyndale Ave N; Humboldt Ave N; 36th Ave N; 38th Ave N (Dowling Ave N); 33rd Ave N; Dupont Ave N; Bryant Ave N; 35th Ave N; 34th Ave N; Emerson Ave N; Fremont Ave N; 49th Ave N; Girard Ave N; 51st Ave N; 42nd Ave N; Aldrich Ave N; Queen Ave N; 52nd Ave N; Russell Ave N; Co Rd 2 (Penn Ave N); Sheridan Ave N; Washburn Ave N; Colfax Ave N; Upton Ave N; 37th Ave N; Vincent Ave N; 50th Ave N; Thomas Ave N; 45th Ave N; 43rd Ave N; 44th Ave N; Lowry Ave N (Co Rd 153); 39th Ave N; 41st Ave N; Oliver Ave N; Morgan Ave N; 40th Ave N; Newton Ave N; Irving Ave N; 46th Ave N; Co Rd 152 (N Mississippi Dr, Washington Ave N); James Ave N; 6th St N (N 6th St); Logan Ave N; Knox Ave N; Victory Memorial Dr (Memorial Pkwy, Memorial Dr); 47th Ave N; N 4th St; Memorial Pkwy (Victory Memorial Dr); Camden Ave N; Webber Pkwy; 48th Ave N; Osseo Rd; N 3rd St; 53rd Ave N; N 2nd St; Shingle Creek Dr; 1st St N; N 6th St; Mississippi Ct; Soo Ave N; Xerxes Ave N; Victory Ave N; Malmquist Ln; 52nd Ave; 49th 1/2 Ave N; N 4th Ct.
Railroad features: Canadian Pacific Rlwy.
Other features: Shingle Crk.
Other features: Ryan Crk.
Camden neighborhood detailed profile
Area: 4.992 square miles
Population: 36,280
Population density:
| Camden: | 7,268 people per square mile |
| Minneapolis: | 7,749 people per square mile |
Median household income in 2021:
| Camden: | $68,202 |
| Minneapolis: | $69,397 |
Median rent in in 2021:
| Camden: | $1,126 |
| Minneapolis: | $1,138 |
Male vs Females
| Males: | 18,358 |
| Females: | 17,922 |
Median age
| Males: | 35.0 years |
| Females: | 35.2 years |
Housing prices:
Average estimated value of detached houses in 2021 (84.2% of all units):
| Camden: | $205,245 |
| Minneapolis: | $398,431 |
Average estimated value of townhouses or other attached units in 2021 (3.4% of all units):
| This neighborhood: | $210,380 |
| city: | $376,360 |
Average estimated '21 value of housing units in 5-or-more-unit structures (26.6% of all units):
| Camden: | $78,212 |
| Minneapolis: | $317,891 |
Most popular occupations of males: service occupations (17.1%); sales and office occupations (14.2%); production occupations (13.8%); material moving occupations (8.9%); management occupations (except farmers) (8.0%); computer and mathematical occupations (6.3%); construction, extraction, and maintenance occupations (5.8%)
Most popular occupations of females: sales and office occupations (27.1%); service occupations (16.4%); education, training, and library occupations (11.4%); healthcare practitioners and technical occupations (7.9%); management occupations (except farmers) (7.8%); arts, design, entertainment, sports, and media occupations (5.3%); production occupations (5.0%)
Limited-access highways (interstate or state) in this neighborhood: I- 94 (US Hwy 52).
Roads and streets: Lyndale Ave N; Humboldt Ave N; 36th Ave N; 38th Ave N (Dowling Ave N); 33rd Ave N; Dupont Ave N; Bryant Ave N; 35th Ave N; 34th Ave N; Emerson Ave N; Fremont Ave N; 49th Ave N; Girard Ave N; 51st Ave N; 42nd Ave N; Aldrich Ave N; Queen Ave N; 52nd Ave N; Russell Ave N; Co Rd 2 (Penn Ave N); Sheridan Ave N; Washburn Ave N; Colfax Ave N; Upton Ave N; 37th Ave N; Vincent Ave N; 50th Ave N; Thomas Ave N; 45th Ave N; 43rd Ave N; 44th Ave N; Lowry Ave N (Co Rd 153); 39th Ave N; 41st Ave N; Oliver Ave N; Morgan Ave N; 40th Ave N; Newton Ave N; Irving Ave N; 46th Ave N; Co Rd 152 (N Mississippi Dr, Washington Ave N); James Ave N; 6th St N (N 6th St); Logan Ave N; Knox Ave N; Victory Memorial Dr (Memorial Pkwy, Memorial Dr); 47th Ave N; N 4th St; Memorial Pkwy (Victory Memorial Dr); Camden Ave N; Webber Pkwy; 48th Ave N; Osseo Rd; N 3rd St; 53rd Ave N; N 2nd St; Shingle Creek Dr; 1st St N; N 6th St; Mississippi Ct; Soo Ave N; Xerxes Ave N; Victory Ave N; Malmquist Ln; 52nd Ave; 49th 1/2 Ave N; N 4th Ct.
Railroad features: Canadian Pacific Rlwy.
Other features: Shingle Crk.
Other features: Ryan Crk.
Camden neighborhood detailed profile
Camden Industrial neighborhood in Minneapolis statistics: (Find on map)
Area: 0.280 square miles
Population: 824
Population density:
Median household income in 2021:
Median rent in in 2021:
Male vs Females
Median age
Most popular occupations of males: service occupations (21.6%); sales and office occupations (21.3%); material moving occupations (12.9%); production occupations (12.5%); construction, extraction, and maintenance occupations (11.8%); management occupations (except farmers) (8.0%); healthcare practitioners and technical occupations (4.9%)
Most popular occupations of females: sales and office occupations (27.3%); service occupations (26.1%); transportation occupations (12.5%); material moving occupations (5.6%); management occupations (except farmers) (4.4%); education, training, and library occupations (4.4%); business and financial operations occupations (4.3%)
Limited-access highways (interstate or state) in this neighborhood: I- 94 (US Hwy 52).
Roads and streets: 42nd Ave N; 1st St N.
Railroad features: Canadian Pacific Rlwy.
Other features: Shingle Crk.
Camden Industrial neighborhood detailed profile
Area: 0.280 square miles
Population: 824
Population density:
| Camden Industrial: | 2,943 people per square mile |
| Minneapolis: | 7,749 people per square mile |
Median household income in 2021:
| Camden Industrial: | $52,729 |
| Minneapolis: | $69,397 |
Median rent in in 2021:
| Camden Industrial: | $1,156 |
| Minneapolis: | $1,138 |
Male vs Females
| Males: | 381 |
| Females: | 443 |
Median age
| Males: | 33.7 years |
| Females: | 37.9 years |
Most popular occupations of males: service occupations (21.6%); sales and office occupations (21.3%); material moving occupations (12.9%); production occupations (12.5%); construction, extraction, and maintenance occupations (11.8%); management occupations (except farmers) (8.0%); healthcare practitioners and technical occupations (4.9%)
Most popular occupations of females: sales and office occupations (27.3%); service occupations (26.1%); transportation occupations (12.5%); material moving occupations (5.6%); management occupations (except farmers) (4.4%); education, training, and library occupations (4.4%); business and financial operations occupations (4.3%)
Limited-access highways (interstate or state) in this neighborhood: I- 94 (US Hwy 52).
Roads and streets: 42nd Ave N; 1st St N.
Railroad features: Canadian Pacific Rlwy.
Other features: Shingle Crk.
Camden Industrial neighborhood detailed profile
Carag neighborhood in Minneapolis statistics: (Find on map)
Area: 0.367 square miles
Population: 4,822
Population density:
Median household income in 2021:
Median rent in in 2021:
Male vs Females
Median age
Housing prices:
Average estimated value of detached houses in 2021 (14.5% of all units):
Average estimated value of townhouses or other attached units in 2021 (6.2% of all units):
Average estimated value of housing units in 2-unit structures in 2021 (11.3% of all units):
Average estimated '21 value of housing units in 3-to-4-unit structures (16.8% of all units):
Average estimated '21 value of housing units in 5-or-more-unit structures (4.8% of all units):
Most popular occupations of males: management occupations (except farmers) (20.7%); sales and office occupations (13.5%); business and financial operations occupations (12.2%); service occupations (9.5%); computer and mathematical occupations (8.5%); production occupations (6.9%); transportation occupations (4.6%)
Most popular occupations of females: sales and office occupations (26.4%); service occupations (14.5%); management occupations (except farmers) (13.6%); education, training, and library occupations (9.1%); community and social services occupations (7.9%); business and financial operations occupations (6.2%); arts, design, entertainment, sports, and media occupations (5.8%)
Roads and streets: W 34th St; W 35th St; W 33rd St; W 31st St; W 32nd St; Aldrich Ave S; Lyndale Ave S; Bryant Ave S; Colfax Ave S; Emerson Ave S; Dupont Ave S; Fremont Ave S; Girard Ave S; W 36th St.
Carag neighborhood detailed profile
Area: 0.367 square miles
Population: 4,822
Population density:
| Carag: | 13,144 people per square mile |
| Minneapolis: | 7,749 people per square mile |
Median household income in 2021:
| Carag: | $73,970 |
| Minneapolis: | $69,397 |
Median rent in in 2021:
| Carag: | $1,141 |
| Minneapolis: | $1,138 |
Male vs Females
| Males: | 2,747 |
| Females: | 2,074 |
Median age
| Males: | 34.8 years |
| Females: | 36.0 years |
Housing prices:
Average estimated value of detached houses in 2021 (14.5% of all units):
| Carag: | $778,704 |
| Minneapolis: | $398,431 |
Average estimated value of townhouses or other attached units in 2021 (6.2% of all units):
| This neighborhood: | $371,040 |
| city: | $376,360 |
Average estimated value of housing units in 2-unit structures in 2021 (11.3% of all units):
| This neighborhood: | $83,237 |
| Minneapolis: | $353,466 |
Average estimated '21 value of housing units in 3-to-4-unit structures (16.8% of all units):
| Carag: | $38,067 |
| city: | $335,939 |
Average estimated '21 value of housing units in 5-or-more-unit structures (4.8% of all units):
| Carag: | $85,765 |
| Minneapolis: | $317,891 |
Most popular occupations of males: management occupations (except farmers) (20.7%); sales and office occupations (13.5%); business and financial operations occupations (12.2%); service occupations (9.5%); computer and mathematical occupations (8.5%); production occupations (6.9%); transportation occupations (4.6%)
Most popular occupations of females: sales and office occupations (26.4%); service occupations (14.5%); management occupations (except farmers) (13.6%); education, training, and library occupations (9.1%); community and social services occupations (7.9%); business and financial operations occupations (6.2%); arts, design, entertainment, sports, and media occupations (5.8%)
Roads and streets: W 34th St; W 35th St; W 33rd St; W 31st St; W 32nd St; Aldrich Ave S; Lyndale Ave S; Bryant Ave S; Colfax Ave S; Emerson Ave S; Dupont Ave S; Fremont Ave S; Girard Ave S; W 36th St.
Carag neighborhood detailed profile
Cedar-Isles neighborhood in Minneapolis statistics: (Find on map)
Area: 0.706 square miles
Population: 2,253
Population density:
Median household income in 2021:
Median rent in in 2021:
Male vs Females
Median age
Housing prices:
Average estimated value of detached houses in 2021 (48.5% of all units):
Average estimated value of townhouses or other attached units in 2021 (4.6% of all units):
Average estimated value of housing units in 2-unit structures in 2021 (5.2% of all units):
Average estimated '21 value of housing units in 3-to-4-unit structures (5.0% of all units):
Average estimated '21 value of housing units in 5-or-more-unit structures (27.5% of all units):
Most popular occupations of males: community and social services occupations (17.7%); healthcare practitioners and technical occupations (15.0%); management occupations (except farmers) (14.7%); business and financial operations occupations (13.1%); sales and office occupations (10.3%); computer and mathematical occupations (6.5%); service occupations (6.4%)
Most popular occupations of females: sales and office occupations (20.3%); healthcare practitioners and technical occupations (18.2%); legal occupations (17.2%); business and financial operations occupations (11.9%); management occupations (except farmers) (8.4%); education, training, and library occupations (7.4%); service occupations (5.6%)
Roads and streets: W Lake St; Dean Blvd (Dean Pkwy); W 28th St; Cedar Lake Ave; Cedar Lake Pkwy; W Lake of the Isles Pkwy; Burnham Rd; Burnham Blvd; St Louis Ave; Sunset Blvd; Drew Ave S; W 29th St; Chowen Ave S; Ewing Ave S; Park Ln; Thomas Ave S; St Paul Ave; Benton Blvd; Washburn Ave S; Knox Ave S; Xerxes Ave S; S Upton Ave; Depot St; W Calhoun Pkwy; Lagoon Ave; Cedar Shore Dr; Chowen Pl; E Calhoun Pkwy; Basswood Rd; W 25th St.
Railroad features: Twin Cities & Western RR.
Cedar-Isles neighborhood detailed profile
Area: 0.706 square miles
Population: 2,253
Population density:
| Cedar-Isles: | 3,191 people per square mile |
| Minneapolis: | 7,749 people per square mile |
Median household income in 2021:
| Cedar-Isles: | $131,928 |
| Minneapolis: | $69,397 |
Median rent in in 2021:
| Cedar-Isles: | $1,412 |
| Minneapolis: | $1,138 |
Male vs Females
| Males: | 1,127 |
| Females: | 1,125 |
Median age
| Males: | 36.6 years |
| Females: | 38.0 years |
Housing prices:
Average estimated value of detached houses in 2021 (48.5% of all units):
| Cedar-Isles: | $941,553 |
| Minneapolis: | $398,431 |
Average estimated value of townhouses or other attached units in 2021 (4.6% of all units):
| This neighborhood: | $299,909 |
| city: | $376,360 |
Average estimated value of housing units in 2-unit structures in 2021 (5.2% of all units):
| This neighborhood: | $448,789 |
| Minneapolis: | $353,466 |
Average estimated '21 value of housing units in 3-to-4-unit structures (5.0% of all units):
| Cedar-Isles: | $413,846 |
| city: | $335,939 |
Average estimated '21 value of housing units in 5-or-more-unit structures (27.5% of all units):
| Cedar-Isles: | $34,724 |
| Minneapolis: | $317,891 |
Most popular occupations of males: community and social services occupations (17.7%); healthcare practitioners and technical occupations (15.0%); management occupations (except farmers) (14.7%); business and financial operations occupations (13.1%); sales and office occupations (10.3%); computer and mathematical occupations (6.5%); service occupations (6.4%)
Most popular occupations of females: sales and office occupations (20.3%); healthcare practitioners and technical occupations (18.2%); legal occupations (17.2%); business and financial operations occupations (11.9%); management occupations (except farmers) (8.4%); education, training, and library occupations (7.4%); service occupations (5.6%)
Roads and streets: W Lake St; Dean Blvd (Dean Pkwy); W 28th St; Cedar Lake Ave; Cedar Lake Pkwy; W Lake of the Isles Pkwy; Burnham Rd; Burnham Blvd; St Louis Ave; Sunset Blvd; Drew Ave S; W 29th St; Chowen Ave S; Ewing Ave S; Park Ln; Thomas Ave S; St Paul Ave; Benton Blvd; Washburn Ave S; Knox Ave S; Xerxes Ave S; S Upton Ave; Depot St; W Calhoun Pkwy; Lagoon Ave; Cedar Shore Dr; Chowen Pl; E Calhoun Pkwy; Basswood Rd; W 25th St.
Railroad features: Twin Cities & Western RR.
Cedar-Isles neighborhood detailed profile
Cedar-Riverside neighborhood in Minneapolis statistics: (Find on map)
Area: 0.549 square miles
Population: 8,966
Population density:
Median household income in 2021:
Median rent in in 2021:
Male vs Females
Median age
Average estimated value of detached houses in 2021 (3.3% of all units):
Most popular occupations of males: service occupations (23.4%); production occupations (13.1%); transportation occupations (11.5%); education, training, and library occupations (10.7%); business and financial operations occupations (10.2%); computer and mathematical occupations (8.1%); sales and office occupations (7.8%)
Most popular occupations of females: sales and office occupations (37.0%); service occupations (19.0%); healthcare practitioners and technical occupations (12.6%); transportation occupations (12.2%); education, training, and library occupations (10.5%); business and financial operations occupations (7.5%); life, physical, and social science occupations (4.6%)
Limited-access highways (interstate or state) in this neighborhood: I- 94 (US Hwy 12, US Hwy 52); I- 35.
Highways in this neighborhood: State Hwy 122.
Roads and streets: W River Pkwy; 6th St S; Riverside Ave; S 7th St; S 8th St; Butler Pl S; Cedar Ave S; 19th Ave S; 20th Ave S; S 5th St; 23rd Ave S; 15th Ave S; 22nd Ave S; S 1st St; 21st Ave S; 10th Ave SE; 25th Ave S; S 4th St; 16th Ave S; 27th Ave S; 26th Ave S; 3rd St S; 24th Ave S; Washington Ave S; Bluff St S; S 7th 1/2 St; 14th Ave S; Locust St S; Franklin Ter; Co Rd 54 (28th Ave); 7th St S; 17th Ave S; S 2nd St.
Railroad features: Burlington Northern Santa Fe Rlwy.
Cedar-Riverside neighborhood detailed profile
Area: 0.549 square miles
Population: 8,966
Population density:
| Cedar-Riverside: | 16,334 people per square mile |
| Minneapolis: | 7,749 people per square mile |
Median household income in 2021:
| Cedar-Riverside: | $28,025 |
| Minneapolis: | $69,397 |
Median rent in in 2021:
| Cedar-Riverside: | $699 |
| Minneapolis: | $1,138 |
Male vs Females
| Males: | 5,448 |
| Females: | 3,517 |
Median age
| Males: | 29.2 years |
| Females: | 40.9 years |
Average estimated value of detached houses in 2021 (3.3% of all units):
| Cedar-Riverside: | $257,895 |
| Minneapolis: | $398,431 |
Most popular occupations of males: service occupations (23.4%); production occupations (13.1%); transportation occupations (11.5%); education, training, and library occupations (10.7%); business and financial operations occupations (10.2%); computer and mathematical occupations (8.1%); sales and office occupations (7.8%)
Most popular occupations of females: sales and office occupations (37.0%); service occupations (19.0%); healthcare practitioners and technical occupations (12.6%); transportation occupations (12.2%); education, training, and library occupations (10.5%); business and financial operations occupations (7.5%); life, physical, and social science occupations (4.6%)
Limited-access highways (interstate or state) in this neighborhood: I- 94 (US Hwy 12, US Hwy 52); I- 35.
Highways in this neighborhood: State Hwy 122.
Roads and streets: W River Pkwy; 6th St S; Riverside Ave; S 7th St; S 8th St; Butler Pl S; Cedar Ave S; 19th Ave S; 20th Ave S; S 5th St; 23rd Ave S; 15th Ave S; 22nd Ave S; S 1st St; 21st Ave S; 10th Ave SE; 25th Ave S; S 4th St; 16th Ave S; 27th Ave S; 26th Ave S; 3rd St S; 24th Ave S; Washington Ave S; Bluff St S; S 7th 1/2 St; 14th Ave S; Locust St S; Franklin Ter; Co Rd 54 (28th Ave); 7th St S; 17th Ave S; S 2nd St.
Railroad features: Burlington Northern Santa Fe Rlwy.
Cedar-Riverside neighborhood detailed profile
Central neighborhood in Minneapolis statistics: (Find on map)
Area: 0.582 square miles
Population: 8,520
Population density:
Median household income in 2021:
Median rent in in 2021:
Male vs Females
Median age
Housing prices:
Average estimated value of detached houses in 2021 (59.4% of all units):
Average estimated value of townhouses or other attached units in 2021 (6.2% of all units):
Average estimated value of housing units in 2-unit structures in 2021 (16.8% of all units):
Average estimated '21 value of housing units in 3-to-4-unit structures (11.7% of all units):
Average estimated '21 value of housing units in 5-or-more-unit structures (2.1% of all units):
Most popular occupations of males: service occupations (27.8%); sales and office occupations (10.4%); management occupations (except farmers) (6.7%); production occupations (6.4%); architecture and engineering occupations (6.3%); computer and mathematical occupations (5.7%); community and social services occupations (5.5%)
Most popular occupations of females: service occupations (31.6%); sales and office occupations (19.3%); education, training, and library occupations (10.8%); management occupations (except farmers) (8.9%); healthcare practitioners and technical occupations (7.5%); business and financial operations occupations (5.9%); life, physical, and social science occupations (5.4%)
Roads and streets: Chicago Ave S; 2nd Ave S; Columbus Ave S; Park Ave S (Co Rd 33); Oakland Ave S; 3rd Ave S; Portland Ave S (Co Rd 35); 4th Ave S; 5th Ave S; Co Rd 38 (E 38th St); E 37th St; E 36th St; E 35th St; E 33rd St; E 31st St; E 32nd St; E 34th St; Clinton Ave S.
Central neighborhood detailed profile
Area: 0.582 square miles
Population: 8,520
Population density:
| Central: | 14,637 people per square mile |
| Minneapolis: | 7,749 people per square mile |
Median household income in 2021:
| Central: | $76,498 |
| Minneapolis: | $69,397 |
Median rent in in 2021:
| Central: | $1,052 |
| Minneapolis: | $1,138 |
Male vs Females
| Males: | 4,001 |
| Females: | 4,519 |
Median age
| Males: | 30.8 years |
| Females: | 29.4 years |
Housing prices:
Average estimated value of detached houses in 2021 (59.4% of all units):
| Central: | $241,970 |
| Minneapolis: | $398,431 |
Average estimated value of townhouses or other attached units in 2021 (6.2% of all units):
| This neighborhood: | $234,721 |
| city: | $376,360 |
Average estimated value of housing units in 2-unit structures in 2021 (16.8% of all units):
| This neighborhood: | $873,104 |
| Minneapolis: | $353,466 |
Average estimated '21 value of housing units in 3-to-4-unit structures (11.7% of all units):
| Central: | $93,688 |
| city: | $335,939 |
Average estimated '21 value of housing units in 5-or-more-unit structures (2.1% of all units):
| Central: | $39,098 |
| Minneapolis: | $317,891 |
Most popular occupations of males: service occupations (27.8%); sales and office occupations (10.4%); management occupations (except farmers) (6.7%); production occupations (6.4%); architecture and engineering occupations (6.3%); computer and mathematical occupations (5.7%); community and social services occupations (5.5%)
Most popular occupations of females: service occupations (31.6%); sales and office occupations (19.3%); education, training, and library occupations (10.8%); management occupations (except farmers) (8.9%); healthcare practitioners and technical occupations (7.5%); business and financial operations occupations (5.9%); life, physical, and social science occupations (5.4%)
Roads and streets: Chicago Ave S; 2nd Ave S; Columbus Ave S; Park Ave S (Co Rd 33); Oakland Ave S; 3rd Ave S; Portland Ave S (Co Rd 35); 4th Ave S; 5th Ave S; Co Rd 38 (E 38th St); E 37th St; E 36th St; E 35th St; E 33rd St; E 31st St; E 32nd St; E 34th St; Clinton Ave S.
Central neighborhood detailed profile
Cleveland neighborhood in Minneapolis statistics: (Find on map)
Area: 0.374 square miles
Population: 3,384
Population density:
Median household income in 2021:
Median rent in in 2021:
Male vs Females
Median age
Housing prices:
Average estimated value of detached houses in 2021 (93.2% of all units):
Average estimated value of townhouses or other attached units in 2021 (3.1% of all units):
Most popular occupations of males: service occupations (22.7%); sales and office occupations (16.8%); management occupations (except farmers) (15.2%); production occupations (9.7%); computer and mathematical occupations (8.6%); business and financial operations occupations (7.2%); material moving occupations (5.2%)
Most popular occupations of females: education, training, and library occupations (24.5%); sales and office occupations (16.0%); computer and mathematical occupations (9.0%); service occupations (9.0%); production occupations (8.6%); management occupations (except farmers) (8.5%); business and financial operations occupations (4.6%)
Roads and streets: Thomas Ave N; Upton Ave N; Vincent Ave N; Sheridan Ave N; Russell Ave N; Lowry Ave N (Co Rd 153); 34th Ave N; 37th Ave N; 35th Ave N; 36th Ave N; Washburn Ave N; Queen Ave N; 33rd Ave N; Co Rd 2 (Penn Ave N).
Cleveland neighborhood detailed profile
Area: 0.374 square miles
Population: 3,384
Population density:
| Cleveland: | 9,056 people per square mile |
| Minneapolis: | 7,749 people per square mile |
Median household income in 2021:
| Cleveland: | $76,584 |
| Minneapolis: | $69,397 |
Median rent in in 2021:
| Cleveland: | $1,339 |
| Minneapolis: | $1,138 |
Male vs Females
| Males: | 1,783 |
| Females: | 1,600 |
Median age
| Males: | 37.1 years |
| Females: | 33.6 years |
Housing prices:
Average estimated value of detached houses in 2021 (93.2% of all units):
| Cleveland: | $188,541 |
| Minneapolis: | $398,431 |
Average estimated value of townhouses or other attached units in 2021 (3.1% of all units):
| This neighborhood: | $216,275 |
| city: | $376,360 |
Most popular occupations of males: service occupations (22.7%); sales and office occupations (16.8%); management occupations (except farmers) (15.2%); production occupations (9.7%); computer and mathematical occupations (8.6%); business and financial operations occupations (7.2%); material moving occupations (5.2%)
Most popular occupations of females: education, training, and library occupations (24.5%); sales and office occupations (16.0%); computer and mathematical occupations (9.0%); service occupations (9.0%); production occupations (8.6%); management occupations (except farmers) (8.5%); business and financial operations occupations (4.6%)
Roads and streets: Thomas Ave N; Upton Ave N; Vincent Ave N; Sheridan Ave N; Russell Ave N; Lowry Ave N (Co Rd 153); 34th Ave N; 37th Ave N; 35th Ave N; 36th Ave N; Washburn Ave N; Queen Ave N; 33rd Ave N; Co Rd 2 (Penn Ave N).
Cleveland neighborhood detailed profile
Columbia neighborhood in Minneapolis statistics: (Find on map)
Area: 1.501 square miles
Population: 1,229
Population density:
Median household income in 2021:
Median rent in in 2021:
Male vs Females
Median age
Housing prices:
Average estimated value of detached houses in 2021 (96.1% of all units):
Average estimated value of townhouses or other attached units in 2021 (3.5% of all units):
Average estimated '21 value of housing units in 5-or-more-unit structures (76.8% of all units):
Most popular occupations of males: service occupations (17.8%); sales and office occupations (17.7%); computer and mathematical occupations (14.9%); management occupations (except farmers) (12.4%); arts, design, entertainment, sports, and media occupations (7.4%); production occupations (6.8%); transportation occupations (5.3%)
Most popular occupations of females: sales and office occupations (26.1%); service occupations (19.1%); production occupations (10.3%); management occupations (except farmers) (8.7%); community and social services occupations (6.8%); education, training, and library occupations (6.7%); computer and mathematical occupations (4.5%)
Highways in this neighborhood: State Hwy 65 (Central Ave NE); University Ave NE (State Hwy 47).
Roads and streets: Saint Anthony Pkwy (Saint Anthony Blvd); 36th Ave NE; Columbia Pkwy; 27th Ave NE; 35th Ave NE; 36th 1/2 Ave NE; 5th St NE; NE Main St; Marshall St NE (Co Rd 23); Edge Pl; NE Madison Pl; 2nd St NE; 2nd 1/2 St NE; E River Rd (Co Rd 23); NE Valley St; Spain Pl (NE Spain Pl); 3rd St NE; Architect Ave; Main St; 37th Ave NE; Monroe St NE; Technology Dr NE.
Railroad features: Canadian Pacific Rlwy; Burlington Northern Santa Fe Rlwy.
Columbia neighborhood detailed profile
Area: 1.501 square miles
Population: 1,229
Population density:
| Columbia: | 819 people per square mile |
| Minneapolis: | 7,749 people per square mile |
Median household income in 2021:
| Columbia: | $72,313 |
| Minneapolis: | $69,397 |
Median rent in in 2021:
| Columbia: | $1,385 |
| Minneapolis: | $1,138 |
Male vs Females
| Males: | 595 |
| Females: | 634 |
Median age
| Males: | 35.8 years |
| Females: | 35.3 years |
Housing prices:
Average estimated value of detached houses in 2021 (96.1% of all units):
| Columbia: | $244,188 |
| Minneapolis: | $398,431 |
Average estimated value of townhouses or other attached units in 2021 (3.5% of all units):
| This neighborhood: | $232,991 |
| city: | $376,360 |
Average estimated '21 value of housing units in 5-or-more-unit structures (76.8% of all units):
| Columbia: | $242,686 |
| Minneapolis: | $317,891 |
Most popular occupations of males: service occupations (17.8%); sales and office occupations (17.7%); computer and mathematical occupations (14.9%); management occupations (except farmers) (12.4%); arts, design, entertainment, sports, and media occupations (7.4%); production occupations (6.8%); transportation occupations (5.3%)
Most popular occupations of females: sales and office occupations (26.1%); service occupations (19.1%); production occupations (10.3%); management occupations (except farmers) (8.7%); community and social services occupations (6.8%); education, training, and library occupations (6.7%); computer and mathematical occupations (4.5%)
Highways in this neighborhood: State Hwy 65 (Central Ave NE); University Ave NE (State Hwy 47).
Roads and streets: Saint Anthony Pkwy (Saint Anthony Blvd); 36th Ave NE; Columbia Pkwy; 27th Ave NE; 35th Ave NE; 36th 1/2 Ave NE; 5th St NE; NE Main St; Marshall St NE (Co Rd 23); Edge Pl; NE Madison Pl; 2nd St NE; 2nd 1/2 St NE; E River Rd (Co Rd 23); NE Valley St; Spain Pl (NE Spain Pl); 3rd St NE; Architect Ave; Main St; 37th Ave NE; Monroe St NE; Technology Dr NE.
Railroad features: Canadian Pacific Rlwy; Burlington Northern Santa Fe Rlwy.
Columbia neighborhood detailed profile
Como neighborhood in Minneapolis statistics: (Find on map)
Area: 1.123 square miles
Population: 3,861
Population density:
Median household income in 2021:
Median rent in in 2021:
Male vs Females
Median age
Housing prices:
Average estimated value of detached houses in 2021 (51.0% of all units):
Average estimated value of housing units in 2-unit structures in 2021 (15.4% of all units):
Most popular occupations of males: sales and office occupations (18.4%); service occupations (11.8%); management occupations (except farmers) (10.0%); life, physical, and social science occupations (7.9%); business and financial operations occupations (6.4%); arts, design, entertainment, sports, and media occupations (5.6%); construction, extraction, and maintenance occupations (5.5%)
Most popular occupations of females: service occupations (21.3%); sales and office occupations (21.1%); healthcare practitioners and technical occupations (19.6%); education, training, and library occupations (15.2%); management occupations (except farmers) (6.9%); community and social services occupations (3.9%); legal occupations (3.0%)
Limited-access highways (interstate or state) in this neighborhood: I- 35.
Roads and streets: Como Ave SE; Talmage Ave SE; Elm St SE; Kasota Ave SE; Weeks Ave SE; Fairmount Ave SE; E Hennepin Ave; 29th Ave SE; 24th Ave SE; 18th Ave SE; 17th Ave SE; Cole Ave SE; 15th Ave SE; 13th Ave SE; 19th Ave SE; Rollins Ave SE; 22nd Ave SE; 21st Ave SE; 20th Ave SE; 16th Ave SE; 27th Ave SE; 23rd Ave SE; 12th Ave SE; 14th Ave SE; 25th Ave SE; Brook Ave SE; 26th Ave SE; 11th Ave SE; 33rd Ave SE; 30th Ave SE; 28th Ave SE; 10th Ave SE; Kasota Cir SE; Paul Pl; Ulysses St NE.
Railroad features: Burlington Northern Santa Fe Rlwy; Canadian Pacific Rlwy.
Como neighborhood detailed profile
Area: 1.123 square miles
Population: 3,861
Population density:
| Como: | 3,439 people per square mile |
| Minneapolis: | 7,749 people per square mile |
Median household income in 2021:
| Como: | $82,961 |
| Minneapolis: | $69,397 |
Median rent in in 2021:
| Como: | $1,099 |
| Minneapolis: | $1,138 |
Male vs Females
| Males: | 1,968 |
| Females: | 1,893 |
Median age
| Males: | 34.1 years |
| Females: | 34.4 years |
Housing prices:
Average estimated value of detached houses in 2021 (51.0% of all units):
| Como: | $247,259 |
| Minneapolis: | $398,431 |
Average estimated value of housing units in 2-unit structures in 2021 (15.4% of all units):
| This neighborhood: | $280,758 |
| Minneapolis: | $353,466 |
Most popular occupations of males: sales and office occupations (18.4%); service occupations (11.8%); management occupations (except farmers) (10.0%); life, physical, and social science occupations (7.9%); business and financial operations occupations (6.4%); arts, design, entertainment, sports, and media occupations (5.6%); construction, extraction, and maintenance occupations (5.5%)
Most popular occupations of females: service occupations (21.3%); sales and office occupations (21.1%); healthcare practitioners and technical occupations (19.6%); education, training, and library occupations (15.2%); management occupations (except farmers) (6.9%); community and social services occupations (3.9%); legal occupations (3.0%)
Limited-access highways (interstate or state) in this neighborhood: I- 35.
Roads and streets: Como Ave SE; Talmage Ave SE; Elm St SE; Kasota Ave SE; Weeks Ave SE; Fairmount Ave SE; E Hennepin Ave; 29th Ave SE; 24th Ave SE; 18th Ave SE; 17th Ave SE; Cole Ave SE; 15th Ave SE; 13th Ave SE; 19th Ave SE; Rollins Ave SE; 22nd Ave SE; 21st Ave SE; 20th Ave SE; 16th Ave SE; 27th Ave SE; 23rd Ave SE; 12th Ave SE; 14th Ave SE; 25th Ave SE; Brook Ave SE; 26th Ave SE; 11th Ave SE; 33rd Ave SE; 30th Ave SE; 28th Ave SE; 10th Ave SE; Kasota Cir SE; Paul Pl; Ulysses St NE.
Railroad features: Burlington Northern Santa Fe Rlwy; Canadian Pacific Rlwy.
Como neighborhood detailed profile
Cooper neighborhood in Minneapolis statistics: (Find on map)
Area: 0.670 square miles
Population: 3,792
Population density:
Median household income in 2021:
Median rent in in 2021:
Male vs Females
Median age
Housing prices:
Average estimated value of detached houses in 2021 (77.4% of all units):
Average estimated value of housing units in 2-unit structures in 2021 (11.7% of all units):
Most popular occupations of males: management occupations (except farmers) (13.8%); service occupations (11.6%); sales and office occupations (9.6%); computer and mathematical occupations (9.2%); education, training, and library occupations (7.5%); arts, design, entertainment, sports, and media occupations (7.5%); construction, extraction, and maintenance occupations (7.3%)
Most popular occupations of females: sales and office occupations (16.2%); management occupations (except farmers) (15.6%); education, training, and library occupations (15.5%); service occupations (13.0%); healthcare practitioners and technical occupations (10.6%); business and financial operations occupations (5.3%); community and social services occupations (5.2%)
Roads and streets: W River Pkwy; E Lake St; E 33rd St; E 32nd St; 40th Ave S; 39th Ave S; 41st Ave S; E 34th St; Dorman Ave S; 42nd Ave S; 43rd Ave S; E 31st St; 46th Ave S; 44th Ave S; E 29th St; 45th Ave S; 47th Ave S; E 28th St; 48th Ave S; Edmund Blvd S; E 27th St; Riverside Pkwy.
Cooper neighborhood detailed profile
Area: 0.670 square miles
Population: 3,792
Population density:
| Cooper: | 5,662 people per square mile |
| Minneapolis: | 7,749 people per square mile |
Median household income in 2021:
| Cooper: | $94,777 |
| Minneapolis: | $69,397 |
Median rent in in 2021:
| Cooper: | $1,191 |
| Minneapolis: | $1,138 |
Male vs Females
| Males: | 1,883 |
| Females: | 1,908 |
Median age
| Males: | 41.0 years |
| Females: | 45.4 years |
Housing prices:
Average estimated value of detached houses in 2021 (77.4% of all units):
| Cooper: | $217,500 |
| Minneapolis: | $398,431 |
Average estimated value of housing units in 2-unit structures in 2021 (11.7% of all units):
| This neighborhood: | $185,385 |
| Minneapolis: | $353,466 |
Most popular occupations of males: management occupations (except farmers) (13.8%); service occupations (11.6%); sales and office occupations (9.6%); computer and mathematical occupations (9.2%); education, training, and library occupations (7.5%); arts, design, entertainment, sports, and media occupations (7.5%); construction, extraction, and maintenance occupations (7.3%)
Most popular occupations of females: sales and office occupations (16.2%); management occupations (except farmers) (15.6%); education, training, and library occupations (15.5%); service occupations (13.0%); healthcare practitioners and technical occupations (10.6%); business and financial operations occupations (5.3%); community and social services occupations (5.2%)
Roads and streets: W River Pkwy; E Lake St; E 33rd St; E 32nd St; 40th Ave S; 39th Ave S; 41st Ave S; E 34th St; Dorman Ave S; 42nd Ave S; 43rd Ave S; E 31st St; 46th Ave S; 44th Ave S; E 29th St; 45th Ave S; 47th Ave S; E 28th St; 48th Ave S; Edmund Blvd S; E 27th St; Riverside Pkwy.
Cooper neighborhood detailed profile
Corcoran neighborhood in Minneapolis statistics: (Find on map)
Area: 0.457 square miles
Population: 3,716
Population density:
Median household income in 2021:
Median rent in in 2021:
Male vs Females
Median age
Housing prices:
Average estimated value of detached houses in 2021 (64.3% of all units):
Average estimated value of housing units in 2-unit structures in 2021 (19.4% of all units):
Average estimated '21 value of housing units in 5-or-more-unit structures (8.8% of all units):
Most popular occupations of males: sales and office occupations (21.5%); service occupations (11.4%); computer and mathematical occupations (9.9%); business and financial operations occupations (8.3%); construction, extraction, and maintenance occupations (6.0%); community and social services occupations (4.9%); arts, design, entertainment, sports, and media occupations (4.4%)
Most popular occupations of females: education, training, and library occupations (19.5%); service occupations (16.7%); management occupations (except farmers) (11.6%); business and financial operations occupations (11.3%); sales and office occupations (10.5%); architecture and engineering occupations (7.3%); healthcare practitioners and technical occupations (7.2%)
Highways in this neighborhood: State Hwy 55 (Hiawatha Ave).
Roads and streets: E 35th St; E 34th St; E 33rd St; E 32nd St; 22nd Ave S; 19th Ave S; 21st Ave S; 24th Ave S; E 31st St; Longfellow Ave S; 23rd Ave S; 25th Ave S; 20th Ave S; 26th Ave S; 27th Ave S; 28th Ave (Co Rd 54).
Corcoran neighborhood detailed profile
Area: 0.457 square miles
Population: 3,716
Population density:
| Corcoran: | 8,125 people per square mile |
| Minneapolis: | 7,749 people per square mile |
Median household income in 2021:
| Corcoran: | $69,401 |
| Minneapolis: | $69,397 |
Median rent in in 2021:
| Corcoran: | $1,288 |
| Minneapolis: | $1,138 |
Male vs Females
| Males: | 1,796 |
| Females: | 1,919 |
Median age
| Males: | 34.9 years |
| Females: | 35.0 years |
Housing prices:
Average estimated value of detached houses in 2021 (64.3% of all units):
| Corcoran: | $314,000 |
| Minneapolis: | $398,431 |
Average estimated value of housing units in 2-unit structures in 2021 (19.4% of all units):
| This neighborhood: | $256,667 |
| Minneapolis: | $353,466 |
Average estimated '21 value of housing units in 5-or-more-unit structures (8.8% of all units):
| Corcoran: | $146,905 |
| Minneapolis: | $317,891 |
Most popular occupations of males: sales and office occupations (21.5%); service occupations (11.4%); computer and mathematical occupations (9.9%); business and financial operations occupations (8.3%); construction, extraction, and maintenance occupations (6.0%); community and social services occupations (4.9%); arts, design, entertainment, sports, and media occupations (4.4%)
Most popular occupations of females: education, training, and library occupations (19.5%); service occupations (16.7%); management occupations (except farmers) (11.6%); business and financial operations occupations (11.3%); sales and office occupations (10.5%); architecture and engineering occupations (7.3%); healthcare practitioners and technical occupations (7.2%)
Highways in this neighborhood: State Hwy 55 (Hiawatha Ave).
Roads and streets: E 35th St; E 34th St; E 33rd St; E 32nd St; 22nd Ave S; 19th Ave S; 21st Ave S; 24th Ave S; E 31st St; Longfellow Ave S; 23rd Ave S; 25th Ave S; 20th Ave S; 26th Ave S; 27th Ave S; 28th Ave (Co Rd 54).
Corcoran neighborhood detailed profile
Diamond Lake neighborhood in Minneapolis statistics: (Find on map)
Area: 1.199 square miles
Population: 8,551
Population density:
Median household income in 2021:
Median rent in in 2021:
Male vs Females
Median age
Housing prices:
Average estimated value of detached houses in 2021 (61.8% of all units):
Average estimated value of townhouses or other attached units in 2021 (14.3% of all units):
Average estimated '21 value of housing units in 5-or-more-unit structures (52.3% of all units):
Most popular occupations of males: sales and office occupations (17.9%); computer and mathematical occupations (15.3%); management occupations (except farmers) (13.1%); business and financial operations occupations (11.0%); service occupations (5.2%); architecture and engineering occupations (4.7%); production occupations (4.5%)
Most popular occupations of females: sales and office occupations (20.6%); service occupations (16.1%); business and financial operations occupations (13.8%); arts, design, entertainment, sports, and media occupations (12.0%); healthcare practitioners and technical occupations (9.6%); education, training, and library occupations (7.8%); management occupations (except farmers) (5.1%)
Highways in this neighborhood: Crosstown Hwy (State Hwy 62); State Hwy 77.
Roads and streets: E 58th St; E 61st St; E 60th St; E 57th St; E 62nd St; E 56th St; E 59th St; Co Rd 35 (Portland Ave S); 11th Ave S; 12th Ave S; 10th Ave S; Elliot Ave S; 2nd Ave S; Crosstown Svc Rd; Chicago Ave S; Park Ave S; 14th Ave S; 13th Ave S; Clinton Ave S; Cedar Ave S; 15th Ave S; Oakland Ave S; Bloomington Ave S; Columbus Ave S; Chester St; Edgewater Blvd; 16th Ave S; 4th Ave S; 3rd Ave S; 5th Ave S; Diamond Lake Ln; Nokomis Ct; Roslyn Pl; Nokomis Ln; Loren Dr; 18th Ave S; Nokomis Cir.
Diamond Lake neighborhood detailed profile
Area: 1.199 square miles
Population: 8,551
Population density:
| Diamond Lake: | 7,133 people per square mile |
| Minneapolis: | 7,749 people per square mile |
Median household income in 2021:
| Diamond Lake: | $127,373 |
| Minneapolis: | $69,397 |
Median rent in in 2021:
| Diamond Lake: | $1,512 |
| Minneapolis: | $1,138 |
Male vs Females
| Males: | 3,793 |
| Females: | 4,758 |
Median age
| Males: | 37.3 years |
| Females: | 36.0 years |
Housing prices:
Average estimated value of detached houses in 2021 (61.8% of all units):
| Diamond Lake: | $306,545 |
| Minneapolis: | $398,431 |
Average estimated value of townhouses or other attached units in 2021 (14.3% of all units):
| This neighborhood: | $43,790 |
| city: | $376,360 |
Average estimated '21 value of housing units in 5-or-more-unit structures (52.3% of all units):
| Diamond Lake: | $175,712 |
| Minneapolis: | $317,891 |
Most popular occupations of males: sales and office occupations (17.9%); computer and mathematical occupations (15.3%); management occupations (except farmers) (13.1%); business and financial operations occupations (11.0%); service occupations (5.2%); architecture and engineering occupations (4.7%); production occupations (4.5%)
Most popular occupations of females: sales and office occupations (20.6%); service occupations (16.1%); business and financial operations occupations (13.8%); arts, design, entertainment, sports, and media occupations (12.0%); healthcare practitioners and technical occupations (9.6%); education, training, and library occupations (7.8%); management occupations (except farmers) (5.1%)
Highways in this neighborhood: Crosstown Hwy (State Hwy 62); State Hwy 77.
Roads and streets: E 58th St; E 61st St; E 60th St; E 57th St; E 62nd St; E 56th St; E 59th St; Co Rd 35 (Portland Ave S); 11th Ave S; 12th Ave S; 10th Ave S; Elliot Ave S; 2nd Ave S; Crosstown Svc Rd; Chicago Ave S; Park Ave S; 14th Ave S; 13th Ave S; Clinton Ave S; Cedar Ave S; 15th Ave S; Oakland Ave S; Bloomington Ave S; Columbus Ave S; Chester St; Edgewater Blvd; 16th Ave S; 4th Ave S; 3rd Ave S; 5th Ave S; Diamond Lake Ln; Nokomis Ct; Roslyn Pl; Nokomis Ln; Loren Dr; 18th Ave S; Nokomis Cir.
Diamond Lake neighborhood detailed profile
Downtown East neighborhood in Minneapolis statistics: (Find on map)
Area: 0.384 square miles
Population: 2,407
Population density:
Median household income in 2021:
Median rent in in 2021:
Male vs Females
Median age
Average estimated '21 value of housing units in 5-or-more-unit structures (31.7% of all units):
Most popular occupations of males: sales and office occupations (16.4%); architecture and engineering occupations (10.9%); education, training, and library occupations (10.8%); service occupations (9.7%); business and financial operations occupations (8.4%); management occupations (except farmers) (7.0%); arts, design, entertainment, sports, and media occupations (7.0%)
Most popular occupations of females: service occupations (35.8%); management occupations (except farmers) (14.6%); sales and office occupations (11.1%); business and financial operations occupations (10.1%); arts, design, entertainment, sports, and media occupations (7.5%); education, training, and library occupations (7.4%); healthcare practitioners and technical occupations (5.6%)
Limited-access highways (interstate or state) in this neighborhood: I- 35.
Highways in this neighborhood: State Hwy 122.
Roads and streets: Washington Ave S; S 2nd St; S 5th St; 6th St S; 11th Ave S; 4th St S; 3rd St S; 12th Ave S; 10th Ave S; W River Pkwy; Park Ave N (Co Rd 33); S 3rd St; Chicago Ave S; 9th Ave S; Norm McGrew Pl; 13th Ave S.
Downtown East neighborhood detailed profile
Area: 0.384 square miles
Population: 2,407
Population density:
| Downtown East: | 6,271 people per square mile |
| Minneapolis: | 7,749 people per square mile |
Median household income in 2021:
| Downtown East: | $34,992 |
| Minneapolis: | $69,397 |
Median rent in in 2021:
| Downtown East: | $901 |
| Minneapolis: | $1,138 |
Male vs Females
| Males: | 1,374 |
| Females: | 1,033 |
Median age
| Males: | 40.9 years |
| Females: | 42.7 years |
Average estimated '21 value of housing units in 5-or-more-unit structures (31.7% of all units):
| Downtown East: | $369,173 |
| Minneapolis: | $317,891 |
Most popular occupations of males: sales and office occupations (16.4%); architecture and engineering occupations (10.9%); education, training, and library occupations (10.8%); service occupations (9.7%); business and financial operations occupations (8.4%); management occupations (except farmers) (7.0%); arts, design, entertainment, sports, and media occupations (7.0%)
Most popular occupations of females: service occupations (35.8%); management occupations (except farmers) (14.6%); sales and office occupations (11.1%); business and financial operations occupations (10.1%); arts, design, entertainment, sports, and media occupations (7.5%); education, training, and library occupations (7.4%); healthcare practitioners and technical occupations (5.6%)
Limited-access highways (interstate or state) in this neighborhood: I- 35.
Highways in this neighborhood: State Hwy 122.
Roads and streets: Washington Ave S; S 2nd St; S 5th St; 6th St S; 11th Ave S; 4th St S; 3rd St S; 12th Ave S; 10th Ave S; W River Pkwy; Park Ave N (Co Rd 33); S 3rd St; Chicago Ave S; 9th Ave S; Norm McGrew Pl; 13th Ave S.
Downtown East neighborhood detailed profile
Downtown West neighborhood in Minneapolis statistics: (Find on map)
Area: 0.759 square miles
Population: 5,797
Population density:
Median household income in 2021:
Median rent in in 2021:
Male vs Females
Median age
Housing prices:
Average estimated value of detached houses in 2021 (2.2% of all units):
Average estimated value of townhouses or other attached units in 2021 (3.7% of all units):
Average estimated '21 value of housing units in 5-or-more-unit structures (83.2% of all units):
Most popular occupations of males: business and financial operations occupations (20.8%); service occupations (16.1%); computer and mathematical occupations (13.3%); sales and office occupations (12.0%); management occupations (except farmers) (10.6%); material moving occupations (4.3%); architecture and engineering occupations (4.2%)
Most popular occupations of females: business and financial operations occupations (22.3%); sales and office occupations (16.9%); management occupations (except farmers) (13.5%); education, training, and library occupations (11.0%); healthcare practitioners and technical occupations (8.4%); service occupations (7.8%); life, physical, and social science occupations (6.1%)
Limited-access highways (interstate or state) in this neighborhood: I- 394.
Highways in this neighborhood: 5th Ave S (State Hwy 65, State Hwy 55); 4th Ave S (State Hwy 65); 10th St S (State Hwy 55); State Hwy 55 (7th St S); N 7th St (State Hwy 55); State Hwy 55 (10th St N); State Hwy 65.
Roads and streets: 3rd Ave S; 2nd Ave S; Marquette Ave (Marquette Ave S); Nicollet Ave (Co Rd 52); Hennepin Ave; S 5th St; 9th St S; 4th St S; 8th St S; 3rd St S; 11th St S; Washington Ave S; 6th St S; 1st Ave N; 2nd St S; 2nd Ave N; Co Rd 35 (Portland Ave S); 12th St S; 1st St S; Lasalle Ave; W River Pkwy; Glenwood Ave; 3rd St N; 6th St N; 5th St N; 4th St N; 11th St N; 9th St N; Currie Ave (Currie Ave W); Washington Ave N; Hawthorne Ave; 8th St N; 3rd Ave N; Harmon Pl; Chestnut Ave.
Downtown West neighborhood detailed profile
Area: 0.759 square miles
Population: 5,797
Population density:
| Downtown West: | 7,638 people per square mile |
| Minneapolis: | 7,749 people per square mile |
Median household income in 2021:
| Downtown West: | $64,780 |
| Minneapolis: | $69,397 |
Median rent in in 2021:
| Downtown West: | $1,156 |
| Minneapolis: | $1,138 |
Male vs Females
| Males: | 3,408 |
| Females: | 2,388 |
Median age
| Males: | 37.3 years |
| Females: | 34.1 years |
Housing prices:
Average estimated value of detached houses in 2021 (2.2% of all units):
| Downtown West: | $505,147 |
| Minneapolis: | $398,431 |
Average estimated value of townhouses or other attached units in 2021 (3.7% of all units):
| This neighborhood: | $735,433 |
| city: | $376,360 |
Average estimated '21 value of housing units in 5-or-more-unit structures (83.2% of all units):
| Downtown West: | $362,560 |
| Minneapolis: | $317,891 |
Most popular occupations of males: business and financial operations occupations (20.8%); service occupations (16.1%); computer and mathematical occupations (13.3%); sales and office occupations (12.0%); management occupations (except farmers) (10.6%); material moving occupations (4.3%); architecture and engineering occupations (4.2%)
Most popular occupations of females: business and financial operations occupations (22.3%); sales and office occupations (16.9%); management occupations (except farmers) (13.5%); education, training, and library occupations (11.0%); healthcare practitioners and technical occupations (8.4%); service occupations (7.8%); life, physical, and social science occupations (6.1%)
Limited-access highways (interstate or state) in this neighborhood: I- 394.
Highways in this neighborhood: 5th Ave S (State Hwy 65, State Hwy 55); 4th Ave S (State Hwy 65); 10th St S (State Hwy 55); State Hwy 55 (7th St S); N 7th St (State Hwy 55); State Hwy 55 (10th St N); State Hwy 65.
Roads and streets: 3rd Ave S; 2nd Ave S; Marquette Ave (Marquette Ave S); Nicollet Ave (Co Rd 52); Hennepin Ave; S 5th St; 9th St S; 4th St S; 8th St S; 3rd St S; 11th St S; Washington Ave S; 6th St S; 1st Ave N; 2nd St S; 2nd Ave N; Co Rd 35 (Portland Ave S); 12th St S; 1st St S; Lasalle Ave; W River Pkwy; Glenwood Ave; 3rd St N; 6th St N; 5th St N; 4th St N; 11th St N; 9th St N; Currie Ave (Currie Ave W); Washington Ave N; Hawthorne Ave; 8th St N; 3rd Ave N; Harmon Pl; Chestnut Ave.
Downtown West neighborhood detailed profile
East Harriet neighborhood in Minneapolis statistics: (Find on map)
Area: 1.224 square miles
Population: 3,119
Population density:
Median household income in 2021:
Median rent in in 2021:
Male vs Females
Median age
Housing prices:
Average estimated value of detached houses in 2021 (43.3% of all units):
Average estimated value of townhouses or other attached units in 2021 (4.7% of all units):
Average estimated value of housing units in 2-unit structures in 2021 (11.7% of all units):
Average estimated '21 value of housing units in 3-to-4-unit structures (3.4% of all units):
Average estimated '21 value of housing units in 5-or-more-unit structures (127.1% of all units):
Most popular occupations of males: service occupations (17.4%); management occupations (except farmers) (15.0%); business and financial operations occupations (13.9%); sales and office occupations (9.7%); computer and mathematical occupations (9.1%); education, training, and library occupations (5.5%); healthcare practitioners and technical occupations (5.1%)
Most popular occupations of females: sales and office occupations (26.3%); management occupations (except farmers) (14.4%); education, training, and library occupations (11.1%); business and financial operations occupations (9.8%); service occupations (8.1%); arts, design, entertainment, sports, and media occupations (6.1%); healthcare practitioners and technical occupations (5.7%)
Roads and streets: Aldrich Ave S; Lyndale Ave S; Bryant Ave S; Kings Hwy (Dupont Ave S); Colfax Ave S; E Lake Harriet Blvd; W 44th St; W 43rd St; W 42nd St; Roseway Rd; W 38th St (Co Rd 38); W 40th St; W 45th St; W 41st St; W 37th St; Fremont Ave S; W 46th St; W 39th St; E Lake Harriet Pkwy; E Calhoun Pkwy.
East Harriet neighborhood detailed profile
Area: 1.224 square miles
Population: 3,119
Population density:
| East Harriet: | 2,548 people per square mile |
| Minneapolis: | 7,749 people per square mile |
Median household income in 2021:
| East Harriet: | $100,193 |
| Minneapolis: | $69,397 |
Median rent in in 2021:
| East Harriet: | $1,232 |
| Minneapolis: | $1,138 |
Male vs Females
| Males: | 1,387 |
| Females: | 1,732 |
Median age
| Males: | 41.9 years |
| Females: | 37.5 years |
Housing prices:
Average estimated value of detached houses in 2021 (43.3% of all units):
| East Harriet: | $767,000 |
| Minneapolis: | $398,431 |
Average estimated value of townhouses or other attached units in 2021 (4.7% of all units):
| This neighborhood: | $256,252 |
| city: | $376,360 |
Average estimated value of housing units in 2-unit structures in 2021 (11.7% of all units):
| This neighborhood: | $456,800 |
| Minneapolis: | $353,466 |
Average estimated '21 value of housing units in 3-to-4-unit structures (3.4% of all units):
| East Harriet: | $1,158,876 |
| city: | $335,939 |
Average estimated '21 value of housing units in 5-or-more-unit structures (127.1% of all units):
| East Harriet: | $33,940 |
| Minneapolis: | $317,891 |
Most popular occupations of males: service occupations (17.4%); management occupations (except farmers) (15.0%); business and financial operations occupations (13.9%); sales and office occupations (9.7%); computer and mathematical occupations (9.1%); education, training, and library occupations (5.5%); healthcare practitioners and technical occupations (5.1%)
Most popular occupations of females: sales and office occupations (26.3%); management occupations (except farmers) (14.4%); education, training, and library occupations (11.1%); business and financial operations occupations (9.8%); service occupations (8.1%); arts, design, entertainment, sports, and media occupations (6.1%); healthcare practitioners and technical occupations (5.7%)
Roads and streets: Aldrich Ave S; Lyndale Ave S; Bryant Ave S; Kings Hwy (Dupont Ave S); Colfax Ave S; E Lake Harriet Blvd; W 44th St; W 43rd St; W 42nd St; Roseway Rd; W 38th St (Co Rd 38); W 40th St; W 45th St; W 41st St; W 37th St; Fremont Ave S; W 46th St; W 39th St; E Lake Harriet Pkwy; E Calhoun Pkwy.
East Harriet neighborhood detailed profile
East Isles neighborhood in Minneapolis statistics: (Find on map)
Area: 0.332 square miles
Population: 5,154
Population density:
Median household income in 2021:
Median rent in in 2021:
Male vs Females
Median age
Housing prices:
Average estimated value of detached houses in 2021 (19.3% of all units):
Average estimated value of townhouses or other attached units in 2021 (5.1% of all units):
Average estimated value of housing units in 2-unit structures in 2021 (5.3% of all units):
Average estimated '21 value of housing units in 3-to-4-unit structures (12.9% of all units):
Average estimated '21 value of housing units in 5-or-more-unit structures (19.1% of all units):
Most popular occupations of males: sales and office occupations (19.3%); management occupations (except farmers) (11.8%); business and financial operations occupations (11.7%); service occupations (9.4%); computer and mathematical occupations (7.2%); life, physical, and social science occupations (7.0%); healthcare practitioners and technical occupations (6.0%)
Most popular occupations of females: business and financial operations occupations (21.1%); sales and office occupations (16.0%); education, training, and library occupations (12.0%); management occupations (except farmers) (8.9%); community and social services occupations (8.2%); healthcare practitioners and technical occupations (7.9%); legal occupations (5.8%)
Roads and streets: Hennepin Ave S; Irving Ave S; Humboldt Ave S; The Mall; Lake of the Isles Pkwy E; W 25th St; W 26th St; W 24th St; W Lake St; Lagoon Ave; W 28th St; W 27th St; Lake Pl; James Ave S; Girard Ave S; Euclid Pl; Kenwood Isles Dr; 25th 1/2 St W; Fremont Ave S; Emerson Ave S; Holmes Ave S (Holmes Ct).
East Isles neighborhood detailed profile
Area: 0.332 square miles
Population: 5,154
Population density:
| East Isles: | 15,546 people per square mile |
| Minneapolis: | 7,749 people per square mile |
Median household income in 2021:
| East Isles: | $141,313 |
| Minneapolis: | $69,397 |
Median rent in in 2021:
| East Isles: | $1,232 |
| Minneapolis: | $1,138 |
Male vs Females
| Males: | 2,369 |
| Females: | 2,784 |
Median age
| Males: | 38.9 years |
| Females: | 38.8 years |
Housing prices:
Average estimated value of detached houses in 2021 (19.3% of all units):
| East Isles: | $647,499 |
| Minneapolis: | $398,431 |
Average estimated value of townhouses or other attached units in 2021 (5.1% of all units):
| This neighborhood: | $445,615 |
| city: | $376,360 |
Average estimated value of housing units in 2-unit structures in 2021 (5.3% of all units):
| This neighborhood: | $500,760 |
| Minneapolis: | $353,466 |
Average estimated '21 value of housing units in 3-to-4-unit structures (12.9% of all units):
| East Isles: | $382,177 |
| city: | $335,939 |
Average estimated '21 value of housing units in 5-or-more-unit structures (19.1% of all units):
| East Isles: | $86,331 |
| Minneapolis: | $317,891 |
Most popular occupations of males: sales and office occupations (19.3%); management occupations (except farmers) (11.8%); business and financial operations occupations (11.7%); service occupations (9.4%); computer and mathematical occupations (7.2%); life, physical, and social science occupations (7.0%); healthcare practitioners and technical occupations (6.0%)
Most popular occupations of females: business and financial operations occupations (21.1%); sales and office occupations (16.0%); education, training, and library occupations (12.0%); management occupations (except farmers) (8.9%); community and social services occupations (8.2%); healthcare practitioners and technical occupations (7.9%); legal occupations (5.8%)
Roads and streets: Hennepin Ave S; Irving Ave S; Humboldt Ave S; The Mall; Lake of the Isles Pkwy E; W 25th St; W 26th St; W 24th St; W Lake St; Lagoon Ave; W 28th St; W 27th St; Lake Pl; James Ave S; Girard Ave S; Euclid Pl; Kenwood Isles Dr; 25th 1/2 St W; Fremont Ave S; Emerson Ave S; Holmes Ave S (Holmes Ct).
East Isles neighborhood detailed profile
Ecco neighborhood in Minneapolis statistics: (Find on map)
Area: 0.425 square miles
Population: 2,589
Population density:
Median household income in 2021:
Median rent in in 2021:
Male vs Females
Median age
Housing prices:
Average estimated value of detached houses in 2021 (29.3% of all units):
Average estimated value of townhouses or other attached units in 2021 (7.3% of all units):
Average estimated value of housing units in 2-unit structures in 2021 (17.0% of all units):
Average estimated '21 value of housing units in 5-or-more-unit structures (16.1% of all units):
Most popular occupations of males: business and financial operations occupations (18.2%); management occupations (except farmers) (15.3%); computer and mathematical occupations (12.8%); sales and office occupations (12.6%); healthcare practitioners and technical occupations (8.6%); arts, design, entertainment, sports, and media occupations (6.7%); legal occupations (6.2%)
Most popular occupations of females: business and financial operations occupations (20.8%); healthcare practitioners and technical occupations (17.4%); sales and office occupations (13.0%); service occupations (10.2%); education, training, and library occupations (10.1%); legal occupations (7.1%); community and social services occupations (5.7%)
Roads and streets: E Calhoun Pkwy; Irving Ave S; Humboldt Ave S; Hennepin Ave S; W 31st St; Holmes Ave S; W 32nd St; W 36th St; W 34th St; W 33rd St; W 35th St; James Ave S; Holmes Ave; Coniaris Way.
Ecco neighborhood detailed profile
Area: 0.425 square miles
Population: 2,589
Population density:
| Ecco: | 6,087 people per square mile |
| Minneapolis: | 7,749 people per square mile |
Median household income in 2021:
| Ecco: | $102,839 |
| Minneapolis: | $69,397 |
Median rent in in 2021:
| Ecco: | $1,453 |
| Minneapolis: | $1,138 |
Male vs Females
| Males: | 1,312 |
| Females: | 1,277 |
Median age
| Males: | 36.8 years |
| Females: | 36.0 years |
Housing prices:
Average estimated value of detached houses in 2021 (29.3% of all units):
| Ecco: | $2,786,332 |
| Minneapolis: | $398,431 |
Average estimated value of townhouses or other attached units in 2021 (7.3% of all units):
| This neighborhood: | $2,777,327 |
| city: | $376,360 |
Average estimated value of housing units in 2-unit structures in 2021 (17.0% of all units):
| This neighborhood: | $1,012,489 |
| Minneapolis: | $353,466 |
Average estimated '21 value of housing units in 5-or-more-unit structures (16.1% of all units):
| Ecco: | $394,354 |
| Minneapolis: | $317,891 |
Most popular occupations of males: business and financial operations occupations (18.2%); management occupations (except farmers) (15.3%); computer and mathematical occupations (12.8%); sales and office occupations (12.6%); healthcare practitioners and technical occupations (8.6%); arts, design, entertainment, sports, and media occupations (6.7%); legal occupations (6.2%)
Most popular occupations of females: business and financial operations occupations (20.8%); healthcare practitioners and technical occupations (17.4%); sales and office occupations (13.0%); service occupations (10.2%); education, training, and library occupations (10.1%); legal occupations (7.1%); community and social services occupations (5.7%)
Roads and streets: E Calhoun Pkwy; Irving Ave S; Humboldt Ave S; Hennepin Ave S; W 31st St; Holmes Ave S; W 32nd St; W 36th St; W 34th St; W 33rd St; W 35th St; James Ave S; Holmes Ave; Coniaris Way.
Ecco neighborhood detailed profile
Elliot Park neighborhood in Minneapolis statistics: (Find on map)
Area: 0.404 square miles
Population: 5,816
Population density:
Median household income in 2021:
Median rent in in 2021:
Male vs Females
Median age
Average estimated '21 value of housing units in 5-or-more-unit structures (51.5% of all units):
Most popular occupations of males: sales and office occupations (17.6%); service occupations (15.5%); business and financial operations occupations (12.7%); management occupations (except farmers) (12.4%); computer and mathematical occupations (7.8%); arts, design, entertainment, sports, and media occupations (6.9%); production occupations (6.6%)
Most popular occupations of females: service occupations (27.9%); sales and office occupations (17.1%); management occupations (except farmers) (12.9%); healthcare practitioners and technical occupations (10.4%); business and financial operations occupations (9.3%); legal occupations (4.9%); arts, design, entertainment, sports, and media occupations (4.8%)
Limited-access highways (interstate or state) in this neighborhood: US Hwy 52 (US Hwy 12, I- 94, I- 35); I- 94 (US Hwy 12, US Hwy 52).
Highways in this neighborhood: 7th St S (State Hwy 55); State Hwy 55 (8th St S); State Hwy 55; State Hwy 65.
Roads and streets: E 15th St; Portland Ave S (Co Rd 35); E 17th St; E 14th St; Chicago Ave S; Park Ave N (Co Rd 33); 9th St S; 11th Ave S; E 16th St; 10th St S; 5th Ave S; Elliot Ave S; 13th Ave S; Park Ave S (Co Rd 33); 6th St S; S 5th St; 11th St S; 10th Ave S; Centennial Pl; 12th Ave S; 9th Ave S; E Grant St; 7th Ave S.
Elliot Park neighborhood detailed profile
Area: 0.404 square miles
Population: 5,816
Population density:
| Elliot Park: | 14,395 people per square mile |
| Minneapolis: | 7,749 people per square mile |
Median household income in 2021:
| Elliot Park: | $42,169 |
| Minneapolis: | $69,397 |
Median rent in in 2021:
| Elliot Park: | $833 |
| Minneapolis: | $1,138 |
Male vs Females
| Males: | 3,166 |
| Females: | 2,649 |
Median age
| Males: | 36.6 years |
| Females: | 36.7 years |
Average estimated '21 value of housing units in 5-or-more-unit structures (51.5% of all units):
| Elliot Park: | $66,736 |
| Minneapolis: | $317,891 |
Most popular occupations of males: sales and office occupations (17.6%); service occupations (15.5%); business and financial operations occupations (12.7%); management occupations (except farmers) (12.4%); computer and mathematical occupations (7.8%); arts, design, entertainment, sports, and media occupations (6.9%); production occupations (6.6%)
Most popular occupations of females: service occupations (27.9%); sales and office occupations (17.1%); management occupations (except farmers) (12.9%); healthcare practitioners and technical occupations (10.4%); business and financial operations occupations (9.3%); legal occupations (4.9%); arts, design, entertainment, sports, and media occupations (4.8%)
Limited-access highways (interstate or state) in this neighborhood: US Hwy 52 (US Hwy 12, I- 94, I- 35); I- 94 (US Hwy 12, US Hwy 52).
Highways in this neighborhood: 7th St S (State Hwy 55); State Hwy 55 (8th St S); State Hwy 55; State Hwy 65.
Roads and streets: E 15th St; Portland Ave S (Co Rd 35); E 17th St; E 14th St; Chicago Ave S; Park Ave N (Co Rd 33); 9th St S; 11th Ave S; E 16th St; 10th St S; 5th Ave S; Elliot Ave S; 13th Ave S; Park Ave S (Co Rd 33); 6th St S; S 5th St; 11th St S; 10th Ave S; Centennial Pl; 12th Ave S; 9th Ave S; E Grant St; 7th Ave S.
Elliot Park neighborhood detailed profile
Ericsson neighborhood in Minneapolis statistics: (Find on map)
Area: 0.910 square miles
Population: 3,778
Population density:
Median household income in 2021:
Median rent in in 2021:
Male vs Females
Median age
Housing prices:
Average estimated value of detached houses in 2021 (86.0% of all units):
Average estimated value of townhouses or other attached units in 2021 (2.5% of all units):
Average estimated '21 value of housing units in 5-or-more-unit structures (37.7% of all units):
Most popular occupations of males: education, training, and library occupations (15.7%); management occupations (except farmers) (12.6%); computer and mathematical occupations (11.9%); service occupations (11.2%); architecture and engineering occupations (9.6%); healthcare practitioners and technical occupations (7.7%); sales and office occupations (7.2%)
Most popular occupations of females: sales and office occupations (16.2%); education, training, and library occupations (14.6%); business and financial operations occupations (14.2%); service occupations (12.2%); management occupations (except farmers) (11.9%); healthcare practitioners and technical occupations (11.6%); arts, design, entertainment, sports, and media occupations (4.5%)
Highways in this neighborhood: State Hwy 55 (Hiawatha Ave).
Roads and streets: E Minnehaha Pkwy; E 46th St; E 44th St; E 45th St; 29th Ave S; Longfellow Ave S; Nokomis Ave S; 34th Ave S; 30th Ave S; E 47th St; 31st Ave S; E 43rd St; 33rd Ave S; 32nd Ave S; Co Rd 54 (28th Ave); 35th Ave S; 36th Ave S; Crosby Pl; 38th Ave S; 27th Ave S; 37th Ave S.
Other features: Minnehaha Crk.
Ericsson neighborhood detailed profile
Area: 0.910 square miles
Population: 3,778
Population density:
| Ericsson: | 4,151 people per square mile |
| Minneapolis: | 7,749 people per square mile |
Median household income in 2021:
| Ericsson: | $89,005 |
| Minneapolis: | $69,397 |
Median rent in in 2021:
| Ericsson: | $1,295 |
| Minneapolis: | $1,138 |
Male vs Females
| Males: | 1,985 |
| Females: | 1,793 |
Median age
| Males: | 39.4 years |
| Females: | 42.3 years |
Housing prices:
Average estimated value of detached houses in 2021 (86.0% of all units):
| Ericsson: | $317,080 |
| Minneapolis: | $398,431 |
Average estimated value of townhouses or other attached units in 2021 (2.5% of all units):
| This neighborhood: | $296,875 |
| city: | $376,360 |
Average estimated '21 value of housing units in 5-or-more-unit structures (37.7% of all units):
| Ericsson: | $57,954 |
| Minneapolis: | $317,891 |
Most popular occupations of males: education, training, and library occupations (15.7%); management occupations (except farmers) (12.6%); computer and mathematical occupations (11.9%); service occupations (11.2%); architecture and engineering occupations (9.6%); healthcare practitioners and technical occupations (7.7%); sales and office occupations (7.2%)
Most popular occupations of females: sales and office occupations (16.2%); education, training, and library occupations (14.6%); business and financial operations occupations (14.2%); service occupations (12.2%); management occupations (except farmers) (11.9%); healthcare practitioners and technical occupations (11.6%); arts, design, entertainment, sports, and media occupations (4.5%)
Highways in this neighborhood: State Hwy 55 (Hiawatha Ave).
Roads and streets: E Minnehaha Pkwy; E 46th St; E 44th St; E 45th St; 29th Ave S; Longfellow Ave S; Nokomis Ave S; 34th Ave S; 30th Ave S; E 47th St; 31st Ave S; E 43rd St; 33rd Ave S; 32nd Ave S; Co Rd 54 (28th Ave); 35th Ave S; 36th Ave S; Crosby Pl; 38th Ave S; 27th Ave S; 37th Ave S.
Other features: Minnehaha Crk.
Ericsson neighborhood detailed profile
Field neighborhood in Minneapolis statistics: (Find on map)
Area: 0.346 square miles
Population: 2,459
Population density:
Median household income in 2021:
Median rent in in 2021:
Male vs Females
Median age
Average estimated value of detached houses in 2021 (94.3% of all units):
Most popular occupations of males: sales and office occupations (48.2%); service occupations (9.9%); production occupations (8.5%); management occupations (except farmers) (7.0%); education, training, and library occupations (5.2%); transportation occupations (4.8%); business and financial operations occupations (4.7%)
Most popular occupations of females: sales and office occupations (24.0%); healthcare practitioners and technical occupations (20.0%); service occupations (13.1%); management occupations (except farmers) (9.7%); education, training, and library occupations (8.6%); community and social services occupations (7.4%); business and financial operations occupations (5.5%)
Roads and streets: E Minnehaha Pkwy; E 49th St; E 48th St; E 47th St; 2nd Ave S; 3rd Ave S; Columbus Ave S; Chicago Ave S; E 50th St; Park Ave S (Co Rd 33); Clinton Ave S; 4th Ave S; Co Rd 35 (Portland Ave S); 5th Ave S; Oakland Ave S.
Other features: Minnehaha Crk.
Field neighborhood detailed profile
Area: 0.346 square miles
Population: 2,459
Population density:
| Field: | 7,100 people per square mile |
| Minneapolis: | 7,749 people per square mile |
Median household income in 2021:
| Field: | $133,187 |
| Minneapolis: | $69,397 |
Median rent in in 2021:
| Field: | $1,114 |
| Minneapolis: | $1,138 |
Male vs Females
| Males: | 1,137 |
| Females: | 1,321 |
Median age
| Males: | 41.4 years |
| Females: | 38.5 years |
Average estimated value of detached houses in 2021 (94.3% of all units):
| Field: | $314,711 |
| Minneapolis: | $398,431 |
Most popular occupations of males: sales and office occupations (48.2%); service occupations (9.9%); production occupations (8.5%); management occupations (except farmers) (7.0%); education, training, and library occupations (5.2%); transportation occupations (4.8%); business and financial operations occupations (4.7%)
Most popular occupations of females: sales and office occupations (24.0%); healthcare practitioners and technical occupations (20.0%); service occupations (13.1%); management occupations (except farmers) (9.7%); education, training, and library occupations (8.6%); community and social services occupations (7.4%); business and financial operations occupations (5.5%)
Roads and streets: E Minnehaha Pkwy; E 49th St; E 48th St; E 47th St; 2nd Ave S; 3rd Ave S; Columbus Ave S; Chicago Ave S; E 50th St; Park Ave S (Co Rd 33); Clinton Ave S; 4th Ave S; Co Rd 35 (Portland Ave S); 5th Ave S; Oakland Ave S.
Other features: Minnehaha Crk.
Field neighborhood detailed profile
Folwell neighborhood in Minneapolis statistics: (Find on map)
Area: 0.556 square miles
Population: 6,004
Population density:
Median household income in 2021:
Median rent in in 2021:
Male vs Females
Median age
Average estimated value of detached houses in 2021 (82.3% of all units):
Most popular occupations of males: material moving occupations (19.2%); service occupations (15.4%); computer and mathematical occupations (13.5%); sales and office occupations (13.4%); management occupations (except farmers) (10.6%); construction, extraction, and maintenance occupations (3.6%); architecture and engineering occupations (3.3%)
Most popular occupations of females: sales and office occupations (28.9%); education, training, and library occupations (15.9%); service occupations (10.3%); healthcare practitioners and technical occupations (9.9%); management occupations (except farmers) (9.0%); life, physical, and social science occupations (4.9%); farming, fishing, and forestry occupations (4.2%)
Roads and streets: 36th Ave N; 34th Ave N; 33rd Ave N; 35th Ave N; Lowry Ave N (Co Rd 153); 37th Ave N; Morgan Ave N; Newton Ave N; Humboldt Ave N; Fremont Ave N; Knox Ave N; Logan Ave N; Girard Ave N; Oliver Ave N; Emerson Ave N; James Ave N; Irving Ave N; Dupont Ave N.
Folwell neighborhood detailed profile
Area: 0.556 square miles
Population: 6,004
Population density:
| Folwell: | 10,792 people per square mile |
| Minneapolis: | 7,749 people per square mile |
Median household income in 2021:
| Folwell: | $63,258 |
| Minneapolis: | $69,397 |
Median rent in in 2021:
| Folwell: | $1,211 |
| Minneapolis: | $1,138 |
Male vs Females
| Males: | 3,090 |
| Females: | 2,914 |
Median age
| Males: | 31.8 years |
| Females: | 32.8 years |
Average estimated value of detached houses in 2021 (82.3% of all units):
| Folwell: | $234,378 |
| Minneapolis: | $398,431 |
Most popular occupations of males: material moving occupations (19.2%); service occupations (15.4%); computer and mathematical occupations (13.5%); sales and office occupations (13.4%); management occupations (except farmers) (10.6%); construction, extraction, and maintenance occupations (3.6%); architecture and engineering occupations (3.3%)
Most popular occupations of females: sales and office occupations (28.9%); education, training, and library occupations (15.9%); service occupations (10.3%); healthcare practitioners and technical occupations (9.9%); management occupations (except farmers) (9.0%); life, physical, and social science occupations (4.9%); farming, fishing, and forestry occupations (4.2%)
Roads and streets: 36th Ave N; 34th Ave N; 33rd Ave N; 35th Ave N; Lowry Ave N (Co Rd 153); 37th Ave N; Morgan Ave N; Newton Ave N; Humboldt Ave N; Fremont Ave N; Knox Ave N; Logan Ave N; Girard Ave N; Oliver Ave N; Emerson Ave N; James Ave N; Irving Ave N; Dupont Ave N.
Folwell neighborhood detailed profile
Fulton neighborhood in Minneapolis statistics: (Find on map)
Area: 0.877 square miles
Population: 6,917
Population density:
Median household income in 2021:
Median rent in in 2021:
Male vs Females
Median age
Housing prices:
Average estimated value of detached houses in 2021 (87.1% of all units):
Average estimated value of townhouses or other attached units in 2021 (4.7% of all units):
Average estimated '21 value of housing units in 5-or-more-unit structures (8.6% of all units):
Most popular occupations of males: management occupations (except farmers) (24.1%); sales and office occupations (14.0%); business and financial operations occupations (13.3%); architecture and engineering occupations (9.7%); healthcare practitioners and technical occupations (8.1%); legal occupations (5.7%); computer and mathematical occupations (4.5%)
Most popular occupations of females: sales and office occupations (18.9%); management occupations (except farmers) (14.8%); education, training, and library occupations (13.0%); business and financial operations occupations (11.3%); service occupations (9.3%); arts, design, entertainment, sports, and media occupations (8.3%); healthcare practitioners and technical occupations (8.1%)
Roads and streets: W 54th St; W 51st St; W 52nd St; W 50th St; W 49th St; W 53rd St; W 48th St; Upton Ave S; Xerxes Ave (Co Rd 31); Zenith Ave S; Drew Ave S; York Ave S; Washburn Ave S; Vincent Ave S; Ewing Ave S; Chowen Ave S; Penn Ave S (Co Rd 32); Russell Ave S; Thomas Ave S; Abbott Ave S; Beard Ave S; Sheridan Ave S; Queen Ave S; Forestdale Rd; W 47th St; W Lake Harriet Pkwy; Cromwell Dr; Brookwood Ter; Red Cedar Ln; Russell Ct; Cromwell Ct.
Other features: Minnehaha Crk.
Fulton neighborhood detailed profile
Area: 0.877 square miles
Population: 6,917
Population density:
| Fulton: | 7,888 people per square mile |
| Minneapolis: | 7,749 people per square mile |
Median household income in 2021:
| Fulton: | $152,297 |
| Minneapolis: | $69,397 |
Median rent in in 2021:
| Fulton: | $1,377 |
| Minneapolis: | $1,138 |
Male vs Females
| Males: | 3,531 |
| Females: | 3,386 |
Median age
| Males: | 41.8 years |
| Females: | 40.5 years |
Housing prices:
Average estimated value of detached houses in 2021 (87.1% of all units):
| Fulton: | $487,954 |
| Minneapolis: | $398,431 |
Average estimated value of townhouses or other attached units in 2021 (4.7% of all units):
| This neighborhood: | $969,149 |
| city: | $376,360 |
Average estimated '21 value of housing units in 5-or-more-unit structures (8.6% of all units):
| Fulton: | $813,101 |
| Minneapolis: | $317,891 |
Most popular occupations of males: management occupations (except farmers) (24.1%); sales and office occupations (14.0%); business and financial operations occupations (13.3%); architecture and engineering occupations (9.7%); healthcare practitioners and technical occupations (8.1%); legal occupations (5.7%); computer and mathematical occupations (4.5%)
Most popular occupations of females: sales and office occupations (18.9%); management occupations (except farmers) (14.8%); education, training, and library occupations (13.0%); business and financial operations occupations (11.3%); service occupations (9.3%); arts, design, entertainment, sports, and media occupations (8.3%); healthcare practitioners and technical occupations (8.1%)
Roads and streets: W 54th St; W 51st St; W 52nd St; W 50th St; W 49th St; W 53rd St; W 48th St; Upton Ave S; Xerxes Ave (Co Rd 31); Zenith Ave S; Drew Ave S; York Ave S; Washburn Ave S; Vincent Ave S; Ewing Ave S; Chowen Ave S; Penn Ave S (Co Rd 32); Russell Ave S; Thomas Ave S; Abbott Ave S; Beard Ave S; Sheridan Ave S; Queen Ave S; Forestdale Rd; W 47th St; W Lake Harriet Pkwy; Cromwell Dr; Brookwood Ter; Red Cedar Ln; Russell Ct; Cromwell Ct.
Other features: Minnehaha Crk.
Fulton neighborhood detailed profile
Greater Central neighborhood in Minneapolis statistics: (Find on map)
Area: 3.024 square miles
Population: 33,813
Population density:
Median household income in 2021:
Median rent in in 2021:
Male vs Females
Median age
Housing prices:
Average estimated value of detached houses in 2021 (3.5% of all units):
Average estimated value of townhouses or other attached units in 2021 (6.9% of all units):
Average estimated value of housing units in 2-unit structures in 2021 (2.2% of all units):
Average estimated '21 value of housing units in 3-to-4-unit structures (3.6% of all units):
Average estimated '21 value of housing units in 5-or-more-unit structures (46.1% of all units):
Most popular occupations of males: service occupations (19.4%); sales and office occupations (14.9%); business and financial operations occupations (13.5%); management occupations (except farmers) (11.3%); computer and mathematical occupations (11.0%); production occupations (5.6%); transportation occupations (5.2%)
Most popular occupations of females: service occupations (23.0%); sales and office occupations (17.6%); management occupations (except farmers) (15.4%); business and financial operations occupations (12.1%); healthcare practitioners and technical occupations (7.5%); education, training, and library occupations (5.0%); arts, design, entertainment, sports, and media occupations (4.0%)
Limited-access highways (interstate or state) in this neighborhood: US Hwy 52 (I- 94, US Hwy 12); I- 35 (State Hwy 65); I- 394.
Highways in this neighborhood: State Hwy 55 (7th St S); 10th St S (State Hwy 55); State Hwy 65; 10th St N (State Hwy 55); State Hwy 55; State Hwy 122.
Roads and streets: W River Pkwy; 4th St S; Hennepin Ave; 3rd Ave S; Co Rd 52 (Nicollet Ave); 6th St S; 8th St S; S 5th St; Washington Ave S; E 15th St; 2nd Ave S; 9th St S; 5th St N; Portland Ave S (Co Rd 35); 3rd St S; Marquette Ave (Marquette Ave S); 4th Ave S; 5th Ave S; Lasalle Ave; N 7th St; E 14th St; E 17th St; Washington Ave N; N 2nd St; 3rd St N; 11th St S; E 16th St; 11th Ave S; N 4th St; 1st Ave N; Chicago Ave S; Park Ave N (Co Rd 33); 3rd Ave N; Glenwood Ave; 1st St N; 2nd Ave N; Groveland Ave; 12th St S (Harmon Ct); 2nd St S; W 15th St; 6th Ave N; Co Rd 5 (W Franklin Ave); Lakeside Ave; Oak Grove St; S 2nd St; 10th Ave S; Harmon Pl; 1st St S; E 18th St; E 19th St; 10th Ave N; 1st Ave S; 5th Ave N; 12th Ave S; 4th Ave N; Co Rd 5 (E Franklin Ave); 12th Ave N; 7th Ave N; Royalston Ave N; 13th St S; Spruce Pl; 13th Ave S; Clinton Ave S; Currie Ave (Currie Ave W); 6th St N; Olson Memorial Hwy; 9th Ave S; Clifton Ave; Linden Ave W; N 8th Ave; 8th Ave N; E Grant St; 12th St N; River St; 11th St N; 4th St N; Border Ave; Yale Pl; W 14th St; W Grant St; Willow St S; Elliot Ave S; Hawthorne Ave; Laurel Ave W; Olson Hwy Svc Rd; Stevens Ave S; Chestnut Ave; 16th St N; Park Ave S (Co Rd 33); 9th St N; Hawthorne Ave W; Azine Way; S 3rd St; 15th St N; Ridgewood Ave; Napco Ave; Oak Lake Ave; Holden St N; 11th Ave N; I- 94 Svc Rd; Clifton Pl; Bradford Ave; N 6th Ave; Hoag Ave; 8th St N; Pillsbury Ave S; 9th Ave N; Service Rd; 17th St N; Centennial Pl; Kirby Puckett Pl; Maple St S; 13th St N; Pleasant Ave; Blaisdell Ave S; Norm McGrew Pl; Dunwoody Blvd; High St S; Greenway Gables; Dell Pl; 7th Ave S.
Railroad features: Burlington Northern Santa Fe Rlwy; Union Pacific RR (Burlington Northern Santa Fe Rlwy).
Other features: Bassett Crk.
Greater Central neighborhood detailed profile
Area: 3.024 square miles
Population: 33,813
Population density:
| Greater Central: | 11,180 people per square mile |
| Minneapolis: | 7,749 people per square mile |
Median household income in 2021:
| Greater Central: | $44,996 |
| Minneapolis: | $69,397 |
Median rent in in 2021:
| Greater Central: | $863 |
| Minneapolis: | $1,138 |
Male vs Females
| Males: | 19,435 |
| Females: | 14,377 |
Median age
| Males: | 36.2 years |
| Females: | 34.9 years |
Housing prices:
Average estimated value of detached houses in 2021 (3.5% of all units):
| Greater Central: | $498,683 |
| Minneapolis: | $398,431 |
Average estimated value of townhouses or other attached units in 2021 (6.9% of all units):
| This neighborhood: | $735,433 |
| city: | $376,360 |
Average estimated value of housing units in 2-unit structures in 2021 (2.2% of all units):
| This neighborhood: | $739,425 |
| Minneapolis: | $353,466 |
Average estimated '21 value of housing units in 3-to-4-unit structures (3.6% of all units):
| Greater Central: | $250,315 |
| city: | $335,939 |
Average estimated '21 value of housing units in 5-or-more-unit structures (46.1% of all units):
| Greater Central: | $146,340 |
| Minneapolis: | $317,891 |
Most popular occupations of males: service occupations (19.4%); sales and office occupations (14.9%); business and financial operations occupations (13.5%); management occupations (except farmers) (11.3%); computer and mathematical occupations (11.0%); production occupations (5.6%); transportation occupations (5.2%)
Most popular occupations of females: service occupations (23.0%); sales and office occupations (17.6%); management occupations (except farmers) (15.4%); business and financial operations occupations (12.1%); healthcare practitioners and technical occupations (7.5%); education, training, and library occupations (5.0%); arts, design, entertainment, sports, and media occupations (4.0%)
Limited-access highways (interstate or state) in this neighborhood: US Hwy 52 (I- 94, US Hwy 12); I- 35 (State Hwy 65); I- 394.
Highways in this neighborhood: State Hwy 55 (7th St S); 10th St S (State Hwy 55); State Hwy 65; 10th St N (State Hwy 55); State Hwy 55; State Hwy 122.
Roads and streets: W River Pkwy; 4th St S; Hennepin Ave; 3rd Ave S; Co Rd 52 (Nicollet Ave); 6th St S; 8th St S; S 5th St; Washington Ave S; E 15th St; 2nd Ave S; 9th St S; 5th St N; Portland Ave S (Co Rd 35); 3rd St S; Marquette Ave (Marquette Ave S); 4th Ave S; 5th Ave S; Lasalle Ave; N 7th St; E 14th St; E 17th St; Washington Ave N; N 2nd St; 3rd St N; 11th St S; E 16th St; 11th Ave S; N 4th St; 1st Ave N; Chicago Ave S; Park Ave N (Co Rd 33); 3rd Ave N; Glenwood Ave; 1st St N; 2nd Ave N; Groveland Ave; 12th St S (Harmon Ct); 2nd St S; W 15th St; 6th Ave N; Co Rd 5 (W Franklin Ave); Lakeside Ave; Oak Grove St; S 2nd St; 10th Ave S; Harmon Pl; 1st St S; E 18th St; E 19th St; 10th Ave N; 1st Ave S; 5th Ave N; 12th Ave S; 4th Ave N; Co Rd 5 (E Franklin Ave); 12th Ave N; 7th Ave N; Royalston Ave N; 13th St S; Spruce Pl; 13th Ave S; Clinton Ave S; Currie Ave (Currie Ave W); 6th St N; Olson Memorial Hwy; 9th Ave S; Clifton Ave; Linden Ave W; N 8th Ave; 8th Ave N; E Grant St; 12th St N; River St; 11th St N; 4th St N; Border Ave; Yale Pl; W 14th St; W Grant St; Willow St S; Elliot Ave S; Hawthorne Ave; Laurel Ave W; Olson Hwy Svc Rd; Stevens Ave S; Chestnut Ave; 16th St N; Park Ave S (Co Rd 33); 9th St N; Hawthorne Ave W; Azine Way; S 3rd St; 15th St N; Ridgewood Ave; Napco Ave; Oak Lake Ave; Holden St N; 11th Ave N; I- 94 Svc Rd; Clifton Pl; Bradford Ave; N 6th Ave; Hoag Ave; 8th St N; Pillsbury Ave S; 9th Ave N; Service Rd; 17th St N; Centennial Pl; Kirby Puckett Pl; Maple St S; 13th St N; Pleasant Ave; Blaisdell Ave S; Norm McGrew Pl; Dunwoody Blvd; High St S; Greenway Gables; Dell Pl; 7th Ave S.
Railroad features: Burlington Northern Santa Fe Rlwy; Union Pacific RR (Burlington Northern Santa Fe Rlwy).
Other features: Bassett Crk.
Greater Central neighborhood detailed profile
Greater Longfellow neighborhood in Minneapolis statistics: (Find on map)
Area: 4.962 square miles
Population: 32,818
Population density:
Median household income in 2021:
Median rent in in 2021:
Male vs Females
Median age
Housing prices:
Average estimated value of detached houses in 2021 (57.4% of all units):
Average estimated value of townhouses or other attached units in 2021 (4.9% of all units):
Average estimated value of housing units in 2-unit structures in 2021 (11.8% of all units):
Average estimated '21 value of housing units in 5-or-more-unit structures (36.6% of all units):
Most popular occupations of males: service occupations (15.6%); sales and office occupations (13.1%); management occupations (except farmers) (10.9%); computer and mathematical occupations (7.9%); business and financial operations occupations (7.2%); production occupations (7.2%); education, training, and library occupations (6.5%)
Most popular occupations of females: sales and office occupations (22.8%); service occupations (15.6%); education, training, and library occupations (11.4%); healthcare practitioners and technical occupations (10.5%); management occupations (except farmers) (9.9%); business and financial operations occupations (8.6%); community and social services occupations (5.1%)
Roads and streets: Minnehaha Ave; W River Pkwy; 42nd Ave S; Snelling Ave S; E Lake St; 41st Ave S; 40th Ave S; 46th Ave S; 44th Ave S; 43rd Ave S; E 32nd St; 45th Ave S; 39th Ave S; E 33rd St; 38th Ave S; 36th Ave S; E 34th St; 37th Ave S; E 29th St; E 31st St; E 26th St; 35th Ave S; E 35th St; Co Rd 5 (E Franklin Ave); E 38th St (Co Rd 38); E 24th St; 31st Ave S; E 37th St; E 36th St; 33rd Ave S; 34th Ave S; E 28th St; 30th Ave S; E 25th St; 32nd Ave S; 29th Ave S; E 42nd St; Dight Ave; E 22nd St; E 39th St; Co Rd 48 (27th Ave S); E 40th St; E 41st St; 47th Ave S; 26th Ave S; E 44th St; E 27th St; E 45th St; E 43rd St; Edmund Blvd S; Edmund Blvd; Seabury Ave S; Co Rd 54 (28th Ave); Dorman Ave S; S 9th St; E 46th St; Godfrey Rd; Nawadaha Blvd; 48th Ave S; 24th Ave S; 25th Ave S; Ford Pkwy; 23rd Ave S; 22nd Ave S; 9th St S; Cedar Ave S; Minneapolis Ave S; Folwell Dr; Dowling St; 21st Ave S; Milwaukee Ave S; Northrop Dr; Coffey Ln; Evergreen Dr; Morrill Ln; Riverside Ave; Park Ter; 19th Ave S; Coffman Ln; Burton Ln; Snelling Ave; Franklin Ter; 20th Ave S; E Minnehaha Pkwy; Pautz St; Isabel Ave; E 50th St; Glabe Ln; Milwaukee Ave Exd; Riverside Pkwy.
Railroad features: Minnesota Commercial RR.
Other features: Minnehaha Crk.
Greater Longfellow neighborhood detailed profile
Area: 4.962 square miles
Population: 32,818
Population density:
| Greater Longfellow: | 6,614 people per square mile |
| Minneapolis: | 7,749 people per square mile |
Median household income in 2021:
| Greater Longfellow: | $78,514 |
| Minneapolis: | $69,397 |
Median rent in in 2021:
| Greater Longfellow: | $1,052 |
| Minneapolis: | $1,138 |
Male vs Females
| Males: | 16,345 |
| Females: | 16,472 |
Median age
| Males: | 41.1 years |
| Females: | 44.1 years |
Housing prices:
Average estimated value of detached houses in 2021 (57.4% of all units):
| Greater Longfellow: | $254,566 |
| Minneapolis: | $398,431 |
Average estimated value of townhouses or other attached units in 2021 (4.9% of all units):
| This neighborhood: | $286,419 |
| city: | $376,360 |
Average estimated value of housing units in 2-unit structures in 2021 (11.8% of all units):
| This neighborhood: | $253,274 |
| Minneapolis: | $353,466 |
Average estimated '21 value of housing units in 5-or-more-unit structures (36.6% of all units):
| Greater Longfellow: | $257,940 |
| Minneapolis: | $317,891 |
Most popular occupations of males: service occupations (15.6%); sales and office occupations (13.1%); management occupations (except farmers) (10.9%); computer and mathematical occupations (7.9%); business and financial operations occupations (7.2%); production occupations (7.2%); education, training, and library occupations (6.5%)
Most popular occupations of females: sales and office occupations (22.8%); service occupations (15.6%); education, training, and library occupations (11.4%); healthcare practitioners and technical occupations (10.5%); management occupations (except farmers) (9.9%); business and financial operations occupations (8.6%); community and social services occupations (5.1%)
Roads and streets: Minnehaha Ave; W River Pkwy; 42nd Ave S; Snelling Ave S; E Lake St; 41st Ave S; 40th Ave S; 46th Ave S; 44th Ave S; 43rd Ave S; E 32nd St; 45th Ave S; 39th Ave S; E 33rd St; 38th Ave S; 36th Ave S; E 34th St; 37th Ave S; E 29th St; E 31st St; E 26th St; 35th Ave S; E 35th St; Co Rd 5 (E Franklin Ave); E 38th St (Co Rd 38); E 24th St; 31st Ave S; E 37th St; E 36th St; 33rd Ave S; 34th Ave S; E 28th St; 30th Ave S; E 25th St; 32nd Ave S; 29th Ave S; E 42nd St; Dight Ave; E 22nd St; E 39th St; Co Rd 48 (27th Ave S); E 40th St; E 41st St; 47th Ave S; 26th Ave S; E 44th St; E 27th St; E 45th St; E 43rd St; Edmund Blvd S; Edmund Blvd; Seabury Ave S; Co Rd 54 (28th Ave); Dorman Ave S; S 9th St; E 46th St; Godfrey Rd; Nawadaha Blvd; 48th Ave S; 24th Ave S; 25th Ave S; Ford Pkwy; 23rd Ave S; 22nd Ave S; 9th St S; Cedar Ave S; Minneapolis Ave S; Folwell Dr; Dowling St; 21st Ave S; Milwaukee Ave S; Northrop Dr; Coffey Ln; Evergreen Dr; Morrill Ln; Riverside Ave; Park Ter; 19th Ave S; Coffman Ln; Burton Ln; Snelling Ave; Franklin Ter; 20th Ave S; E Minnehaha Pkwy; Pautz St; Isabel Ave; E 50th St; Glabe Ln; Milwaukee Ave Exd; Riverside Pkwy.
Railroad features: Minnesota Commercial RR.
Other features: Minnehaha Crk.
Greater Longfellow neighborhood detailed profile
Greater Near North neighborhood in Minneapolis statistics: (Find on map)
Area: 4.602 square miles
Population: 42,751
Population density:
Median household income in 2021:
Median rent in in 2021:
Male vs Females
Median age
Housing prices:
Average estimated value of detached houses in 2021 (48.4% of all units):
Average estimated value of townhouses or other attached units in 2021 (6.6% of all units):
Average estimated value of housing units in 2-unit structures in 2021 (15.7% of all units):
Average estimated '21 value of housing units in 5-or-more-unit structures (35.5% of all units):
Most popular occupations of males: service occupations (20.0%); sales and office occupations (16.8%); production occupations (11.7%); management occupations (except farmers) (9.5%); transportation occupations (6.7%); material moving occupations (5.8%); business and financial operations occupations (5.6%)
Most popular occupations of females: service occupations (32.2%); sales and office occupations (19.8%); education, training, and library occupations (10.3%); management occupations (except farmers) (7.6%); production occupations (6.7%); healthcare practitioners and technical occupations (6.6%); material moving occupations (3.9%)
Limited-access highways (interstate or state) in this neighborhood: I- 94 (US Hwy 52).
Highways in this neighborhood: Olson Memorial Hwy (State Hwy 55).
Roads and streets: Co Rd 81 (W Broadway Ave); Plymouth Ave N; 26th Ave N; 30th Ave N; 27th Ave N; 29th Ave N; Lyndale Ave N; 16th Ave N; 14th Ave N; James Ave N; Co Rd 2 (Penn Ave N); 23rd Ave N; Irving Ave N; 21st Ave N; Morgan Ave N; Queen Ave N; Logan Ave N; Sheridan Ave N; Dupont Ave N; Thomas Ave N; Bryant Ave N; 17th Ave N; 24th Ave N; Newton Ave N; Upton Ave N; Vincent Ave N; Oliver Ave N; Russell Ave N; 25th Ave N; Aldrich Ave N; 22nd Ave N; Glenwood Ave; 8th Ave N; Fremont Ave N; 12th Ave N; 2nd Ave N; N Emerson Ave; Girard Ave N; Humboldt Ave N; Washington Ave N; N 2nd St; Golden Valley Rd; 18th Ave N; 15th Ave N; Oak Park Ave N; 5th Ave N; 4th Ave N; Knox Ave N; 31st Ave N; Washburn Ave N; N 4th St; N 3rd St; W River Rd N; McNair Ave N; 6th St N; Elwood Ave N; 11th Ave N; 28th Ave N; Colfax Ave N; N 7th St; Hillside Ave N; 3rd Ave N; N Theodore Wirth Pkwy; Ilion Ave N; N Cedar Lake Rd; N Pacific St; Emerson Ave N; Farwell Ave; Currie Ave W; Girard Ter; 7th Ave N; 1st 1/2 Ave N; N Willow Ave; Service Rd; Inglewood Ave N; Ferrant Pl; Lowry Ave N (Co Rd 153); Gramercy Ave; Hall Ln; 18th 1/2 Ave N; Thomas Pl N; 3rd St N; Boardwalk Ave; Barnes Pl; Hall Curve; Ojibway St N; Lyn-Park Ave N; Harry Davis Ln; 13th Ave N; 19th Ave N; Dakota Cir; Banneker Ave N; Olson Hwy Svc Rd; Lyn-Curve Ave N; Farwell Pl; Heaner Ter N; Chestnut Ave W; 12th 1/2 Ave N; Olson Highway Svc Rd (6th Ave N); Walton Pl; N 6th St S; Skyline Curve Ave; Lyn-Park Cir N; Lyn-Park Ln N; Market St; Boardwalk Pl; 5th St N; Smith Cir; Howell Dr N; New York Ave N; Givens Ln; Elizabeth Ln; Printice Ln (Prentice Ln); N Knox Ave N; Lyndale Pl; State Hwy 55 Svc Rd; Rawlins Cir N; Mill St; Plymouth Ave NE; Van White Ln.
Railroad features: Burlington Northern Santa Fe Rlwy; Canadian Pacific Rlwy; Burlington Northern Santa Fe Rlwy (Union Pacific RR).
Other features: Bassett Crk.
Greater Near North neighborhood detailed profile
Area: 4.602 square miles
Population: 42,751
Population density:
| Greater Near North: | 9,289 people per square mile |
| Minneapolis: | 7,749 people per square mile |
Median household income in 2021:
| Greater Near North: | $56,897 |
| Minneapolis: | $69,397 |
Median rent in in 2021:
| Greater Near North: | $955 |
| Minneapolis: | $1,138 |
Male vs Females
| Males: | 21,353 |
| Females: | 21,397 |
Median age
| Males: | 29.7 years |
| Females: | 31.0 years |
Housing prices:
Average estimated value of detached houses in 2021 (48.4% of all units):
| Greater Near North: | $181,968 |
| Minneapolis: | $398,431 |
Average estimated value of townhouses or other attached units in 2021 (6.6% of all units):
| This neighborhood: | $216,275 |
| city: | $376,360 |
Average estimated value of housing units in 2-unit structures in 2021 (15.7% of all units):
| This neighborhood: | $298,296 |
| Minneapolis: | $353,466 |
Average estimated '21 value of housing units in 5-or-more-unit structures (35.5% of all units):
| Greater Near North: | $292,750 |
| Minneapolis: | $317,891 |
Most popular occupations of males: service occupations (20.0%); sales and office occupations (16.8%); production occupations (11.7%); management occupations (except farmers) (9.5%); transportation occupations (6.7%); material moving occupations (5.8%); business and financial operations occupations (5.6%)
Most popular occupations of females: service occupations (32.2%); sales and office occupations (19.8%); education, training, and library occupations (10.3%); management occupations (except farmers) (7.6%); production occupations (6.7%); healthcare practitioners and technical occupations (6.6%); material moving occupations (3.9%)
Limited-access highways (interstate or state) in this neighborhood: I- 94 (US Hwy 52).
Highways in this neighborhood: Olson Memorial Hwy (State Hwy 55).
Roads and streets: Co Rd 81 (W Broadway Ave); Plymouth Ave N; 26th Ave N; 30th Ave N; 27th Ave N; 29th Ave N; Lyndale Ave N; 16th Ave N; 14th Ave N; James Ave N; Co Rd 2 (Penn Ave N); 23rd Ave N; Irving Ave N; 21st Ave N; Morgan Ave N; Queen Ave N; Logan Ave N; Sheridan Ave N; Dupont Ave N; Thomas Ave N; Bryant Ave N; 17th Ave N; 24th Ave N; Newton Ave N; Upton Ave N; Vincent Ave N; Oliver Ave N; Russell Ave N; 25th Ave N; Aldrich Ave N; 22nd Ave N; Glenwood Ave; 8th Ave N; Fremont Ave N; 12th Ave N; 2nd Ave N; N Emerson Ave; Girard Ave N; Humboldt Ave N; Washington Ave N; N 2nd St; Golden Valley Rd; 18th Ave N; 15th Ave N; Oak Park Ave N; 5th Ave N; 4th Ave N; Knox Ave N; 31st Ave N; Washburn Ave N; N 4th St; N 3rd St; W River Rd N; McNair Ave N; 6th St N; Elwood Ave N; 11th Ave N; 28th Ave N; Colfax Ave N; N 7th St; Hillside Ave N; 3rd Ave N; N Theodore Wirth Pkwy; Ilion Ave N; N Cedar Lake Rd; N Pacific St; Emerson Ave N; Farwell Ave; Currie Ave W; Girard Ter; 7th Ave N; 1st 1/2 Ave N; N Willow Ave; Service Rd; Inglewood Ave N; Ferrant Pl; Lowry Ave N (Co Rd 153); Gramercy Ave; Hall Ln; 18th 1/2 Ave N; Thomas Pl N; 3rd St N; Boardwalk Ave; Barnes Pl; Hall Curve; Ojibway St N; Lyn-Park Ave N; Harry Davis Ln; 13th Ave N; 19th Ave N; Dakota Cir; Banneker Ave N; Olson Hwy Svc Rd; Lyn-Curve Ave N; Farwell Pl; Heaner Ter N; Chestnut Ave W; 12th 1/2 Ave N; Olson Highway Svc Rd (6th Ave N); Walton Pl; N 6th St S; Skyline Curve Ave; Lyn-Park Cir N; Lyn-Park Ln N; Market St; Boardwalk Pl; 5th St N; Smith Cir; Howell Dr N; New York Ave N; Givens Ln; Elizabeth Ln; Printice Ln (Prentice Ln); N Knox Ave N; Lyndale Pl; State Hwy 55 Svc Rd; Rawlins Cir N; Mill St; Plymouth Ave NE; Van White Ln.
Railroad features: Burlington Northern Santa Fe Rlwy; Canadian Pacific Rlwy; Burlington Northern Santa Fe Rlwy (Union Pacific RR).
Other features: Bassett Crk.
Greater Near North neighborhood detailed profile
Hale neighborhood in Minneapolis statistics: (Find on map)
Area: 0.496 square miles
Population: 2,854
Population density:
Median household income in 2021:
Median rent in in 2021:
Male vs Females
Median age
Average estimated value of detached houses in 2021 (89.7% of all units):
Most popular occupations of males: management occupations (except farmers) (20.3%); business and financial operations occupations (16.1%); computer and mathematical occupations (15.0%); healthcare practitioners and technical occupations (8.3%); arts, design, entertainment, sports, and media occupations (7.9%); sales and office occupations (7.9%); service occupations (5.6%)
Most popular occupations of females: management occupations (except farmers) (22.9%); business and financial operations occupations (18.1%); sales and office occupations (16.9%); healthcare practitioners and technical occupations (14.9%); education, training, and library occupations (11.1%); arts, design, entertainment, sports, and media occupations (5.5%); service occupations (3.4%)
Roads and streets: E 51st St; E 52nd St; E 50th St; E 53rd St; E 54th St; 13th Ave S; 14th Ave S; 12th Ave S; 11th Ave S; Elliot Ave S; 10th Ave S; Bloomington Ave S; 16th Ave S; 15th Ave S; W Lake Nokomis Pkwy (W Nokomis Pkwy); 17th Ave S; E 55th St; 18th Ave S; Cedar Ave S; E 49th St; Edgewater Blvd; Chateau Pl.
Hale neighborhood detailed profile
Area: 0.496 square miles
Population: 2,854
Population density:
| Hale: | 5,752 people per square mile |
| Minneapolis: | 7,749 people per square mile |
Median household income in 2021:
| Hale: | $142,606 |
| Minneapolis: | $69,397 |
Median rent in in 2021:
| Hale: | $1,342 |
| Minneapolis: | $1,138 |
Male vs Females
| Males: | 1,364 |
| Females: | 1,490 |
Median age
| Males: | 39.6 years |
| Females: | 41.6 years |
Average estimated value of detached houses in 2021 (89.7% of all units):
| Hale: | $339,944 |
| Minneapolis: | $398,431 |
Most popular occupations of males: management occupations (except farmers) (20.3%); business and financial operations occupations (16.1%); computer and mathematical occupations (15.0%); healthcare practitioners and technical occupations (8.3%); arts, design, entertainment, sports, and media occupations (7.9%); sales and office occupations (7.9%); service occupations (5.6%)
Most popular occupations of females: management occupations (except farmers) (22.9%); business and financial operations occupations (18.1%); sales and office occupations (16.9%); healthcare practitioners and technical occupations (14.9%); education, training, and library occupations (11.1%); arts, design, entertainment, sports, and media occupations (5.5%); service occupations (3.4%)
Roads and streets: E 51st St; E 52nd St; E 50th St; E 53rd St; E 54th St; 13th Ave S; 14th Ave S; 12th Ave S; 11th Ave S; Elliot Ave S; 10th Ave S; Bloomington Ave S; 16th Ave S; 15th Ave S; W Lake Nokomis Pkwy (W Nokomis Pkwy); 17th Ave S; E 55th St; 18th Ave S; Cedar Ave S; E 49th St; Edgewater Blvd; Chateau Pl.
Hale neighborhood detailed profile
Harrison neighborhood in Minneapolis statistics: (Find on map)
Area: 0.522 square miles
Population: 3,197
Population density:
Median household income in 2021:
Median rent in in 2021:
Male vs Females
Median age
Housing prices:
Average estimated value of detached houses in 2021 (33.6% of all units):
Average estimated value of townhouses or other attached units in 2021 (7.4% of all units):
Average estimated '21 value of housing units in 5-or-more-unit structures (15.8% of all units):
Most popular occupations of males: transportation occupations (23.4%); service occupations (15.3%); management occupations (except farmers) (14.9%); computer and mathematical occupations (9.6%); sales and office occupations (9.6%); business and financial operations occupations (8.0%); construction, extraction, and maintenance occupations (6.7%)
Most popular occupations of females: service occupations (28.3%); education, training, and library occupations (17.1%); management occupations (except farmers) (15.0%); sales and office occupations (14.9%); arts, design, entertainment, sports, and media occupations (7.8%); community and social services occupations (4.9%); business and financial operations occupations (4.5%)
Highways in this neighborhood: Olson Memorial Hwy (State Hwy 55).
Roads and streets: 2nd Ave N; Glenwood Ave; 5th Ave N; 4th Ave N; Morgan Ave N; Logan Ave N; 3rd Ave N; Humboldt Ave N; N Cedar Lake Rd; Co Rd 2 (Penn Ave N); Queen Ave N; Currie Ave W; Irving Ave N; Newton Ave N; 1st 1/2 Ave N; Girard Ave N; Russell Ave N; Knox Ave N; Inglewood Ave N; Oliver Ave N; Gramercy Ave; Girard Ter; James Ave N; Lyndale Ave N; Sheridan Ave N; Heaner Ter N; Chestnut Ave W; Aldrich Ave N; Thomas Ave N; Colfax Ave N.
Railroad features: Burlington Northern Santa Fe Rlwy; Burlington Northern Santa Fe Rlwy (Union Pacific RR).
Other features: Bassett Crk.
Harrison neighborhood detailed profile
Area: 0.522 square miles
Population: 3,197
Population density:
| Harrison: | 6,129 people per square mile |
| Minneapolis: | 7,749 people per square mile |
Median household income in 2021:
| Harrison: | $71,277 |
| Minneapolis: | $69,397 |
Median rent in in 2021:
| Harrison: | $1,273 |
| Minneapolis: | $1,138 |
Male vs Females
| Males: | 1,690 |
| Females: | 1,506 |
Median age
| Males: | 31.4 years |
| Females: | 35.4 years |
Housing prices:
Average estimated value of detached houses in 2021 (33.6% of all units):
| Harrison: | $142,253 |
| Minneapolis: | $398,431 |
Average estimated value of townhouses or other attached units in 2021 (7.4% of all units):
| This neighborhood: | $252,742 |
| city: | $376,360 |
Average estimated '21 value of housing units in 5-or-more-unit structures (15.8% of all units):
| Harrison: | $292,750 |
| Minneapolis: | $317,891 |
Most popular occupations of males: transportation occupations (23.4%); service occupations (15.3%); management occupations (except farmers) (14.9%); computer and mathematical occupations (9.6%); sales and office occupations (9.6%); business and financial operations occupations (8.0%); construction, extraction, and maintenance occupations (6.7%)
Most popular occupations of females: service occupations (28.3%); education, training, and library occupations (17.1%); management occupations (except farmers) (15.0%); sales and office occupations (14.9%); arts, design, entertainment, sports, and media occupations (7.8%); community and social services occupations (4.9%); business and financial operations occupations (4.5%)
Highways in this neighborhood: Olson Memorial Hwy (State Hwy 55).
Roads and streets: 2nd Ave N; Glenwood Ave; 5th Ave N; 4th Ave N; Morgan Ave N; Logan Ave N; 3rd Ave N; Humboldt Ave N; N Cedar Lake Rd; Co Rd 2 (Penn Ave N); Queen Ave N; Currie Ave W; Irving Ave N; Newton Ave N; 1st 1/2 Ave N; Girard Ave N; Russell Ave N; Knox Ave N; Inglewood Ave N; Oliver Ave N; Gramercy Ave; Girard Ter; James Ave N; Lyndale Ave N; Sheridan Ave N; Heaner Ter N; Chestnut Ave W; Aldrich Ave N; Thomas Ave N; Colfax Ave N.
Railroad features: Burlington Northern Santa Fe Rlwy; Burlington Northern Santa Fe Rlwy (Union Pacific RR).
Other features: Bassett Crk.
Harrison neighborhood detailed profile
Hawthorne neighborhood in Minneapolis statistics: (Find on map)
Area: 0.882 square miles
Population: 7,097
Population density:
Median household income in 2021:
Median rent in in 2021:
Male vs Females
Median age
Housing prices:
Average estimated value of detached houses in 2021 (46.6% of all units):
Average estimated value of townhouses or other attached units in 2021 (1.7% of all units):
Average estimated value of housing units in 2-unit structures in 2021 (21.4% of all units):
Most popular occupations of males: production occupations (23.6%); sales and office occupations (19.2%); service occupations (13.6%); material moving occupations (12.9%); transportation occupations (10.0%); management occupations (except farmers) (5.8%); construction, extraction, and maintenance occupations (5.0%)
Most popular occupations of females: service occupations (34.7%); sales and office occupations (19.3%); healthcare practitioners and technical occupations (11.6%); production occupations (9.7%); management occupations (except farmers) (8.8%); transportation occupations (4.3%); education, training, and library occupations (4.2%)
Limited-access highways (interstate or state) in this neighborhood: US Hwy 52 (I- 94).
Roads and streets: 26th Ave N; 22nd Ave N; 31st Ave N; 30th Ave N; 24th Ave N; 27th Ave N; 23rd Ave N; 21st Ave N; 29th Ave N; Aldrich Ave N; Lyndale Ave N; Dupont Ave N; N 3rd St; N 4th St; Washington Ave N; N 2nd St; Bryant Ave N; 25th Ave N; 28th Ave N; 6th St N; Colfax Ave N; N Pacific St; W River Rd N; Mill St.
Railroad features: Canadian Pacific Rlwy; Burlington Northern Santa Fe Rlwy.
Hawthorne neighborhood detailed profile
Area: 0.882 square miles
Population: 7,097
Population density:
| Hawthorne: | 8,047 people per square mile |
| Minneapolis: | 7,749 people per square mile |
Median household income in 2021:
| Hawthorne: | $49,330 |
| Minneapolis: | $69,397 |
Median rent in in 2021:
| Hawthorne: | $853 |
| Minneapolis: | $1,138 |
Male vs Females
| Males: | 3,621 |
| Females: | 3,475 |
Median age
| Males: | 29.9 years |
| Females: | 27.6 years |
Housing prices:
Average estimated value of detached houses in 2021 (46.6% of all units):
| Hawthorne: | $155,379 |
| Minneapolis: | $398,431 |
Average estimated value of townhouses or other attached units in 2021 (1.7% of all units):
| This neighborhood: | $269,286 |
| city: | $376,360 |
Average estimated value of housing units in 2-unit structures in 2021 (21.4% of all units):
| This neighborhood: | $298,296 |
| Minneapolis: | $353,466 |
Most popular occupations of males: production occupations (23.6%); sales and office occupations (19.2%); service occupations (13.6%); material moving occupations (12.9%); transportation occupations (10.0%); management occupations (except farmers) (5.8%); construction, extraction, and maintenance occupations (5.0%)
Most popular occupations of females: service occupations (34.7%); sales and office occupations (19.3%); healthcare practitioners and technical occupations (11.6%); production occupations (9.7%); management occupations (except farmers) (8.8%); transportation occupations (4.3%); education, training, and library occupations (4.2%)
Limited-access highways (interstate or state) in this neighborhood: US Hwy 52 (I- 94).
Roads and streets: 26th Ave N; 22nd Ave N; 31st Ave N; 30th Ave N; 24th Ave N; 27th Ave N; 23rd Ave N; 21st Ave N; 29th Ave N; Aldrich Ave N; Lyndale Ave N; Dupont Ave N; N 3rd St; N 4th St; Washington Ave N; N 2nd St; Bryant Ave N; 25th Ave N; 28th Ave N; 6th St N; Colfax Ave N; N Pacific St; W River Rd N; Mill St.
Railroad features: Canadian Pacific Rlwy; Burlington Northern Santa Fe Rlwy.
Hawthorne neighborhood detailed profile
Hiawatha neighborhood in Minneapolis statistics: (Find on map)
Area: 1.316 square miles
Population: 7,520
Population density:
Median household income in 2021:
Median rent in in 2021:
Male vs Females
Median age
Housing prices:
Average estimated value of detached houses in 2021 (62.2% of all units):
Average estimated value of townhouses or other attached units in 2021 (4.7% of all units):
Average estimated '21 value of housing units in 5-or-more-unit structures (53.1% of all units):
Most popular occupations of males: sales and office occupations (14.9%); service occupations (13.7%); computer and mathematical occupations (11.0%); production occupations (10.5%); management occupations (except farmers) (9.5%); business and financial operations occupations (7.4%); education, training, and library occupations (6.7%)
Most popular occupations of females: sales and office occupations (19.7%); service occupations (12.7%); business and financial operations occupations (12.2%); healthcare practitioners and technical occupations (10.7%); management occupations (except farmers) (10.4%); education, training, and library occupations (10.0%); arts, design, entertainment, sports, and media occupations (9.4%)
Roads and streets: Co Rd 48 (Minnehaha Ave); E 42nd St; E 41st St; E 44th St; E 45th St; E 43rd St; W River Pkwy; 42nd Ave S; 46th Ave S; E 46th St; 44th Ave S; Snelling Ave S; Godfrey Rd; 45th Ave S; 43rd Ave S; 41st Ave S; Edmund Blvd; Nawadaha Blvd; 40th Ave S; Ford Pkwy; Dight Ave; 39th Ave S; 47th Ave S; Northrop Dr; Folwell Dr; Morrill Ln; Coffman Ln; Burton Ln; 38th Ave S; E Minnehaha Pkwy; E 50th St; 37th Ave S.
Railroad features: Minnesota Commercial RR.
Other features: Minnehaha Crk.
Hiawatha neighborhood detailed profile
Area: 1.316 square miles
Population: 7,520
Population density:
| Hiawatha: | 5,716 people per square mile |
| Minneapolis: | 7,749 people per square mile |
Median household income in 2021:
| Hiawatha: | $85,516 |
| Minneapolis: | $69,397 |
Median rent in in 2021:
| Hiawatha: | $1,381 |
| Minneapolis: | $1,138 |
Male vs Females
| Males: | 3,764 |
| Females: | 3,756 |
Median age
| Males: | 47.3 years |
| Females: | 47.5 years |
Housing prices:
Average estimated value of detached houses in 2021 (62.2% of all units):
| Hiawatha: | $269,561 |
| Minneapolis: | $398,431 |
Average estimated value of townhouses or other attached units in 2021 (4.7% of all units):
| This neighborhood: | $233,923 |
| city: | $376,360 |
Average estimated '21 value of housing units in 5-or-more-unit structures (53.1% of all units):
| Hiawatha: | $257,940 |
| Minneapolis: | $317,891 |
Most popular occupations of males: sales and office occupations (14.9%); service occupations (13.7%); computer and mathematical occupations (11.0%); production occupations (10.5%); management occupations (except farmers) (9.5%); business and financial operations occupations (7.4%); education, training, and library occupations (6.7%)
Most popular occupations of females: sales and office occupations (19.7%); service occupations (12.7%); business and financial operations occupations (12.2%); healthcare practitioners and technical occupations (10.7%); management occupations (except farmers) (10.4%); education, training, and library occupations (10.0%); arts, design, entertainment, sports, and media occupations (9.4%)
Roads and streets: Co Rd 48 (Minnehaha Ave); E 42nd St; E 41st St; E 44th St; E 45th St; E 43rd St; W River Pkwy; 42nd Ave S; 46th Ave S; E 46th St; 44th Ave S; Snelling Ave S; Godfrey Rd; 45th Ave S; 43rd Ave S; 41st Ave S; Edmund Blvd; Nawadaha Blvd; 40th Ave S; Ford Pkwy; Dight Ave; 39th Ave S; 47th Ave S; Northrop Dr; Folwell Dr; Morrill Ln; Coffman Ln; Burton Ln; 38th Ave S; E Minnehaha Pkwy; E 50th St; 37th Ave S.
Railroad features: Minnesota Commercial RR.
Other features: Minnehaha Crk.
Hiawatha neighborhood detailed profile
Holland neighborhood in Minneapolis statistics: (Find on map)
Area: 0.531 square miles
Population: 4,775
Population density:
Median household income in 2021:
Median rent in in 2021:
Male vs Females
Median age
Housing prices:
Average estimated value of detached houses in 2021 (37.6% of all units):
Average estimated value of housing units in 2-unit structures in 2021 (26.6% of all units):
Average estimated '21 value of housing units in 5-or-more-unit structures (8.9% of all units):
Most popular occupations of males: service occupations (19.7%); sales and office occupations (14.2%); management occupations (except farmers) (11.3%); construction, extraction, and maintenance occupations (11.3%); arts, design, entertainment, sports, and media occupations (9.8%); production occupations (7.3%); material moving occupations (4.3%)
Most popular occupations of females: sales and office occupations (20.9%); arts, design, entertainment, sports, and media occupations (20.2%); service occupations (16.8%); management occupations (except farmers) (8.1%); business and financial operations occupations (7.4%); education, training, and library occupations (6.9%); healthcare practitioners and technical occupations (5.6%)
Roads and streets: 22nd Ave NE; Lowry Ave NE (Co Rd 153); 24th Ave NE; 26th Ave NE; 23rd Ave NE; 19th Ave NE; 20th Ave NE; Washington St NE; 5th St NE; 4th St NE; 6th St NE; Monroe St NE; NE Jackson St; Quincy St NE; Jefferson St NE; NE Madison St; NE Howard St; 7th St NE; 18th Ave NE; 17th Ave NE.
Railroad features: Burlington Northern Santa Fe Rlwy; Abandoned RR.
Holland neighborhood detailed profile
Area: 0.531 square miles
Population: 4,775
Population density:
| Holland: | 8,993 people per square mile |
| Minneapolis: | 7,749 people per square mile |
Median household income in 2021:
| Holland: | $71,441 |
| Minneapolis: | $69,397 |
Median rent in in 2021:
| Holland: | $1,087 |
| Minneapolis: | $1,138 |
Male vs Females
| Males: | 2,706 |
| Females: | 2,068 |
Median age
| Males: | 34.0 years |
| Females: | 33.5 years |
Housing prices:
Average estimated value of detached houses in 2021 (37.6% of all units):
| Holland: | $311,609 |
| Minneapolis: | $398,431 |
Average estimated value of housing units in 2-unit structures in 2021 (26.6% of all units):
| This neighborhood: | $285,984 |
| Minneapolis: | $353,466 |
Average estimated '21 value of housing units in 5-or-more-unit structures (8.9% of all units):
| Holland: | $292,857 |
| Minneapolis: | $317,891 |
Most popular occupations of males: service occupations (19.7%); sales and office occupations (14.2%); management occupations (except farmers) (11.3%); construction, extraction, and maintenance occupations (11.3%); arts, design, entertainment, sports, and media occupations (9.8%); production occupations (7.3%); material moving occupations (4.3%)
Most popular occupations of females: sales and office occupations (20.9%); arts, design, entertainment, sports, and media occupations (20.2%); service occupations (16.8%); management occupations (except farmers) (8.1%); business and financial operations occupations (7.4%); education, training, and library occupations (6.9%); healthcare practitioners and technical occupations (5.6%)
Roads and streets: 22nd Ave NE; Lowry Ave NE (Co Rd 153); 24th Ave NE; 26th Ave NE; 23rd Ave NE; 19th Ave NE; 20th Ave NE; Washington St NE; 5th St NE; 4th St NE; 6th St NE; Monroe St NE; NE Jackson St; Quincy St NE; Jefferson St NE; NE Madison St; NE Howard St; 7th St NE; 18th Ave NE; 17th Ave NE.
Railroad features: Burlington Northern Santa Fe Rlwy; Abandoned RR.
Holland neighborhood detailed profile
Howe neighborhood in Minneapolis statistics: (Find on map)
Area: 1.090 square miles
Population: 11,032
Population density:
Median household income in 2021:
Median rent in in 2021:
Male vs Females
Median age
Housing prices:
Average estimated value of detached houses in 2021 (62.9% of all units):
Average estimated value of housing units in 2-unit structures in 2021 (11.5% of all units):
Most popular occupations of males: management occupations (except farmers) (14.6%); service occupations (14.4%); sales and office occupations (13.6%); production occupations (9.0%); transportation occupations (8.7%); business and financial operations occupations (5.7%); arts, design, entertainment, sports, and media occupations (5.7%)
Most popular occupations of females: sales and office occupations (28.0%); service occupations (15.7%); healthcare practitioners and technical occupations (12.0%); education, training, and library occupations (10.0%); business and financial operations occupations (9.9%); management occupations (except farmers) (6.9%); life, physical, and social science occupations (3.5%)
Roads and streets: E 35th St; E 38th St (Co Rd 38); E 37th St; E 36th St; E 39th St; E 40th St; Dight Ave; Snelling Ave S; Minnehaha Ave (Co Rd 48); W River Pkwy; 39th Ave S; 37th Ave S; 40th Ave S; 46th Ave S; 45th Ave S; 43rd Ave S; 44th Ave S; 36th Ave S; 42nd Ave S; 41st Ave S; 38th Ave S; 35th Ave S; 47th Ave S; 34th Ave S; Edmund Blvd S; Dowling St; 33rd Ave S; Edmund Blvd; Park Ter; 48th Ave S; 32nd Ave S; Isabel Ave; Glabe Ln; 31st Ave S; Coffey Ln.
Railroad features: Minnesota Commercial RR.
Howe neighborhood detailed profile
Area: 1.090 square miles
Population: 11,032
Population density:
| Howe: | 10,117 people per square mile |
| Minneapolis: | 7,749 people per square mile |
Median household income in 2021:
| Howe: | $84,616 |
| Minneapolis: | $69,397 |
Median rent in in 2021:
| Howe: | $901 |
| Minneapolis: | $1,138 |
Male vs Females
| Males: | 5,320 |
| Females: | 5,712 |
Median age
| Males: | 40.7 years |
| Females: | 44.2 years |
Housing prices:
Average estimated value of detached houses in 2021 (62.9% of all units):
| Howe: | $289,328 |
| Minneapolis: | $398,431 |
Average estimated value of housing units in 2-unit structures in 2021 (11.5% of all units):
| This neighborhood: | $256,135 |
| Minneapolis: | $353,466 |
Most popular occupations of males: management occupations (except farmers) (14.6%); service occupations (14.4%); sales and office occupations (13.6%); production occupations (9.0%); transportation occupations (8.7%); business and financial operations occupations (5.7%); arts, design, entertainment, sports, and media occupations (5.7%)
Most popular occupations of females: sales and office occupations (28.0%); service occupations (15.7%); healthcare practitioners and technical occupations (12.0%); education, training, and library occupations (10.0%); business and financial operations occupations (9.9%); management occupations (except farmers) (6.9%); life, physical, and social science occupations (3.5%)
Roads and streets: E 35th St; E 38th St (Co Rd 38); E 37th St; E 36th St; E 39th St; E 40th St; Dight Ave; Snelling Ave S; Minnehaha Ave (Co Rd 48); W River Pkwy; 39th Ave S; 37th Ave S; 40th Ave S; 46th Ave S; 45th Ave S; 43rd Ave S; 44th Ave S; 36th Ave S; 42nd Ave S; 41st Ave S; 38th Ave S; 35th Ave S; 47th Ave S; 34th Ave S; Edmund Blvd S; Dowling St; 33rd Ave S; Edmund Blvd; Park Ter; 48th Ave S; 32nd Ave S; Isabel Ave; Glabe Ln; 31st Ave S; Coffey Ln.
Railroad features: Minnesota Commercial RR.
Howe neighborhood detailed profile
Humboldt Industrial neighborhood in Minneapolis statistics: (Find on map)
Area: 0.267 square miles
Population: 412
Population density:
Median household income in 2021:
Median rent in in 2021:
Male vs Females
Median age
Average estimated value of detached houses in 2021 (97.1% of all units):
Most popular occupations of males: sales and office occupations (25.8%); service occupations (19.2%); management occupations (except farmers) (13.8%); transportation occupations (13.2%); material moving occupations (8.6%); computer and mathematical occupations (7.3%); production occupations (6.7%)
Most popular occupations of females: sales and office occupations (46.3%); education, training, and library occupations (24.6%); life, physical, and social science occupations (15.9%); community and social services occupations (13.3%); service occupations (12.4%); business and financial operations occupations (3.1%)
Roads and streets: Humboldt Ave N (Co Rd 57).
Railroad features: Canadian Pacific Rlwy.
Other features: Ryan Crk.
Other features: Shingle Crk.
Humboldt Industrial neighborhood detailed profile
Area: 0.267 square miles
Population: 412
Population density:
| Humboldt Industrial: | 1,542 people per square mile |
| Minneapolis: | 7,749 people per square mile |
Median household income in 2021:
| Humboldt Industrial: | $58,779 |
| Minneapolis: | $69,397 |
Median rent in in 2021:
| Humboldt Industrial: | $504 |
| Minneapolis: | $1,138 |
Male vs Females
| Males: | 217 |
| Females: | 195 |
Median age
| Males: | 38.9 years |
| Females: | 39.4 years |
Average estimated value of detached houses in 2021 (97.1% of all units):
| Humboldt Industrial: | $266,369 |
| Minneapolis: | $398,431 |
Most popular occupations of males: sales and office occupations (25.8%); service occupations (19.2%); management occupations (except farmers) (13.8%); transportation occupations (13.2%); material moving occupations (8.6%); computer and mathematical occupations (7.3%); production occupations (6.7%)
Most popular occupations of females: sales and office occupations (46.3%); education, training, and library occupations (24.6%); life, physical, and social science occupations (15.9%); community and social services occupations (13.3%); service occupations (12.4%); business and financial operations occupations (3.1%)
Roads and streets: Humboldt Ave N (Co Rd 57).
Railroad features: Canadian Pacific Rlwy.
Other features: Ryan Crk.
Other features: Shingle Crk.
Humboldt Industrial neighborhood detailed profile
Johnsville neighborhood in Minneapolis statistics: (Find on map)
Area: 2.353 square miles
Population: 1,566
Population density:
Median household income in 2021:
Median rent in in 2021:
Male vs Females
Median age
Housing prices:
Average estimated value of detached houses in 2021 (49.3% of all units):
Average estimated value of townhouses or other attached units in 2021 (33.3% of all units):
Most popular occupations of males: management occupations (except farmers) (27.6%); production occupations (21.8%); sales and office occupations (21.2%); construction, extraction, and maintenance occupations (7.2%); architecture and engineering occupations (6.2%); service occupations (2.5%); material moving occupations (2.5%)
Most popular occupations of females: healthcare practitioners and technical occupations (21.6%); sales and office occupations (19.9%); service occupations (17.6%); business and financial operations occupations (11.0%); computer and mathematical occupations (8.6%); legal occupations (7.1%); material moving occupations (6.2%)
Highways in this neighborhood: .
Roads and streets: Central Ave NE; Main St NE (125th Ave NE, State Hwy 242); 129th Ave NE; 131st Ave NE; Co Rd 52 (Radisson Rd NE); 126th Ave NE; 132nd Ln NE; 127th Ln NE; 125th Ln NE; Johnson St NE; Hastings St NE; 132nd Ave NE; 128th Ave NE; 133rd Ln NE; 124th Ln NE; 129th Ln NE; 127th Ave NE; Paul Pkwy NE; Aberdeen St NE; Buchanan St NE; 121st Ave NE; Jefferson St NE; Ulysses St NE; 123rd Ave NE; Davenport St NE; Pierce St NE; Lincoln St NE; Taylor St NE; 130th Ave NE; Baltimore St NE; Eldorado St NE; Isanti St NE; 130th Ln NE; Polk St NE; 123rd Ln NE; 126th Ln NE; Central Av Svc Rd; Goodhue St NE; 122nd Ln NE; State Hwy 242; 131st Ln NE; 124th Ave NE; Fillmore St NE; 134th Ln NE; 122nd Ave NE; Chisholm St NE; London St NE; Jenkins St NE; Oak Park Blvd NE; Tyler St NE; Van Buren St NE; Fergus St NE; Kenyon St NE; Jackson St NE; Able St NE; Madison St NE; Ulysses Cir NE; Pierce Pl NE; Buchanan Cir NE; 124th Ct NE; Monroe St NE; Owatonna Ct; Mankato St NE; 130th Ln; 128th Ln NE; Able Cir NE; Nassau Ct; Goodhue Ct NE; Jackson Cir NE; Fergus Ct NE; Buchanan Ct NE; Pierce Ct NE; 124th Way NE; Isanti Ct NE; 125th Ct NE; Tyler Cir NE.
Other features: Co Ditch 60; Co Ditch; Co Ditch 41-8.
Johnsville neighborhood detailed profile
Area: 2.353 square miles
Population: 1,566
Population density:
| Johnsville: | 666 people per square mile |
| Minneapolis: | 7,749 people per square mile |
Median household income in 2021:
| Johnsville: | $112,957 |
| Minneapolis: | $69,397 |
Median rent in in 2021:
| Johnsville: | $1,074 |
| Minneapolis: | $1,138 |
Male vs Females
| Males: | 775 |
| Females: | 791 |
Median age
| Males: | 50.6 years |
| Females: | 54.4 years |
Housing prices:
Average estimated value of detached houses in 2021 (49.3% of all units):
| Johnsville: | $357,882 |
| Minneapolis: | $398,431 |
Average estimated value of townhouses or other attached units in 2021 (33.3% of all units):
| This neighborhood: | $397,489 |
| city: | $376,360 |
Most popular occupations of males: management occupations (except farmers) (27.6%); production occupations (21.8%); sales and office occupations (21.2%); construction, extraction, and maintenance occupations (7.2%); architecture and engineering occupations (6.2%); service occupations (2.5%); material moving occupations (2.5%)
Most popular occupations of females: healthcare practitioners and technical occupations (21.6%); sales and office occupations (19.9%); service occupations (17.6%); business and financial operations occupations (11.0%); computer and mathematical occupations (8.6%); legal occupations (7.1%); material moving occupations (6.2%)
Highways in this neighborhood: .
Roads and streets: Central Ave NE; Main St NE (125th Ave NE, State Hwy 242); 129th Ave NE; 131st Ave NE; Co Rd 52 (Radisson Rd NE); 126th Ave NE; 132nd Ln NE; 127th Ln NE; 125th Ln NE; Johnson St NE; Hastings St NE; 132nd Ave NE; 128th Ave NE; 133rd Ln NE; 124th Ln NE; 129th Ln NE; 127th Ave NE; Paul Pkwy NE; Aberdeen St NE; Buchanan St NE; 121st Ave NE; Jefferson St NE; Ulysses St NE; 123rd Ave NE; Davenport St NE; Pierce St NE; Lincoln St NE; Taylor St NE; 130th Ave NE; Baltimore St NE; Eldorado St NE; Isanti St NE; 130th Ln NE; Polk St NE; 123rd Ln NE; 126th Ln NE; Central Av Svc Rd; Goodhue St NE; 122nd Ln NE; State Hwy 242; 131st Ln NE; 124th Ave NE; Fillmore St NE; 134th Ln NE; 122nd Ave NE; Chisholm St NE; London St NE; Jenkins St NE; Oak Park Blvd NE; Tyler St NE; Van Buren St NE; Fergus St NE; Kenyon St NE; Jackson St NE; Able St NE; Madison St NE; Ulysses Cir NE; Pierce Pl NE; Buchanan Cir NE; 124th Ct NE; Monroe St NE; Owatonna Ct; Mankato St NE; 130th Ln; 128th Ln NE; Able Cir NE; Nassau Ct; Goodhue Ct NE; Jackson Cir NE; Fergus Ct NE; Buchanan Ct NE; Pierce Ct NE; 124th Way NE; Isanti Ct NE; 125th Ct NE; Tyler Cir NE.
Other features: Co Ditch 60; Co Ditch; Co Ditch 41-8.
Johnsville neighborhood detailed profile
Jordan neighborhood in Minneapolis statistics: (Find on map)
Area: 0.772 square miles
Population: 8,040
Population density:
Median household income in 2021:
Median rent in in 2021:
Male vs Females
Median age
Housing prices:
Average estimated value of detached houses in 2021 (55.3% of all units):
Average estimated value of townhouses or other attached units in 2021 (18.3% of all units):
Most popular occupations of males: production occupations (22.4%); service occupations (15.7%); business and financial operations occupations (11.0%); sales and office occupations (11.0%); construction, extraction, and maintenance occupations (7.1%); computer and mathematical occupations (6.3%); management occupations (except farmers) (6.2%)
Most popular occupations of females: sales and office occupations (31.9%); service occupations (23.9%); education, training, and library occupations (11.4%); production occupations (9.4%); community and social services occupations (5.5%); management occupations (except farmers) (4.7%); construction, extraction, and maintenance occupations (2.5%)
Roads and streets: 30th Ave N; 27th Ave N; 29th Ave N; 26th Ave N; James Ave N; 25th Ave N; Irving Ave N; Fremont Ave N; Logan Ave N; Girard Ave N; 22nd Ave N; Hillside Ave N; Co Rd 2 (Penn Ave N); 23rd Ave N; Morgan Ave N; Newton Ave N; Queen Ave N; Humboldt Ave N; Ilion Ave N; Oliver Ave N; Emerson Ave N; Knox Ave N; 21st Ave N; Co Rd 81 (W Broadway Ave); Russell Ave N; 24th Ave N; N Willow Ave; Thomas Ave N; Sheridan Ave N; Upton Ave N.
Jordan neighborhood detailed profile
Area: 0.772 square miles
Population: 8,040
Population density:
| Jordan: | 10,419 people per square mile |
| Minneapolis: | 7,749 people per square mile |
Median household income in 2021:
| Jordan: | $55,382 |
| Minneapolis: | $69,397 |
Median rent in in 2021:
| Jordan: | $887 |
| Minneapolis: | $1,138 |
Male vs Females
| Males: | 3,736 |
| Females: | 4,304 |
Median age
| Males: | 29.9 years |
| Females: | 26.6 years |
Housing prices:
Average estimated value of detached houses in 2021 (55.3% of all units):
| Jordan: | $147,519 |
| Minneapolis: | $398,431 |
Average estimated value of townhouses or other attached units in 2021 (18.3% of all units):
| This neighborhood: | $216,275 |
| city: | $376,360 |
Most popular occupations of males: production occupations (22.4%); service occupations (15.7%); business and financial operations occupations (11.0%); sales and office occupations (11.0%); construction, extraction, and maintenance occupations (7.1%); computer and mathematical occupations (6.3%); management occupations (except farmers) (6.2%)
Most popular occupations of females: sales and office occupations (31.9%); service occupations (23.9%); education, training, and library occupations (11.4%); production occupations (9.4%); community and social services occupations (5.5%); management occupations (except farmers) (4.7%); construction, extraction, and maintenance occupations (2.5%)
Roads and streets: 30th Ave N; 27th Ave N; 29th Ave N; 26th Ave N; James Ave N; 25th Ave N; Irving Ave N; Fremont Ave N; Logan Ave N; Girard Ave N; 22nd Ave N; Hillside Ave N; Co Rd 2 (Penn Ave N); 23rd Ave N; Morgan Ave N; Newton Ave N; Queen Ave N; Humboldt Ave N; Ilion Ave N; Oliver Ave N; Emerson Ave N; Knox Ave N; 21st Ave N; Co Rd 81 (W Broadway Ave); Russell Ave N; 24th Ave N; N Willow Ave; Thomas Ave N; Sheridan Ave N; Upton Ave N.
Jordan neighborhood detailed profile
Keewaydin neighborhood in Minneapolis statistics: (Find on map)
Area: 0.887 square miles
Population: 2,587
Population density:
Median household income in 2021:
Median rent in in 2021:
Male vs Females
Median age
Housing prices:
Average estimated value of detached houses in 2021 (86.4% of all units):
Average estimated value of townhouses or other attached units in 2021 (6.9% of all units):
Average estimated '21 value of housing units in 5-or-more-unit structures (26.1% of all units):
Most popular occupations of males: computer and mathematical occupations (19.1%); management occupations (except farmers) (15.9%); service occupations (8.5%); transportation occupations (8.4%); sales and office occupations (7.5%); business and financial operations occupations (6.8%); construction, extraction, and maintenance occupations (6.8%)
Most popular occupations of females: sales and office occupations (16.6%); business and financial operations occupations (14.6%); arts, design, entertainment, sports, and media occupations (14.3%); healthcare practitioners and technical occupations (12.7%); service occupations (11.4%); management occupations (except farmers) (8.4%); community and social services occupations (8.0%)
Roads and streets: E 54th St; E 53rd St; E Nokomis Pkwy; E Minnehaha Pkwy; E 52nd St; E 50th St; E 51st St; 34th Ave S; Co Rd 54 (28th Ave); 29th Ave S; 30th Ave S; 31st Ave S; E 49th St; Woodlawn Blvd; Nokomis Ave S; 32nd Ave S; 33rd Ave S; W Lake Nokomis Pkwy (W Nokomis Pkwy); 27th Ave S; Mondamin St; Keewaydin Pl; Weenonah Pl; 26th Ave S; Shoreview Ave; 25th Ave S; Nokomis Pkwy.
Other features: Minnehaha Crk.
Keewaydin neighborhood detailed profile
Area: 0.887 square miles
Population: 2,587
Population density:
| Keewaydin: | 2,917 people per square mile |
| Minneapolis: | 7,749 people per square mile |
Median household income in 2021:
| Keewaydin: | $106,529 |
| Minneapolis: | $69,397 |
Median rent in in 2021:
| Keewaydin: | $1,281 |
| Minneapolis: | $1,138 |
Male vs Females
| Males: | 1,286 |
| Females: | 1,301 |
Median age
| Males: | 41.1 years |
| Females: | 40.6 years |
Housing prices:
Average estimated value of detached houses in 2021 (86.4% of all units):
| Keewaydin: | $291,157 |
| Minneapolis: | $398,431 |
Average estimated value of townhouses or other attached units in 2021 (6.9% of all units):
| This neighborhood: | $296,875 |
| city: | $376,360 |
Average estimated '21 value of housing units in 5-or-more-unit structures (26.1% of all units):
| Keewaydin: | $106,700 |
| Minneapolis: | $317,891 |
Most popular occupations of males: computer and mathematical occupations (19.1%); management occupations (except farmers) (15.9%); service occupations (8.5%); transportation occupations (8.4%); sales and office occupations (7.5%); business and financial operations occupations (6.8%); construction, extraction, and maintenance occupations (6.8%)
Most popular occupations of females: sales and office occupations (16.6%); business and financial operations occupations (14.6%); arts, design, entertainment, sports, and media occupations (14.3%); healthcare practitioners and technical occupations (12.7%); service occupations (11.4%); management occupations (except farmers) (8.4%); community and social services occupations (8.0%)
Roads and streets: E 54th St; E 53rd St; E Nokomis Pkwy; E Minnehaha Pkwy; E 52nd St; E 50th St; E 51st St; 34th Ave S; Co Rd 54 (28th Ave); 29th Ave S; 30th Ave S; 31st Ave S; E 49th St; Woodlawn Blvd; Nokomis Ave S; 32nd Ave S; 33rd Ave S; W Lake Nokomis Pkwy (W Nokomis Pkwy); 27th Ave S; Mondamin St; Keewaydin Pl; Weenonah Pl; 26th Ave S; Shoreview Ave; 25th Ave S; Nokomis Pkwy.
Other features: Minnehaha Crk.
Keewaydin neighborhood detailed profile
Kenny neighborhood in Minneapolis statistics: (Find on map)
Area: 0.651 square miles
Population: 4,438
Population density:
Median household income in 2021:
Median rent in in 2021:
Male vs Females
Median age
Average estimated value of detached houses in 2021 (92.4% of all units):
Most popular occupations of males: sales and office occupations (21.7%); computer and mathematical occupations (16.5%); management occupations (except farmers) (14.8%); business and financial operations occupations (8.3%); production occupations (8.0%); arts, design, entertainment, sports, and media occupations (6.0%); service occupations (5.3%)
Most popular occupations of females: sales and office occupations (25.3%); healthcare practitioners and technical occupations (15.5%); business and financial operations occupations (13.8%); management occupations (except farmers) (12.1%); arts, design, entertainment, sports, and media occupations (6.9%); education, training, and library occupations (6.2%); service occupations (6.0%)
Highways in this neighborhood: State Hwy 121.
Roads and streets: W 55th St; W 56th St; W 57th St; Dupont Ave S; W 58th St; Knox Ave S; James Ave S; Emerson Ave S; Grass Lake Ter; Colfax Ave S; Fremont Ave S; Irving Ave S; W 59th St; Girard Ave S; Bryant Ave S; W 60th St; Sunrise Dr; Aldrich Ave S; W 61st St; Lyndale Ave S; Humboldt Ave S; Humboldt Cir; Girard Ct.
Kenny neighborhood detailed profile
Area: 0.651 square miles
Population: 4,438
Population density:
| Kenny: | 6,820 people per square mile |
| Minneapolis: | 7,749 people per square mile |
Median household income in 2021:
| Kenny: | $130,394 |
| Minneapolis: | $69,397 |
Median rent in in 2021:
| Kenny: | $1,404 |
| Minneapolis: | $1,138 |
Male vs Females
| Males: | 2,090 |
| Females: | 2,348 |
Median age
| Males: | 38.1 years |
| Females: | 38.3 years |
Average estimated value of detached houses in 2021 (92.4% of all units):
| Kenny: | $351,909 |
| Minneapolis: | $398,431 |
Most popular occupations of males: sales and office occupations (21.7%); computer and mathematical occupations (16.5%); management occupations (except farmers) (14.8%); business and financial operations occupations (8.3%); production occupations (8.0%); arts, design, entertainment, sports, and media occupations (6.0%); service occupations (5.3%)
Most popular occupations of females: sales and office occupations (25.3%); healthcare practitioners and technical occupations (15.5%); business and financial operations occupations (13.8%); management occupations (except farmers) (12.1%); arts, design, entertainment, sports, and media occupations (6.9%); education, training, and library occupations (6.2%); service occupations (6.0%)
Highways in this neighborhood: State Hwy 121.
Roads and streets: W 55th St; W 56th St; W 57th St; Dupont Ave S; W 58th St; Knox Ave S; James Ave S; Emerson Ave S; Grass Lake Ter; Colfax Ave S; Fremont Ave S; Irving Ave S; W 59th St; Girard Ave S; Bryant Ave S; W 60th St; Sunrise Dr; Aldrich Ave S; W 61st St; Lyndale Ave S; Humboldt Ave S; Humboldt Cir; Girard Ct.
Kenny neighborhood detailed profile
Kenwood neighborhood in Minneapolis statistics: (Find on map)
Area: 0.637 square miles
Population: 1,250
Population density:
Median household income in 2021:
Median rent in in 2021:
Male vs Females
Median age
Average estimated value of detached houses in 2021 (54.3% of all units):
Most popular occupations of males: management occupations (except farmers) (26.7%); sales and office occupations (20.2%); business and financial operations occupations (13.2%); legal occupations (10.0%); material moving occupations (6.0%); healthcare practitioners and technical occupations (4.6%); life, physical, and social science occupations (4.1%)
Most popular occupations of females: business and financial operations occupations (25.7%); sales and office occupations (18.2%); management occupations (except farmers) (14.3%); education, training, and library occupations (9.7%); healthcare practitioners and technical occupations (9.2%); arts, design, entertainment, sports, and media occupations (8.3%); life, physical, and social science occupations (4.4%)
Roads and streets: W Lake of the Isles Pkwy; Kenwood Pkwy; W 21st St; Sheridan Ave S; Oliver Ave S; Penn Ave S; W Franklin Ave; Newton Ave S; Thomas Ave S; W 22nd St; Kenilworth Pl; W 24th St; S Upton Ave; Douglas Ave; Queen Ave S; Morgan Ave S; Summit Ave; Oliver Pl S; Russell Ave S; Logan Ave S; Burnham Rd; Kenwood Triangle; Thomas Ln.
Railroad features: Twin Cities & Western RR; Burlington Northern Santa Fe Rlwy.
Kenwood neighborhood detailed profile
Area: 0.637 square miles
Population: 1,250
Population density:
| Kenwood: | 1,963 people per square mile |
| Minneapolis: | 7,749 people per square mile |
Median household income in 2021:
| Kenwood: | $193,578 |
| Minneapolis: | $69,397 |
Median rent in in 2021:
| Kenwood: | $1,855 |
| Minneapolis: | $1,138 |
Male vs Females
| Males: | 528 |
| Females: | 722 |
Median age
| Males: | 39.6 years |
| Females: | 44.1 years |
Average estimated value of detached houses in 2021 (54.3% of all units):
| Kenwood: | $942,478 |
| Minneapolis: | $398,431 |
Most popular occupations of males: management occupations (except farmers) (26.7%); sales and office occupations (20.2%); business and financial operations occupations (13.2%); legal occupations (10.0%); material moving occupations (6.0%); healthcare practitioners and technical occupations (4.6%); life, physical, and social science occupations (4.1%)
Most popular occupations of females: business and financial operations occupations (25.7%); sales and office occupations (18.2%); management occupations (except farmers) (14.3%); education, training, and library occupations (9.7%); healthcare practitioners and technical occupations (9.2%); arts, design, entertainment, sports, and media occupations (8.3%); life, physical, and social science occupations (4.4%)
Roads and streets: W Lake of the Isles Pkwy; Kenwood Pkwy; W 21st St; Sheridan Ave S; Oliver Ave S; Penn Ave S; W Franklin Ave; Newton Ave S; Thomas Ave S; W 22nd St; Kenilworth Pl; W 24th St; S Upton Ave; Douglas Ave; Queen Ave S; Morgan Ave S; Summit Ave; Oliver Pl S; Russell Ave S; Logan Ave S; Burnham Rd; Kenwood Triangle; Thomas Ln.
Railroad features: Twin Cities & Western RR; Burlington Northern Santa Fe Rlwy.
Kenwood neighborhood detailed profile
King Field neighborhood in Minneapolis statistics: (Find on map)
Area: 0.828 square miles
Population: 9,063
Population density:
Median household income in 2021:
Median rent in in 2021:
Male vs Females
Median age
Housing prices:
Average estimated value of detached houses in 2021 (50.8% of all units):
Average estimated value of townhouses or other attached units in 2021 (5.8% of all units):
Average estimated value of housing units in 2-unit structures in 2021 (13.9% of all units):
Average estimated '21 value of housing units in 3-to-4-unit structures (9.3% of all units):
Average estimated '21 value of housing units in 5-or-more-unit structures (1.7% of all units):
Most popular occupations of males: management occupations (except farmers) (14.9%); sales and office occupations (11.3%); service occupations (10.4%); computer and mathematical occupations (10.1%); business and financial operations occupations (8.8%); arts, design, entertainment, sports, and media occupations (8.7%); education, training, and library occupations (6.7%)
Most popular occupations of females: service occupations (20.2%); sales and office occupations (19.3%); management occupations (except farmers) (14.4%); education, training, and library occupations (10.7%); business and financial operations occupations (7.8%); community and social services occupations (6.9%); arts, design, entertainment, sports, and media occupations (6.0%)
Roads and streets: Harriet Ave S; Garfield Ave S; Grand Ave; Pillsbury Ave S; Pleasant Ave S; Blaisdell Ave S; Co Rd 52 (Nicollet Ave); Stevens Ave S; 1st Ave S; Wentworth Ave S; W 44th St; W 45th St; W 43rd St; W 46th St; W 42nd St; W 41st St; W 40th St; W 39th St; W 38th St (Co Rd 38); W 37th St; E 38th St (Co Rd 38); E 42nd St; E 46th St; E 37th St; E 39th St; E 40th St; E 43rd St; E 44th St; E 45th St; Van Nest Ave.
King Field neighborhood detailed profile
Area: 0.828 square miles
Population: 9,063
Population density:
| King Field: | 10,941 people per square mile |
| Minneapolis: | 7,749 people per square mile |
Median household income in 2021:
| King Field: | $102,086 |
| Minneapolis: | $69,397 |
Median rent in in 2021:
| King Field: | $1,514 |
| Minneapolis: | $1,138 |
Male vs Females
| Males: | 4,466 |
| Females: | 4,597 |
Median age
| Males: | 46.5 years |
| Females: | 43.2 years |
Housing prices:
Average estimated value of detached houses in 2021 (50.8% of all units):
| King Field: | $339,046 |
| Minneapolis: | $398,431 |
Average estimated value of townhouses or other attached units in 2021 (5.8% of all units):
| This neighborhood: | $234,721 |
| city: | $376,360 |
Average estimated value of housing units in 2-unit structures in 2021 (13.9% of all units):
| This neighborhood: | $264,658 |
| Minneapolis: | $353,466 |
Average estimated '21 value of housing units in 3-to-4-unit structures (9.3% of all units):
| King Field: | $215,948 |
| city: | $335,939 |
Average estimated '21 value of housing units in 5-or-more-unit structures (1.7% of all units):
| King Field: | $97,150 |
| Minneapolis: | $317,891 |
Most popular occupations of males: management occupations (except farmers) (14.9%); sales and office occupations (11.3%); service occupations (10.4%); computer and mathematical occupations (10.1%); business and financial operations occupations (8.8%); arts, design, entertainment, sports, and media occupations (8.7%); education, training, and library occupations (6.7%)
Most popular occupations of females: service occupations (20.2%); sales and office occupations (19.3%); management occupations (except farmers) (14.4%); education, training, and library occupations (10.7%); business and financial operations occupations (7.8%); community and social services occupations (6.9%); arts, design, entertainment, sports, and media occupations (6.0%)
Roads and streets: Harriet Ave S; Garfield Ave S; Grand Ave; Pillsbury Ave S; Pleasant Ave S; Blaisdell Ave S; Co Rd 52 (Nicollet Ave); Stevens Ave S; 1st Ave S; Wentworth Ave S; W 44th St; W 45th St; W 43rd St; W 46th St; W 42nd St; W 41st St; W 40th St; W 39th St; W 38th St (Co Rd 38); W 37th St; E 38th St (Co Rd 38); E 42nd St; E 46th St; E 37th St; E 39th St; E 40th St; E 43rd St; E 44th St; E 45th St; Van Nest Ave.
King Field neighborhood detailed profile
Lind-Bohanon neighborhood in Minneapolis statistics: (Find on map)
Area: 0.798 square miles
Population: 5,274
Population density:
Median household income in 2021:
Median rent in in 2021:
Male vs Females
Median age
Housing prices:
Average estimated value of detached houses in 2021 (84.6% of all units):
Average estimated value of townhouses or other attached units in 2021 (3.9% of all units):
Most popular occupations of males: production occupations (20.9%); service occupations (17.9%); sales and office occupations (15.7%); construction, extraction, and maintenance occupations (8.8%); business and financial operations occupations (5.9%); management occupations (except farmers) (4.9%); transportation occupations (4.9%)
Most popular occupations of females: service occupations (29.1%); sales and office occupations (18.7%); healthcare practitioners and technical occupations (12.5%); management occupations (except farmers) (10.4%); education, training, and library occupations (7.9%); transportation occupations (7.7%); community and social services occupations (4.2%)
Limited-access highways (interstate or state) in this neighborhood: I- 94 (US Hwy 52).
Roads and streets: N Mississippi Dr (Lyndale Ave N); 52nd Ave N; 51st Ave N; Bryant Ave N; Aldrich Ave N; 49th Ave N; Camden Ave N; Dupont Ave N; Emerson Ave N; 48th Ave N; 47th Ave N; 50th Ave N; Fremont Ave N; Girard Ave N; 46th Ave N; Colfax Ave N; Shingle Creek Dr; 45th Ave N; N 6th St; 6th St N; Mississippi Ct; 44th Ave N; N 3rd St; N 4th St; 49th 1/2 Ave N; N 4th Ct.
Railroad features: Canadian Pacific Rlwy.
Other features: Shingle Crk.
Lind-Bohanon neighborhood detailed profile
Area: 0.798 square miles
Population: 5,274
Population density:
| Lind-Bohanon: | 6,609 people per square mile |
| Minneapolis: | 7,749 people per square mile |
Median household income in 2021:
| Lind-Bohanon: | $60,395 |
| Minneapolis: | $69,397 |
Median rent in in 2021:
| Lind-Bohanon: | $1,327 |
| Minneapolis: | $1,138 |
Male vs Females
| Males: | 2,655 |
| Females: | 2,618 |
Median age
| Males: | 32.9 years |
| Females: | 35.8 years |
Housing prices:
Average estimated value of detached houses in 2021 (84.6% of all units):
| Lind-Bohanon: | $71,147 |
| Minneapolis: | $398,431 |
Average estimated value of townhouses or other attached units in 2021 (3.9% of all units):
| This neighborhood: | $70,394 |
| city: | $376,360 |
Most popular occupations of males: production occupations (20.9%); service occupations (17.9%); sales and office occupations (15.7%); construction, extraction, and maintenance occupations (8.8%); business and financial operations occupations (5.9%); management occupations (except farmers) (4.9%); transportation occupations (4.9%)
Most popular occupations of females: service occupations (29.1%); sales and office occupations (18.7%); healthcare practitioners and technical occupations (12.5%); management occupations (except farmers) (10.4%); education, training, and library occupations (7.9%); transportation occupations (7.7%); community and social services occupations (4.2%)
Limited-access highways (interstate or state) in this neighborhood: I- 94 (US Hwy 52).
Roads and streets: N Mississippi Dr (Lyndale Ave N); 52nd Ave N; 51st Ave N; Bryant Ave N; Aldrich Ave N; 49th Ave N; Camden Ave N; Dupont Ave N; Emerson Ave N; 48th Ave N; 47th Ave N; 50th Ave N; Fremont Ave N; Girard Ave N; 46th Ave N; Colfax Ave N; Shingle Creek Dr; 45th Ave N; N 6th St; 6th St N; Mississippi Ct; 44th Ave N; N 3rd St; N 4th St; 49th 1/2 Ave N; N 4th Ct.
Railroad features: Canadian Pacific Rlwy.
Other features: Shingle Crk.
Lind-Bohanon neighborhood detailed profile
Linden Hills neighborhood in Minneapolis statistics: (Find on map)
Area: 1.393 square miles
Population: 8,760
Population density:
Median household income in 2021:
Median rent in in 2021:
Male vs Females
Median age
Housing prices:
Average estimated value of detached houses in 2021 (55.0% of all units):
Average estimated value of townhouses or other attached units in 2021 (5.8% of all units):
Average estimated value of housing units in 2-unit structures in 2021 (9.3% of all units):
Average estimated '21 value of housing units in 5-or-more-unit structures (27.5% of all units):
Most popular occupations of males: management occupations (except farmers) (21.8%); sales and office occupations (17.5%); computer and mathematical occupations (9.9%); business and financial operations occupations (7.7%); service occupations (7.2%); education, training, and library occupations (6.9%); architecture and engineering occupations (4.2%)
Most popular occupations of females: management occupations (except farmers) (19.6%); sales and office occupations (15.7%); business and financial operations occupations (14.0%); education, training, and library occupations (10.7%); service occupations (10.5%); healthcare practitioners and technical occupations (7.4%); arts, design, entertainment, sports, and media occupations (6.3%)
Roads and streets: W 42nd St; W 40th St; W 44th St; Drew Ave S; Abbott Ave S; Chowen Ave S; W 39th St; Upton Ave S; Co Rd 31 (Xerxes Ave); Washburn Ave S; Beard Ave S; W 41st St; Zenith Ave S; Ewing Ave S; Vincent Ave S; W 38th St; W 45th St; W 43rd St; W 46th St; York Ave S; Sheridan Ave S; W Calhoun Pkwy; Linden Hills Blvd; W Lake Harriet Pkwy; Queen Ave S; Thomas Ave S; W Lake Harriet Blvd; Richfield Rd; Motor Pl; Glendale Ter; William Berry Pkwy; W 47th St.
Linden Hills neighborhood detailed profile
Area: 1.393 square miles
Population: 8,760
Population density:
| Linden Hills: | 6,288 people per square mile |
| Minneapolis: | 7,749 people per square mile |
Median household income in 2021:
| Linden Hills: | $111,863 |
| Minneapolis: | $69,397 |
Median rent in in 2021:
| Linden Hills: | $1,214 |
| Minneapolis: | $1,138 |
Male vs Females
| Males: | 4,448 |
| Females: | 4,312 |
Median age
| Males: | 41.0 years |
| Females: | 39.0 years |
Housing prices:
Average estimated value of detached houses in 2021 (55.0% of all units):
| Linden Hills: | $595,258 |
| Minneapolis: | $398,431 |
Average estimated value of townhouses or other attached units in 2021 (5.8% of all units):
| This neighborhood: | $211,273 |
| city: | $376,360 |
Average estimated value of housing units in 2-unit structures in 2021 (9.3% of all units):
| This neighborhood: | $424,107 |
| Minneapolis: | $353,466 |
Average estimated '21 value of housing units in 5-or-more-unit structures (27.5% of all units):
| Linden Hills: | $193,662 |
| Minneapolis: | $317,891 |
Most popular occupations of males: management occupations (except farmers) (21.8%); sales and office occupations (17.5%); computer and mathematical occupations (9.9%); business and financial operations occupations (7.7%); service occupations (7.2%); education, training, and library occupations (6.9%); architecture and engineering occupations (4.2%)
Most popular occupations of females: management occupations (except farmers) (19.6%); sales and office occupations (15.7%); business and financial operations occupations (14.0%); education, training, and library occupations (10.7%); service occupations (10.5%); healthcare practitioners and technical occupations (7.4%); arts, design, entertainment, sports, and media occupations (6.3%)
Roads and streets: W 42nd St; W 40th St; W 44th St; Drew Ave S; Abbott Ave S; Chowen Ave S; W 39th St; Upton Ave S; Co Rd 31 (Xerxes Ave); Washburn Ave S; Beard Ave S; W 41st St; Zenith Ave S; Ewing Ave S; Vincent Ave S; W 38th St; W 45th St; W 43rd St; W 46th St; York Ave S; Sheridan Ave S; W Calhoun Pkwy; Linden Hills Blvd; W Lake Harriet Pkwy; Queen Ave S; Thomas Ave S; W Lake Harriet Blvd; Richfield Rd; Motor Pl; Glendale Ter; William Berry Pkwy; W 47th St.
Linden Hills neighborhood detailed profile
Logan Park neighborhood in Minneapolis statistics: (Find on map)
Area: 0.262 square miles
Population: 2,548
Population density:
Median household income in 2021:
Median rent in in 2021:
Male vs Females
Median age
Housing prices:
Average estimated value of detached houses in 2021 (21.4% of all units):
Average estimated value of housing units in 2-unit structures in 2021 (41.1% of all units):
Average estimated '21 value of housing units in 5-or-more-unit structures (49.6% of all units):
Most popular occupations of males: arts, design, entertainment, sports, and media occupations (21.0%); service occupations (16.6%); management occupations (except farmers) (12.9%); sales and office occupations (11.4%); architecture and engineering occupations (8.8%); computer and mathematical occupations (7.5%); life, physical, and social science occupations (4.2%)
Most popular occupations of females: sales and office occupations (27.0%); service occupations (15.4%); healthcare practitioners and technical occupations (11.4%); management occupations (except farmers) (9.0%); business and financial operations occupations (9.0%); arts, design, entertainment, sports, and media occupations (8.9%); education, training, and library occupations (8.7%)
Highways in this neighborhood: Central Ave NE (State Hwy 65).
Roads and streets: 15th Ave NE; Monroe St NE; Jefferson St NE; Madison St NE; 18th 1/2 Ave NE; 18th Ave NE; Adams St NE; 17th Ave NE; 13th Ave NE; 14th Ave NE; Quincy St NE; Jackson St NE; Van Buren St NE.
Railroad features: Burlington Northern Santa Fe Rlwy.
Logan Park neighborhood detailed profile
Area: 0.262 square miles
Population: 2,548
Population density:
| Logan Park: | 9,736 people per square mile |
| Minneapolis: | 7,749 people per square mile |
Median household income in 2021:
| Logan Park: | $57,705 |
| Minneapolis: | $69,397 |
Median rent in in 2021:
| Logan Park: | $1,020 |
| Minneapolis: | $1,138 |
Male vs Females
| Males: | 1,179 |
| Females: | 1,368 |
Median age
| Males: | 42.6 years |
| Females: | 37.9 years |
Housing prices:
Average estimated value of detached houses in 2021 (21.4% of all units):
| Logan Park: | $294,773 |
| Minneapolis: | $398,431 |
Average estimated value of housing units in 2-unit structures in 2021 (41.1% of all units):
| This neighborhood: | $275,515 |
| Minneapolis: | $353,466 |
Average estimated '21 value of housing units in 5-or-more-unit structures (49.6% of all units):
| Logan Park: | $292,857 |
| Minneapolis: | $317,891 |
Most popular occupations of males: arts, design, entertainment, sports, and media occupations (21.0%); service occupations (16.6%); management occupations (except farmers) (12.9%); sales and office occupations (11.4%); architecture and engineering occupations (8.8%); computer and mathematical occupations (7.5%); life, physical, and social science occupations (4.2%)
Most popular occupations of females: sales and office occupations (27.0%); service occupations (15.4%); healthcare practitioners and technical occupations (11.4%); management occupations (except farmers) (9.0%); business and financial operations occupations (9.0%); arts, design, entertainment, sports, and media occupations (8.9%); education, training, and library occupations (8.7%)
Highways in this neighborhood: Central Ave NE (State Hwy 65).
Roads and streets: 15th Ave NE; Monroe St NE; Jefferson St NE; Madison St NE; 18th 1/2 Ave NE; 18th Ave NE; Adams St NE; 17th Ave NE; 13th Ave NE; 14th Ave NE; Quincy St NE; Jackson St NE; Van Buren St NE.
Railroad features: Burlington Northern Santa Fe Rlwy.
Logan Park neighborhood detailed profile
Longfellow neighborhood in Minneapolis statistics: (Find on map)
Area: 0.852 square miles
Population: 4,522
Population density:
Median household income in 2021:
Median rent in in 2021:
Male vs Females
Median age
Housing prices:
Average estimated value of detached houses in 2021 (62.2% of all units):
Average estimated value of townhouses or other attached units in 2021 (6.4% of all units):
Average estimated value of housing units in 2-unit structures in 2021 (15.6% of all units):
Most popular occupations of males: service occupations (20.1%); management occupations (except farmers) (15.6%); sales and office occupations (9.8%); computer and mathematical occupations (8.9%); education, training, and library occupations (7.5%); business and financial operations occupations (6.6%); arts, design, entertainment, sports, and media occupations (6.1%)
Most popular occupations of females: sales and office occupations (27.8%); service occupations (18.0%); management occupations (except farmers) (11.2%); healthcare practitioners and technical occupations (10.2%); education, training, and library occupations (8.9%); community and social services occupations (7.7%); business and financial operations occupations (6.3%)
Roads and streets: E Lake St; E 32nd St; E 29th St; E 28th St; E 33rd St; E 31st St; Minnehaha Ave; 36th Ave S; 31st Ave S; 30th Ave S; 32nd Ave S; 33rd Ave S; 34th Ave S; 35th Ave S; 37th Ave S; 29th Ave S; Snelling Ave S; Co Rd 54 (28th Ave); Co Rd 48 (27th Ave S); 26th Ave S; 38th Ave S; E 26th St.
Railroad features: Minnesota Commercial RR.
Longfellow neighborhood detailed profile
Area: 0.852 square miles
Population: 4,522
Population density:
| Longfellow: | 5,308 people per square mile |
| Minneapolis: | 7,749 people per square mile |
Median household income in 2021:
| Longfellow: | $74,661 |
| Minneapolis: | $69,397 |
Median rent in in 2021:
| Longfellow: | $965 |
| Minneapolis: | $1,138 |
Male vs Females
| Males: | 2,136 |
| Females: | 2,386 |
Median age
| Males: | 40.5 years |
| Females: | 40.0 years |
Housing prices:
Average estimated value of detached houses in 2021 (62.2% of all units):
| Longfellow: | $218,865 |
| Minneapolis: | $398,431 |
Average estimated value of townhouses or other attached units in 2021 (6.4% of all units):
| This neighborhood: | $286,419 |
| city: | $376,360 |
Average estimated value of housing units in 2-unit structures in 2021 (15.6% of all units):
| This neighborhood: | $208,715 |
| Minneapolis: | $353,466 |
Most popular occupations of males: service occupations (20.1%); management occupations (except farmers) (15.6%); sales and office occupations (9.8%); computer and mathematical occupations (8.9%); education, training, and library occupations (7.5%); business and financial operations occupations (6.6%); arts, design, entertainment, sports, and media occupations (6.1%)
Most popular occupations of females: sales and office occupations (27.8%); service occupations (18.0%); management occupations (except farmers) (11.2%); healthcare practitioners and technical occupations (10.2%); education, training, and library occupations (8.9%); community and social services occupations (7.7%); business and financial operations occupations (6.3%)
Roads and streets: E Lake St; E 32nd St; E 29th St; E 28th St; E 33rd St; E 31st St; Minnehaha Ave; 36th Ave S; 31st Ave S; 30th Ave S; 32nd Ave S; 33rd Ave S; 34th Ave S; 35th Ave S; 37th Ave S; 29th Ave S; Snelling Ave S; Co Rd 54 (28th Ave); Co Rd 48 (27th Ave S); 26th Ave S; 38th Ave S; E 26th St.
Railroad features: Minnesota Commercial RR.
Longfellow neighborhood detailed profile
Loring Park neighborhood in Minneapolis statistics: (Find on map)
Area: 0.452 square miles
Population: 3,207
Population density:
Median household income in 2021:
Median rent in in 2021:
Male vs Females
Median age
Housing prices:
Average estimated value of detached houses in 2021 (3.0% of all units):
Average estimated value of housing units in 2-unit structures in 2021 (2.5% of all units):
Average estimated '21 value of housing units in 3-to-4-unit structures (1.9% of all units):
Average estimated '21 value of housing units in 5-or-more-unit structures (40.5% of all units):
Most popular occupations of males: service occupations (41.6%); computer and mathematical occupations (25.1%); sales and office occupations (10.4%); transportation occupations (7.4%); business and financial operations occupations (4.9%); material moving occupations (4.5%); arts, design, entertainment, sports, and media occupations (4.0%)
Most popular occupations of females: service occupations (37.6%); management occupations (except farmers) (25.6%); sales and office occupations (13.6%); community and social services occupations (9.3%); production occupations (5.9%); healthcare practitioners and technical occupations (5.0%); business and financial operations occupations (1.4%)
Limited-access highways (interstate or state) in this neighborhood: US Hwy 52 (I- 94, US Hwy 12).
Roads and streets: Hennepin Ave; W 15th St; Oak Grove St; E 16th St; E 15th St; 13th St S; Spruce Pl; E 14th St; Groveland Ave; Co Rd 52 (Nicollet Ave); Harmon Pl; Clifton Ave; Yale Pl; Lasalle Ave; W 14th St; W Grant St; Willow St S; Laurel Ave W; E Grant St; 1st Ave S; 3rd Ave S; Hawthorne Ave W; 12th St S (Harmon Ct); I- 94 Svc Rd; Clifton Pl; 16th St N; Clinton Ave S; 15th St N; Service Rd; 4th Ave S; 17th St N; Maple St S; 13th St N; Marquette Ave (Marquette Ave S); Dunwoody Blvd; Greenway Gables; Dell Pl; 2nd Ave S.
Loring Park neighborhood detailed profile
Area: 0.452 square miles
Population: 3,207
Population density:
| Loring Park: | 7,096 people per square mile |
| Minneapolis: | 7,749 people per square mile |
Median household income in 2021:
| Loring Park: | $76,296 |
| Minneapolis: | $69,397 |
Median rent in in 2021:
| Loring Park: | $913 |
| Minneapolis: | $1,138 |
Male vs Females
| Males: | 1,815 |
| Females: | 1,392 |
Median age
| Males: | 39.8 years |
| Females: | 33.7 years |
Housing prices:
Average estimated value of detached houses in 2021 (3.0% of all units):
| Loring Park: | $472,801 |
| Minneapolis: | $398,431 |
Average estimated value of housing units in 2-unit structures in 2021 (2.5% of all units):
| This neighborhood: | $739,425 |
| Minneapolis: | $353,466 |
Average estimated '21 value of housing units in 3-to-4-unit structures (1.9% of all units):
| Loring Park: | $250,315 |
| city: | $335,939 |
Average estimated '21 value of housing units in 5-or-more-unit structures (40.5% of all units):
| Loring Park: | $83,920 |
| Minneapolis: | $317,891 |
Most popular occupations of males: service occupations (41.6%); computer and mathematical occupations (25.1%); sales and office occupations (10.4%); transportation occupations (7.4%); business and financial operations occupations (4.9%); material moving occupations (4.5%); arts, design, entertainment, sports, and media occupations (4.0%)
Most popular occupations of females: service occupations (37.6%); management occupations (except farmers) (25.6%); sales and office occupations (13.6%); community and social services occupations (9.3%); production occupations (5.9%); healthcare practitioners and technical occupations (5.0%); business and financial operations occupations (1.4%)
Limited-access highways (interstate or state) in this neighborhood: US Hwy 52 (I- 94, US Hwy 12).
Roads and streets: Hennepin Ave; W 15th St; Oak Grove St; E 16th St; E 15th St; 13th St S; Spruce Pl; E 14th St; Groveland Ave; Co Rd 52 (Nicollet Ave); Harmon Pl; Clifton Ave; Yale Pl; Lasalle Ave; W 14th St; W Grant St; Willow St S; Laurel Ave W; E Grant St; 1st Ave S; 3rd Ave S; Hawthorne Ave W; 12th St S (Harmon Ct); I- 94 Svc Rd; Clifton Pl; 16th St N; Clinton Ave S; 15th St N; Service Rd; 4th Ave S; 17th St N; Maple St S; 13th St N; Marquette Ave (Marquette Ave S); Dunwoody Blvd; Greenway Gables; Dell Pl; 2nd Ave S.
Loring Park neighborhood detailed profile
Lowry Hill neighborhood in Minneapolis statistics: (Find on map)
Area: 0.622 square miles
Population: 4,286
Population density:
Median household income in 2021:
Median rent in in 2021:
Male vs Females
Median age
Housing prices:
Average estimated value of detached houses in 2021 (21.0% of all units):
Average estimated value of townhouses or other attached units in 2021 (4.2% of all units):
Average estimated value of housing units in 2-unit structures in 2021 (23.3% of all units):
Average estimated '21 value of housing units in 3-to-4-unit structures (4.1% of all units):
Average estimated '21 value of housing units in 5-or-more-unit structures (51.9% of all units):
Most popular occupations of males: management occupations (except farmers) (26.3%); sales and office occupations (9.9%); legal occupations (9.6%); business and financial operations occupations (9.4%); arts, design, entertainment, sports, and media occupations (8.2%); service occupations (8.2%); computer and mathematical occupations (6.8%)
Most popular occupations of females: business and financial operations occupations (19.8%); arts, design, entertainment, sports, and media occupations (16.1%); management occupations (except farmers) (15.0%); service occupations (12.4%); sales and office occupations (6.8%); education, training, and library occupations (6.2%); life, physical, and social science occupations (5.5%)
Limited-access highways (interstate or state) in this neighborhood: I- 394 (US Hwy 12); US Hwy 52 (I- 94, US Hwy 12).
Roads and streets: Kenwood Pkwy; Mount Curve Ave; Douglas Ave; Summit Ave S (Summit Ave); Lincoln Ave; W Franklin Ave; Dunwoody Blvd; W 22nd St; Dupont Ave S; Groveland Ter; Irving Ave S; James Ave S; Emerson Ave S; Humboldt Ave S; Fremont Ave S; Hennepin Ave; Linden Ave W; Girard Ave S; Lyndale Ave N; Colfax Ave S; Knox Ave S; Lyndale Ave S; Bryant Ave S; Stadium Pkwy; Hennepin Ave S; Lake of the Isles Pkwy E; Vineland Pl; Summit Pl; Aldrich Ave N; Waverly Pl; Logan Ave S; Ontario Ave W; Northrup Ln.
Railroad features: Union Pacific RR (Burlington Northern Santa Fe Rlwy).
Lowry Hill neighborhood detailed profile
Area: 0.622 square miles
Population: 4,286
Population density:
| Lowry Hill: | 6,895 people per square mile |
| Minneapolis: | 7,749 people per square mile |
Median household income in 2021:
| Lowry Hill: | $126,935 |
| Minneapolis: | $69,397 |
Median rent in in 2021:
| Lowry Hill: | $1,419 |
| Minneapolis: | $1,138 |
Male vs Females
| Males: | 2,250 |
| Females: | 2,036 |
Median age
| Males: | 41.0 years |
| Females: | 39.6 years |
Housing prices:
Average estimated value of detached houses in 2021 (21.0% of all units):
| Lowry Hill: | $1,778,536 |
| Minneapolis: | $398,431 |
Average estimated value of townhouses or other attached units in 2021 (4.2% of all units):
| This neighborhood: | $258,430 |
| city: | $376,360 |
Average estimated value of housing units in 2-unit structures in 2021 (23.3% of all units):
| This neighborhood: | $339,847 |
| Minneapolis: | $353,466 |
Average estimated '21 value of housing units in 3-to-4-unit structures (4.1% of all units):
| Lowry Hill: | $322,969 |
| city: | $335,939 |
Average estimated '21 value of housing units in 5-or-more-unit structures (51.9% of all units):
| Lowry Hill: | $78,893 |
| Minneapolis: | $317,891 |
Most popular occupations of males: management occupations (except farmers) (26.3%); sales and office occupations (9.9%); legal occupations (9.6%); business and financial operations occupations (9.4%); arts, design, entertainment, sports, and media occupations (8.2%); service occupations (8.2%); computer and mathematical occupations (6.8%)
Most popular occupations of females: business and financial operations occupations (19.8%); arts, design, entertainment, sports, and media occupations (16.1%); management occupations (except farmers) (15.0%); service occupations (12.4%); sales and office occupations (6.8%); education, training, and library occupations (6.2%); life, physical, and social science occupations (5.5%)
Limited-access highways (interstate or state) in this neighborhood: I- 394 (US Hwy 12); US Hwy 52 (I- 94, US Hwy 12).
Roads and streets: Kenwood Pkwy; Mount Curve Ave; Douglas Ave; Summit Ave S (Summit Ave); Lincoln Ave; W Franklin Ave; Dunwoody Blvd; W 22nd St; Dupont Ave S; Groveland Ter; Irving Ave S; James Ave S; Emerson Ave S; Humboldt Ave S; Fremont Ave S; Hennepin Ave; Linden Ave W; Girard Ave S; Lyndale Ave N; Colfax Ave S; Knox Ave S; Lyndale Ave S; Bryant Ave S; Stadium Pkwy; Hennepin Ave S; Lake of the Isles Pkwy E; Vineland Pl; Summit Pl; Aldrich Ave N; Waverly Pl; Logan Ave S; Ontario Ave W; Northrup Ln.
Railroad features: Union Pacific RR (Burlington Northern Santa Fe Rlwy).
Lowry Hill neighborhood detailed profile
Lowry Hill East neighborhood in Minneapolis statistics: (Find on map)
Area: 0.411 square miles
Population: 11,220
Population density:
Median household income in 2021:
Median rent in in 2021:
Male vs Females
Median age
Housing prices:
Average estimated value of detached houses in 2021 (8.4% of all units):
Average estimated value of townhouses or other attached units in 2021 (1.3% of all units):
Average estimated value of housing units in 2-unit structures in 2021 (7.0% of all units):
Average estimated '21 value of housing units in 3-to-4-unit structures (7.3% of all units):
Average estimated '21 value of housing units in 5-or-more-unit structures (48.6% of all units):
Most popular occupations of males: sales and office occupations (21.0%); business and financial operations occupations (18.4%); computer and mathematical occupations (16.0%); management occupations (except farmers) (12.7%); architecture and engineering occupations (8.8%); service occupations (6.2%); education, training, and library occupations (4.1%)
Most popular occupations of females: sales and office occupations (19.9%); business and financial operations occupations (14.2%); service occupations (13.2%); community and social services occupations (11.9%); arts, design, entertainment, sports, and media occupations (8.2%); education, training, and library occupations (8.0%); management occupations (except farmers) (7.5%)
Roads and streets: Bryant Ave S; Lyndale Ave S; Aldrich Ave S; Colfax Ave S; Dupont Ave S; Emerson Ave S; W 27th St; W 29th St; W 28th St; W 26th St; W Lake St; Fremont Ave S; W 25th St; Girard Ave S; W 24th St; Lagoon Ave; W 22nd St; Co Rd 5 (W Franklin Ave); Hennepin Ave S.
Lowry Hill East neighborhood detailed profile
Area: 0.411 square miles
Population: 11,220
Population density:
| Lowry Hill East: | 27,302 people per square mile |
| Minneapolis: | 7,749 people per square mile |
Median household income in 2021:
| Lowry Hill East: | $60,812 |
| Minneapolis: | $69,397 |
Median rent in in 2021:
| Lowry Hill East: | $1,229 |
| Minneapolis: | $1,138 |
Male vs Females
| Males: | 6,355 |
| Females: | 4,865 |
Median age
| Males: | 32.7 years |
| Females: | 31.0 years |
Housing prices:
Average estimated value of detached houses in 2021 (8.4% of all units):
| Lowry Hill East: | $352,205 |
| Minneapolis: | $398,431 |
Average estimated value of townhouses or other attached units in 2021 (1.3% of all units):
| This neighborhood: | $1,415,378 |
| city: | $376,360 |
Average estimated value of housing units in 2-unit structures in 2021 (7.0% of all units):
| This neighborhood: | $2,616,730 |
| Minneapolis: | $353,466 |
Average estimated '21 value of housing units in 3-to-4-unit structures (7.3% of all units):
| Lowry Hill East: | $856,288 |
| city: | $335,939 |
Average estimated '21 value of housing units in 5-or-more-unit structures (48.6% of all units):
| Lowry Hill East: | $227,682 |
| Minneapolis: | $317,891 |
Most popular occupations of males: sales and office occupations (21.0%); business and financial operations occupations (18.4%); computer and mathematical occupations (16.0%); management occupations (except farmers) (12.7%); architecture and engineering occupations (8.8%); service occupations (6.2%); education, training, and library occupations (4.1%)
Most popular occupations of females: sales and office occupations (19.9%); business and financial operations occupations (14.2%); service occupations (13.2%); community and social services occupations (11.9%); arts, design, entertainment, sports, and media occupations (8.2%); education, training, and library occupations (8.0%); management occupations (except farmers) (7.5%)
Roads and streets: Bryant Ave S; Lyndale Ave S; Aldrich Ave S; Colfax Ave S; Dupont Ave S; Emerson Ave S; W 27th St; W 29th St; W 28th St; W 26th St; W Lake St; Fremont Ave S; W 25th St; Girard Ave S; W 24th St; Lagoon Ave; W 22nd St; Co Rd 5 (W Franklin Ave); Hennepin Ave S.
Lowry Hill East neighborhood detailed profile
Lyndale neighborhood in Minneapolis statistics: (Find on map)
Area: 0.483 square miles
Population: 7,674
Population density:
Median household income in 2021:
Median rent in in 2021:
Male vs Females
Median age
Housing prices:
Average estimated value of detached houses in 2021 (17.0% of all units):
Average estimated value of townhouses or other attached units in 2021 (8.4% of all units):
Average estimated value of housing units in 2-unit structures in 2021 (13.6% of all units):
Average estimated '21 value of housing units in 3-to-4-unit structures (11.2% of all units):
Average estimated '21 value of housing units in 5-or-more-unit structures (32.3% of all units):
Most popular occupations of males: service occupations (18.1%); sales and office occupations (18.1%); computer and mathematical occupations (12.7%); business and financial operations occupations (10.8%); material moving occupations (6.9%); production occupations (6.4%); management occupations (except farmers) (5.0%)
Most popular occupations of females: service occupations (21.3%); sales and office occupations (19.3%); education, training, and library occupations (12.2%); management occupations (except farmers) (11.2%); arts, design, entertainment, sports, and media occupations (11.2%); healthcare practitioners and technical occupations (10.5%); business and financial operations occupations (6.5%)
Limited-access highways (interstate or state) in this neighborhood: I- 35 (State Hwy 65).
Roads and streets: W 35th St; W 34th St; W 33rd St; Stevens Ave S; 1st Ave S; W 32nd St; Co Rd 52 (Nicollet Ave); Grand Ave; W 31st St; Harriet Ave S; Pillsbury Ave S; Blaisdell Ave S; Pleasant Ave S; W 36th St; Garfield Ave S; E 35th St; E 31st St; E 36th St; E 34th St; E 33rd St; E 32nd St; Garfield Ave.
Lyndale neighborhood detailed profile
Area: 0.483 square miles
Population: 7,674
Population density:
| Lyndale: | 15,893 people per square mile |
| Minneapolis: | 7,749 people per square mile |
Median household income in 2021:
| Lyndale: | $58,566 |
| Minneapolis: | $69,397 |
Median rent in in 2021:
| Lyndale: | $953 |
| Minneapolis: | $1,138 |
Male vs Females
| Males: | 3,814 |
| Females: | 3,859 |
Median age
| Males: | 31.1 years |
| Females: | 30.8 years |
Housing prices:
Average estimated value of detached houses in 2021 (17.0% of all units):
| Lyndale: | $543,723 |
| Minneapolis: | $398,431 |
Average estimated value of townhouses or other attached units in 2021 (8.4% of all units):
| This neighborhood: | $97,232 |
| city: | $376,360 |
Average estimated value of housing units in 2-unit structures in 2021 (13.6% of all units):
| This neighborhood: | $432,313 |
| Minneapolis: | $353,466 |
Average estimated '21 value of housing units in 3-to-4-unit structures (11.2% of all units):
| Lyndale: | $232,702 |
| city: | $335,939 |
Average estimated '21 value of housing units in 5-or-more-unit structures (32.3% of all units):
| Lyndale: | $75,377 |
| Minneapolis: | $317,891 |
Most popular occupations of males: service occupations (18.1%); sales and office occupations (18.1%); computer and mathematical occupations (12.7%); business and financial operations occupations (10.8%); material moving occupations (6.9%); production occupations (6.4%); management occupations (except farmers) (5.0%)
Most popular occupations of females: service occupations (21.3%); sales and office occupations (19.3%); education, training, and library occupations (12.2%); management occupations (except farmers) (11.2%); arts, design, entertainment, sports, and media occupations (11.2%); healthcare practitioners and technical occupations (10.5%); business and financial operations occupations (6.5%)
Limited-access highways (interstate or state) in this neighborhood: I- 35 (State Hwy 65).
Roads and streets: W 35th St; W 34th St; W 33rd St; Stevens Ave S; 1st Ave S; W 32nd St; Co Rd 52 (Nicollet Ave); Grand Ave; W 31st St; Harriet Ave S; Pillsbury Ave S; Blaisdell Ave S; Pleasant Ave S; W 36th St; Garfield Ave S; E 35th St; E 31st St; E 36th St; E 34th St; E 33rd St; E 32nd St; Garfield Ave.
Lyndale neighborhood detailed profile
Lynnhurst neighborhood in Minneapolis statistics: (Find on map)
Area: 0.995 square miles
Population: 7,189
Population density:
Median household income in 2021:
Median rent in in 2021:
Male vs Females
Median age
Housing prices:
Average estimated value of detached houses in 2021 (84.5% of all units):
Average estimated value of housing units in 2-unit structures in 2021 (13.9% of all units):
Most popular occupations of males: management occupations (except farmers) (24.6%); sales and office occupations (12.6%); legal occupations (10.4%); healthcare practitioners and technical occupations (9.9%); computer and mathematical occupations (9.8%); business and financial operations occupations (8.5%); education, training, and library occupations (4.7%)
Most popular occupations of females: education, training, and library occupations (16.1%); sales and office occupations (14.7%); healthcare practitioners and technical occupations (13.2%); management occupations (except farmers) (12.3%); life, physical, and social science occupations (11.9%); business and financial operations occupations (11.6%); service occupations (4.4%)
Roads and streets: W Minnehaha Pkwy; W 53rd St; W 54th St; W 50th St; W 49th St; W 51st St; Dupont Ave S; Bryant Ave S; Emerson Ave S; Girard Ave S; Aldrich Ave S; Morgan Ave S; Colfax Ave S; Fremont Ave S; W 47th St; James Ave S; E Lake Harriet Pkwy; W 48th St; Knox Ave S; Logan Ave S; Oliver Ave S; Humboldt Ave S; W 52nd St; Irving Ave S; Newton Ave S; W 46th St; E Lake Harriet Blvd; Park Dr; Lyndale Ave S.
Other features: Minnehaha Crk.
Lynnhurst neighborhood detailed profile
Area: 0.995 square miles
Population: 7,189
Population density:
| Lynnhurst: | 7,226 people per square mile |
| Minneapolis: | 7,749 people per square mile |
Median household income in 2021:
| Lynnhurst: | $162,967 |
| Minneapolis: | $69,397 |
Median rent in in 2021:
| Lynnhurst: | $1,305 |
| Minneapolis: | $1,138 |
Male vs Females
| Males: | 3,689 |
| Females: | 3,500 |
Median age
| Males: | 37.8 years |
| Females: | 38.9 years |
Housing prices:
Average estimated value of detached houses in 2021 (84.5% of all units):
| Lynnhurst: | $536,698 |
| Minneapolis: | $398,431 |
Average estimated value of housing units in 2-unit structures in 2021 (13.9% of all units):
| This neighborhood: | $328,486 |
| Minneapolis: | $353,466 |
Most popular occupations of males: management occupations (except farmers) (24.6%); sales and office occupations (12.6%); legal occupations (10.4%); healthcare practitioners and technical occupations (9.9%); computer and mathematical occupations (9.8%); business and financial operations occupations (8.5%); education, training, and library occupations (4.7%)
Most popular occupations of females: education, training, and library occupations (16.1%); sales and office occupations (14.7%); healthcare practitioners and technical occupations (13.2%); management occupations (except farmers) (12.3%); life, physical, and social science occupations (11.9%); business and financial operations occupations (11.6%); service occupations (4.4%)
Roads and streets: W Minnehaha Pkwy; W 53rd St; W 54th St; W 50th St; W 49th St; W 51st St; Dupont Ave S; Bryant Ave S; Emerson Ave S; Girard Ave S; Aldrich Ave S; Morgan Ave S; Colfax Ave S; Fremont Ave S; W 47th St; James Ave S; E Lake Harriet Pkwy; W 48th St; Knox Ave S; Logan Ave S; Oliver Ave S; Humboldt Ave S; W 52nd St; Irving Ave S; Newton Ave S; W 46th St; E Lake Harriet Blvd; Park Dr; Lyndale Ave S.
Other features: Minnehaha Crk.
Lynnhurst neighborhood detailed profile
Marcy-Holmes neighborhood in Minneapolis statistics: (Find on map)
Area: 0.825 square miles
Population: 13,608
Population density:
Median household income in 2021:
Median rent in in 2021:
Male vs Females
Median age
Housing prices:
Average estimated value of detached houses in 2021 (5.8% of all units):
Average estimated value of townhouses or other attached units in 2021 (3.5% of all units):
Average estimated value of housing units in 2-unit structures in 2021 (6.5% of all units):
Average estimated '21 value of housing units in 5-or-more-unit structures (53.1% of all units):
Most popular occupations of males: sales and office occupations (16.6%); education, training, and library occupations (12.7%); service occupations (11.5%); management occupations (except farmers) (9.0%); healthcare practitioners and technical occupations (8.6%); architecture and engineering occupations (7.8%); business and financial operations occupations (7.2%)
Most popular occupations of females: service occupations (25.7%); education, training, and library occupations (15.6%); sales and office occupations (15.2%); management occupations (except farmers) (11.5%); business and financial operations occupations (7.7%); healthcare practitioners and technical occupations (6.5%); arts, design, entertainment, sports, and media occupations (6.4%)
Limited-access highways (interstate or state) in this neighborhood: I- 35.
Roads and streets: University Ave SE; 8th St SE; 4th St SE; 6th St SE; 5th St SE; 7th St SE; 2nd St SE; 10th Ave SE; 6th Ave SE; Main St SE; 5th Ave SE; 11th Ave SE; 7th Ave SE; 2nd Ave SE; 9th St SE; 3rd Ave SE; 8th Ave SE; 12th Ave SE; 14th Ave SE; 15th Ave SE; 13th Ave SE; E Hennepin Ave; 4th Ave SE; Harrison St NE; 9th Ave SE; 3rd Ave.
Railroad features: Burlington Northern Santa Fe Rlwy.
Marcy-Holmes neighborhood detailed profile
Area: 0.825 square miles
Population: 13,608
Population density:
| Marcy-Holmes: | 16,486 people per square mile |
| Minneapolis: | 7,749 people per square mile |
Median household income in 2021:
| Marcy-Holmes: | $62,090 |
| Minneapolis: | $69,397 |
Median rent in in 2021:
| Marcy-Holmes: | $1,156 |
| Minneapolis: | $1,138 |
Male vs Females
| Males: | 6,872 |
| Females: | 6,736 |
Median age
| Males: | 32.9 years |
| Females: | 31.9 years |
Housing prices:
Average estimated value of detached houses in 2021 (5.8% of all units):
| Marcy-Holmes: | $267,765 |
| Minneapolis: | $398,431 |
Average estimated value of townhouses or other attached units in 2021 (3.5% of all units):
| This neighborhood: | $698,088 |
| city: | $376,360 |
Average estimated value of housing units in 2-unit structures in 2021 (6.5% of all units):
| This neighborhood: | $280,758 |
| Minneapolis: | $353,466 |
Average estimated '21 value of housing units in 5-or-more-unit structures (53.1% of all units):
| Marcy-Holmes: | $446,269 |
| Minneapolis: | $317,891 |
Most popular occupations of males: sales and office occupations (16.6%); education, training, and library occupations (12.7%); service occupations (11.5%); management occupations (except farmers) (9.0%); healthcare practitioners and technical occupations (8.6%); architecture and engineering occupations (7.8%); business and financial operations occupations (7.2%)
Most popular occupations of females: service occupations (25.7%); education, training, and library occupations (15.6%); sales and office occupations (15.2%); management occupations (except farmers) (11.5%); business and financial operations occupations (7.7%); healthcare practitioners and technical occupations (6.5%); arts, design, entertainment, sports, and media occupations (6.4%)
Limited-access highways (interstate or state) in this neighborhood: I- 35.
Roads and streets: University Ave SE; 8th St SE; 4th St SE; 6th St SE; 5th St SE; 7th St SE; 2nd St SE; 10th Ave SE; 6th Ave SE; Main St SE; 5th Ave SE; 11th Ave SE; 7th Ave SE; 2nd Ave SE; 9th St SE; 3rd Ave SE; 8th Ave SE; 12th Ave SE; 14th Ave SE; 15th Ave SE; 13th Ave SE; E Hennepin Ave; 4th Ave SE; Harrison St NE; 9th Ave SE; 3rd Ave.
Railroad features: Burlington Northern Santa Fe Rlwy.
Marcy-Holmes neighborhood detailed profile
Marshall Terrace neighborhood in Minneapolis statistics: (Find on map)
Area: 0.711 square miles
Population: 1,436
Population density:
Median household income in 2021:
Median rent in in 2021:
Male vs Females
Median age
Average estimated value of detached houses in 2021 (46.1% of all units):
Most popular occupations of males: sales and office occupations (18.6%); material moving occupations (16.2%); management occupations (except farmers) (12.1%); service occupations (10.5%); business and financial operations occupations (9.3%); computer and mathematical occupations (5.1%); construction, extraction, and maintenance occupations (4.9%)
Most popular occupations of females: management occupations (except farmers) (21.7%); sales and office occupations (21.4%); healthcare practitioners and technical occupations (13.4%); service occupations (9.9%); business and financial operations occupations (6.3%); education, training, and library occupations (6.1%); material moving occupations (5.9%)
Highways in this neighborhood: State Hwy 47 (University Ave NE).
Roads and streets: California St NE; Co Rd 23 (Marshall St NE); NE Grand St; Co Rd 153 (Lowry Ave NE); Randolph St NE; 27th Ave NE; 26th Ave NE; 31st Ave NE; 30th Ave NE; 29th Ave NE; 4th St NE; 2nd St NE; 28th Ave NE; NE Main St; 26th 1/2 Ave NE; 3rd St NE; NE Columbia Ave; Lowry Ave N (Co Rd 153); 32nd Ave NE.
Railroad features: Burlington Northern Santa Fe Rlwy; Canadian Pacific Rlwy.
Marshall Terrace neighborhood detailed profile
Area: 0.711 square miles
Population: 1,436
Population density:
| Marshall Terrace: | 2,021 people per square mile |
| Minneapolis: | 7,749 people per square mile |
Median household income in 2021:
| Marshall Terrace: | $67,911 |
| Minneapolis: | $69,397 |
Median rent in in 2021:
| Marshall Terrace: | $903 |
| Minneapolis: | $1,138 |
Male vs Females
| Males: | 621 |
| Females: | 814 |
Median age
| Males: | 32.7 years |
| Females: | 34.5 years |
Average estimated value of detached houses in 2021 (46.1% of all units):
| Marshall Terrace: | $243,945 |
| Minneapolis: | $398,431 |
Most popular occupations of males: sales and office occupations (18.6%); material moving occupations (16.2%); management occupations (except farmers) (12.1%); service occupations (10.5%); business and financial operations occupations (9.3%); computer and mathematical occupations (5.1%); construction, extraction, and maintenance occupations (4.9%)
Most popular occupations of females: management occupations (except farmers) (21.7%); sales and office occupations (21.4%); healthcare practitioners and technical occupations (13.4%); service occupations (9.9%); business and financial operations occupations (6.3%); education, training, and library occupations (6.1%); material moving occupations (5.9%)
Highways in this neighborhood: State Hwy 47 (University Ave NE).
Roads and streets: California St NE; Co Rd 23 (Marshall St NE); NE Grand St; Co Rd 153 (Lowry Ave NE); Randolph St NE; 27th Ave NE; 26th Ave NE; 31st Ave NE; 30th Ave NE; 29th Ave NE; 4th St NE; 2nd St NE; 28th Ave NE; NE Main St; 26th 1/2 Ave NE; 3rd St NE; NE Columbia Ave; Lowry Ave N (Co Rd 153); 32nd Ave NE.
Railroad features: Burlington Northern Santa Fe Rlwy; Canadian Pacific Rlwy.
Marshall Terrace neighborhood detailed profile
Mckinley neighborhood in Minneapolis statistics: (Find on map)
Area: 0.607 square miles
Population: 6,169
Population density:
Median household income in 2021:
Median rent in in 2021:
Male vs Females
Median age
Most popular occupations of males: production occupations (29.4%); service occupations (24.7%); material moving occupations (8.5%); construction, extraction, and maintenance occupations (7.3%); healthcare practitioners and technical occupations (6.6%); sales and office occupations (6.0%); arts, design, entertainment, sports, and media occupations (4.6%)
Most popular occupations of females: sales and office occupations (48.5%); service occupations (13.8%); production occupations (11.3%); healthcare practitioners and technical occupations (9.2%); education, training, and library occupations (7.0%); transportation occupations (6.3%); management occupations (except farmers) (1.1%)
Limited-access highways (interstate or state) in this neighborhood: I- 94 (US Hwy 52).
Roads and streets: 33rd Ave N; 36th Ave N; N 4th St; 35th Ave N; 34th Ave N; 37th Ave N; Bryant Ave N; Co Rd 152 (Washington Ave N); Colfax Ave N; 6th St N (N 6th St); Lyndale Ave N; Aldrich Ave N; N 2nd St; N 3rd St.
Railroad features: Canadian Pacific Rlwy.
Mckinley neighborhood detailed profile
Area: 0.607 square miles
Population: 6,169
Population density:
| Mckinley: | 10,167 people per square mile |
| Minneapolis: | 7,749 people per square mile |
Median household income in 2021:
| Mckinley: | $49,877 |
| Minneapolis: | $69,397 |
Median rent in in 2021:
| Mckinley: | $1,023 |
| Minneapolis: | $1,138 |
Male vs Females
| Males: | 3,073 |
| Females: | 3,095 |
Median age
| Males: | 30.3 years |
| Females: | 35.2 years |
Most popular occupations of males: production occupations (29.4%); service occupations (24.7%); material moving occupations (8.5%); construction, extraction, and maintenance occupations (7.3%); healthcare practitioners and technical occupations (6.6%); sales and office occupations (6.0%); arts, design, entertainment, sports, and media occupations (4.6%)
Most popular occupations of females: sales and office occupations (48.5%); service occupations (13.8%); production occupations (11.3%); healthcare practitioners and technical occupations (9.2%); education, training, and library occupations (7.0%); transportation occupations (6.3%); management occupations (except farmers) (1.1%)
Limited-access highways (interstate or state) in this neighborhood: I- 94 (US Hwy 52).
Roads and streets: 33rd Ave N; 36th Ave N; N 4th St; 35th Ave N; 34th Ave N; 37th Ave N; Bryant Ave N; Co Rd 152 (Washington Ave N); Colfax Ave N; 6th St N (N 6th St); Lyndale Ave N; Aldrich Ave N; N 2nd St; N 3rd St.
Railroad features: Canadian Pacific Rlwy.
Mckinley neighborhood detailed profile
Medicine Lake neighborhood in Minneapolis statistics: (Find on map)
Area: 0.314 square miles
Population: 305
Population density:
Median household income in 2021:
Median rent in in 2021:
Male vs Females
Median age
Average estimated value of detached houses in 2021 (54.4% of all units):
Most popular occupations of males: management occupations (except farmers) (23.0%); sales and office occupations (18.5%); service occupations (12.1%); computer and mathematical occupations (11.1%); business and financial operations occupations (9.8%); arts, design, entertainment, sports, and media occupations (6.2%); community and social services occupations (4.4%)
Most popular occupations of females: sales and office occupations (22.2%); service occupations (15.7%); education, training, and library occupations (14.5%); management occupations (except farmers) (12.8%); business and financial operations occupations (11.1%); arts, design, entertainment, sports, and media occupations (6.3%); healthcare practitioners and technical occupations (4.0%)
Roads and streets: Peninsula Rd; Co Rd 73 (S Shore Dr); Kaiser Ave; Columbia Ave N; Colonial Cir; 15th Ave N.
Railroad features: Union Pacific RR.
Medicine Lake neighborhood detailed profile
Area: 0.314 square miles
Population: 305
Population density:
| Medicine Lake: | 971 people per square mile |
| Minneapolis: | 7,749 people per square mile |
Median household income in 2021:
| Medicine Lake: | $100,071 |
| Minneapolis: | $69,397 |
Median rent in in 2021:
| Medicine Lake: | $1,699 |
| Minneapolis: | $1,138 |
Male vs Females
| Males: | 137 |
| Females: | 168 |
Median age
| Males: | 44.5 years |
| Females: | 50.1 years |
Average estimated value of detached houses in 2021 (54.4% of all units):
| Medicine Lake: | $415,354 |
| Minneapolis: | $398,431 |
Most popular occupations of males: management occupations (except farmers) (23.0%); sales and office occupations (18.5%); service occupations (12.1%); computer and mathematical occupations (11.1%); business and financial operations occupations (9.8%); arts, design, entertainment, sports, and media occupations (6.2%); community and social services occupations (4.4%)
Most popular occupations of females: sales and office occupations (22.2%); service occupations (15.7%); education, training, and library occupations (14.5%); management occupations (except farmers) (12.8%); business and financial operations occupations (11.1%); arts, design, entertainment, sports, and media occupations (6.3%); healthcare practitioners and technical occupations (4.0%)
Roads and streets: Peninsula Rd; Co Rd 73 (S Shore Dr); Kaiser Ave; Columbia Ave N; Colonial Cir; 15th Ave N.
Railroad features: Union Pacific RR.
Medicine Lake neighborhood detailed profile
Mid-City Industrial neighborhood in Minneapolis statistics: (Find on map)
Area: 1.061 square miles
Population: 6,847
Population density:
Median household income in 2021:
Median rent in in 2021:
Male vs Females
Median age
Housing prices:
Average estimated value of detached houses in 2021 (44.9% of all units):
Average estimated value of housing units in 2-unit structures in 2021 (39.6% of all units):
Most popular occupations of males: management occupations (except farmers) (16.1%); sales and office occupations (14.8%); service occupations (13.2%); construction, extraction, and maintenance occupations (10.0%); transportation occupations (8.9%); business and financial operations occupations (6.1%); healthcare practitioners and technical occupations (5.6%)
Most popular occupations of females: service occupations (41.4%); sales and office occupations (26.1%); management occupations (except farmers) (14.5%); healthcare practitioners and technical occupations (9.6%); business and financial operations occupations (4.9%); legal occupations (4.1%); computer and mathematical occupations (2.9%)
Limited-access highways (interstate or state) in this neighborhood: I- 35.
Roads and streets: Broadway St NE; E Hennepin Ave; Stinson Blvd (Co Rd 27); Kennedy St NE; Industrial Blvd NE; Winter St NE; Hoover St NE; Traffic St NE; Spring St NE (Kennedy St NE); Summer St NE; Taft St NE; Johnson St NE; Cleveland St NE; Co Rd 88 (New Brighton Blvd); Harding St NE; Godward St NE; Arthur St NE; 33rd Ave SE; Roosevelt St NE; NE Wilson St; Broadway Rd NE; McKinley Pl NE; R St NE; Delano St NE; Ulysses St NE; Coolidge St NE; St Anthony Blvd; 14th Ave SE.
Railroad features: Canadian Pacific Rlwy; Burlington Northern Santa Fe Rlwy.
Mid-City Industrial neighborhood detailed profile
Area: 1.061 square miles
Population: 6,847
Population density:
| Mid-City Industrial: | 6,456 people per square mile |
| Minneapolis: | 7,749 people per square mile |
Median household income in 2021:
| Mid-City Industrial: | $73,684 |
| Minneapolis: | $69,397 |
Median rent in in 2021:
| Mid-City Industrial: | $1,271 |
| Minneapolis: | $1,138 |
Male vs Females
| Males: | 4,153 |
| Females: | 2,693 |
Median age
| Males: | 30.1 years |
| Females: | 26.3 years |
Housing prices:
Average estimated value of detached houses in 2021 (44.9% of all units):
| Mid-City Industrial: | $247,259 |
| Minneapolis: | $398,431 |
Average estimated value of housing units in 2-unit structures in 2021 (39.6% of all units):
| This neighborhood: | $280,758 |
| Minneapolis: | $353,466 |
Most popular occupations of males: management occupations (except farmers) (16.1%); sales and office occupations (14.8%); service occupations (13.2%); construction, extraction, and maintenance occupations (10.0%); transportation occupations (8.9%); business and financial operations occupations (6.1%); healthcare practitioners and technical occupations (5.6%)
Most popular occupations of females: service occupations (41.4%); sales and office occupations (26.1%); management occupations (except farmers) (14.5%); healthcare practitioners and technical occupations (9.6%); business and financial operations occupations (4.9%); legal occupations (4.1%); computer and mathematical occupations (2.9%)
Limited-access highways (interstate or state) in this neighborhood: I- 35.
Roads and streets: Broadway St NE; E Hennepin Ave; Stinson Blvd (Co Rd 27); Kennedy St NE; Industrial Blvd NE; Winter St NE; Hoover St NE; Traffic St NE; Spring St NE (Kennedy St NE); Summer St NE; Taft St NE; Johnson St NE; Cleveland St NE; Co Rd 88 (New Brighton Blvd); Harding St NE; Godward St NE; Arthur St NE; 33rd Ave SE; Roosevelt St NE; NE Wilson St; Broadway Rd NE; McKinley Pl NE; R St NE; Delano St NE; Ulysses St NE; Coolidge St NE; St Anthony Blvd; 14th Ave SE.
Railroad features: Canadian Pacific Rlwy; Burlington Northern Santa Fe Rlwy.
Mid-City Industrial neighborhood detailed profile
Minnehaha neighborhood in Minneapolis statistics: (Find on map)
Area: 0.558 square miles
Population: 5,029
Population density:
Median household income in 2021:
Median rent in in 2021:
Male vs Females
Median age
Average estimated value of detached houses in 2021 (70.0% of all units):
Most popular occupations of males: business and financial operations occupations (14.7%); sales and office occupations (14.6%); education, training, and library occupations (14.2%); construction, extraction, and maintenance occupations (9.5%); production occupations (8.5%); management occupations (except farmers) (7.2%); service occupations (6.3%)
Most popular occupations of females: sales and office occupations (27.7%); management occupations (except farmers) (15.2%); business and financial operations occupations (10.6%); healthcare practitioners and technical occupations (9.9%); education, training, and library occupations (9.7%); community and social services occupations (6.6%); computer and mathematical occupations (4.3%)
Highways in this neighborhood: Hiawatha Ave (State Hwy 55).
Roads and streets: E 54th St; E 53rd St; E 52nd St; E 51st St; E 50th St; 35th Ave S; 36th Ave S; 37th Ave S; 38th Ave S; E 49th St; 42nd Ave S; 39th Ave S; 40th Ave S; 41st Ave S; 43rd Ave S; 44th Ave S; 45th Ave S; Hiawatha Ln; 46th Ave S; E Minnehaha Pkwy; Riverview Rd; 47th Ave S; 48th Ave S.
Other features: Minnehaha Crk.
Minnehaha neighborhood detailed profile
Area: 0.558 square miles
Population: 5,029
Population density:
| Minnehaha: | 9,010 people per square mile |
| Minneapolis: | 7,749 people per square mile |
Median household income in 2021:
| Minnehaha: | $89,435 |
| Minneapolis: | $69,397 |
Median rent in in 2021:
| Minnehaha: | $1,211 |
| Minneapolis: | $1,138 |
Male vs Females
| Males: | 2,127 |
| Females: | 2,901 |
Median age
| Males: | 41.7 years |
| Females: | 43.6 years |
Average estimated value of detached houses in 2021 (70.0% of all units):
| Minnehaha: | $256,365 |
| Minneapolis: | $398,431 |
Most popular occupations of males: business and financial operations occupations (14.7%); sales and office occupations (14.6%); education, training, and library occupations (14.2%); construction, extraction, and maintenance occupations (9.5%); production occupations (8.5%); management occupations (except farmers) (7.2%); service occupations (6.3%)
Most popular occupations of females: sales and office occupations (27.7%); management occupations (except farmers) (15.2%); business and financial operations occupations (10.6%); healthcare practitioners and technical occupations (9.9%); education, training, and library occupations (9.7%); community and social services occupations (6.6%); computer and mathematical occupations (4.3%)
Highways in this neighborhood: Hiawatha Ave (State Hwy 55).
Roads and streets: E 54th St; E 53rd St; E 52nd St; E 51st St; E 50th St; 35th Ave S; 36th Ave S; 37th Ave S; 38th Ave S; E 49th St; 42nd Ave S; 39th Ave S; 40th Ave S; 41st Ave S; 43rd Ave S; 44th Ave S; 45th Ave S; Hiawatha Ln; 46th Ave S; E Minnehaha Pkwy; Riverview Rd; 47th Ave S; 48th Ave S.
Other features: Minnehaha Crk.
Minnehaha neighborhood detailed profile
Morris Park neighborhood in Minneapolis statistics: (Find on map)
Area: 0.763 square miles
Population: 3,896
Population density:
Median household income in 2021:
Median rent in in 2021:
Male vs Females
Median age
Average estimated value of detached houses in 2021 (89.8% of all units):
Most popular occupations of males: production occupations (14.2%); transportation occupations (13.2%); sales and office occupations (12.6%); management occupations (except farmers) (9.9%); computer and mathematical occupations (9.0%); business and financial operations occupations (6.8%); construction, extraction, and maintenance occupations (6.3%)
Most popular occupations of females: sales and office occupations (34.6%); service occupations (25.8%); management occupations (except farmers) (8.2%); healthcare practitioners and technical occupations (7.8%); business and financial operations occupations (5.5%); arts, design, entertainment, sports, and media occupations (5.3%); education, training, and library occupations (4.5%)
Highways in this neighborhood: Crosstown Hwy (State Hwy 62).
Roads and streets: E 58th St; E 56th St; E 57th St; E 55th St; Military Hwy; 42nd Ave S; 43rd Ave S; 45th Ave S; 46th Ave S; 44th Ave S; 40th Ave S; 38th Ave S; 35th Ave S; 36th Ave S; 37th Ave S; Boardman St; E 59th St; 41st Ave S; 39th Ave S.
Morris Park neighborhood detailed profile
Area: 0.763 square miles
Population: 3,896
Population density:
| Morris Park: | 5,104 people per square mile |
| Minneapolis: | 7,749 people per square mile |
Median household income in 2021:
| Morris Park: | $85,739 |
| Minneapolis: | $69,397 |
Median rent in in 2021:
| Morris Park: | $1,042 |
| Minneapolis: | $1,138 |
Male vs Females
| Males: | 1,949 |
| Females: | 1,946 |
Median age
| Males: | 38.3 years |
| Females: | 38.1 years |
Average estimated value of detached houses in 2021 (89.8% of all units):
| Morris Park: | $247,049 |
| Minneapolis: | $398,431 |
Most popular occupations of males: production occupations (14.2%); transportation occupations (13.2%); sales and office occupations (12.6%); management occupations (except farmers) (9.9%); computer and mathematical occupations (9.0%); business and financial operations occupations (6.8%); construction, extraction, and maintenance occupations (6.3%)
Most popular occupations of females: sales and office occupations (34.6%); service occupations (25.8%); management occupations (except farmers) (8.2%); healthcare practitioners and technical occupations (7.8%); business and financial operations occupations (5.5%); arts, design, entertainment, sports, and media occupations (5.3%); education, training, and library occupations (4.5%)
Highways in this neighborhood: Crosstown Hwy (State Hwy 62).
Roads and streets: E 58th St; E 56th St; E 57th St; E 55th St; Military Hwy; 42nd Ave S; 43rd Ave S; 45th Ave S; 46th Ave S; 44th Ave S; 40th Ave S; 38th Ave S; 35th Ave S; 36th Ave S; 37th Ave S; Boardman St; E 59th St; 41st Ave S; 39th Ave S.
Morris Park neighborhood detailed profile
Near North neighborhood in Minneapolis statistics: (Find on map)
Area: 1.136 square miles
Population: 13,755
Population density:
Median household income in 2021:
Median rent in in 2021:
Male vs Females
Median age
Housing prices:
Average estimated value of detached houses in 2021 (43.3% of all units):
Average estimated value of townhouses or other attached units in 2021 (7.1% of all units):
Average estimated value of housing units in 2-unit structures in 2021 (30.1% of all units):
Average estimated '21 value of housing units in 5-or-more-unit structures (18.6% of all units):
Most popular occupations of males: service occupations (27.4%); sales and office occupations (18.6%); production occupations (15.5%); management occupations (except farmers) (9.7%); material moving occupations (5.0%); arts, design, entertainment, sports, and media occupations (4.9%); transportation occupations (4.6%)
Most popular occupations of females: service occupations (36.0%); sales and office occupations (20.3%); education, training, and library occupations (8.3%); production occupations (7.4%); management occupations (except farmers) (5.9%); material moving occupations (5.0%); business and financial operations occupations (4.4%)
Limited-access highways (interstate or state) in this neighborhood: US Hwy 52 (I- 94).
Highways in this neighborhood: State Hwy 55 (Olson Memorial Hwy).
Roads and streets: Plymouth Ave N; W Broadway Ave; 14th Ave N; 16th Ave N; 17th Ave N; 18th Ave N; N Emerson Ave; 15th Ave N; Irving Ave N; 12th Ave N; Lyndale Ave N; Elwood Ave N; Fremont Ave N; 8th Ave N; W River Rd N; Aldrich Ave N; 11th Ave N; Dupont Ave N; Girard Ave N; Oak Park Ave N; Humboldt Ave N; Bryant Ave N; N 2nd St; Washington Ave N; James Ave N; Newton Ave N; Oliver Ave N; Morgan Ave N; Logan Ave N; N 7th St; 7th Ave N; Hall Ln; Knox Ave N; 18th 1/2 Ave N; Thomas Pl N; 3rd St N; Boardwalk Ave; Barnes Pl; Hall Curve; Ojibway St N; Lyn-Park Ave N; Harry Davis Ln; 13th Ave N; 19th Ave N; Dakota Cir; Banneker Ave N; Lyn-Curve Ave N; 12th 1/2 Ave N; N 6th St S; N 4th St; Skyline Curve Ave; Lyn-Park Cir N; Lyn-Park Ln N; Boardwalk Pl; 5th St N; Smith Cir; Howell Dr N; New York Ave N; Givens Ln; Elizabeth Ln; Printice Ln (Prentice Ln); Rawlins Cir N; Plymouth Ave NE; Van White Ln.
Railroad features: Burlington Northern Santa Fe Rlwy.
Near North neighborhood detailed profile
Area: 1.136 square miles
Population: 13,755
Population density:
| Near North: | 12,110 people per square mile |
| Minneapolis: | 7,749 people per square mile |
Median household income in 2021:
| Near North: | $50,583 |
| Minneapolis: | $69,397 |
Median rent in in 2021:
| Near North: | $1,067 |
| Minneapolis: | $1,138 |
Male vs Females
| Males: | 6,998 |
| Females: | 6,757 |
Median age
| Males: | 26.1 years |
| Females: | 29.6 years |
Housing prices:
Average estimated value of detached houses in 2021 (43.3% of all units):
| Near North: | $183,702 |
| Minneapolis: | $398,431 |
Average estimated value of townhouses or other attached units in 2021 (7.1% of all units):
| This neighborhood: | $252,767 |
| city: | $376,360 |
Average estimated value of housing units in 2-unit structures in 2021 (30.1% of all units):
| This neighborhood: | $298,296 |
| Minneapolis: | $353,466 |
Average estimated '21 value of housing units in 5-or-more-unit structures (18.6% of all units):
| Near North: | $283,762 |
| Minneapolis: | $317,891 |
Most popular occupations of males: service occupations (27.4%); sales and office occupations (18.6%); production occupations (15.5%); management occupations (except farmers) (9.7%); material moving occupations (5.0%); arts, design, entertainment, sports, and media occupations (4.9%); transportation occupations (4.6%)
Most popular occupations of females: service occupations (36.0%); sales and office occupations (20.3%); education, training, and library occupations (8.3%); production occupations (7.4%); management occupations (except farmers) (5.9%); material moving occupations (5.0%); business and financial operations occupations (4.4%)
Limited-access highways (interstate or state) in this neighborhood: US Hwy 52 (I- 94).
Highways in this neighborhood: State Hwy 55 (Olson Memorial Hwy).
Roads and streets: Plymouth Ave N; W Broadway Ave; 14th Ave N; 16th Ave N; 17th Ave N; 18th Ave N; N Emerson Ave; 15th Ave N; Irving Ave N; 12th Ave N; Lyndale Ave N; Elwood Ave N; Fremont Ave N; 8th Ave N; W River Rd N; Aldrich Ave N; 11th Ave N; Dupont Ave N; Girard Ave N; Oak Park Ave N; Humboldt Ave N; Bryant Ave N; N 2nd St; Washington Ave N; James Ave N; Newton Ave N; Oliver Ave N; Morgan Ave N; Logan Ave N; N 7th St; 7th Ave N; Hall Ln; Knox Ave N; 18th 1/2 Ave N; Thomas Pl N; 3rd St N; Boardwalk Ave; Barnes Pl; Hall Curve; Ojibway St N; Lyn-Park Ave N; Harry Davis Ln; 13th Ave N; 19th Ave N; Dakota Cir; Banneker Ave N; Lyn-Curve Ave N; 12th 1/2 Ave N; N 6th St S; N 4th St; Skyline Curve Ave; Lyn-Park Cir N; Lyn-Park Ln N; Boardwalk Pl; 5th St N; Smith Cir; Howell Dr N; New York Ave N; Givens Ln; Elizabeth Ln; Printice Ln (Prentice Ln); Rawlins Cir N; Plymouth Ave NE; Van White Ln.
Railroad features: Burlington Northern Santa Fe Rlwy.
Near North neighborhood detailed profile
Nicollet Island neighborhood in Minneapolis statistics: (Find on map)
Area: 0.247 square miles
Population: 1,368
Population density:
Median household income in 2021:
Median rent in in 2021:
Male vs Females
Median age
Housing prices:
Average estimated value of detached houses in 2021 (6.7% of all units):
Average estimated value of townhouses or other attached units in 2021 (12.3% of all units):
Average estimated '21 value of housing units in 5-or-more-unit structures (47.8% of all units):
Most popular occupations of males: service occupations (22.1%); management occupations (except farmers) (19.3%); computer and mathematical occupations (11.7%); business and financial operations occupations (11.0%); legal occupations (6.1%); arts, design, entertainment, sports, and media occupations (6.1%); architecture and engineering occupations (5.9%)
Most popular occupations of females: sales and office occupations (19.3%); education, training, and library occupations (15.4%); business and financial operations occupations (11.2%); arts, design, entertainment, sports, and media occupations (11.2%); healthcare practitioners and technical occupations (9.6%); management occupations (except farmers) (8.6%); service occupations (8.2%)
Highways in this neighborhood: State Hwy 65 (Central Ave SE); University Ave NE (State Hwy 47); University Ave SE (State Hwy 47); State Hwy 65 (Central Ave NE).
Roads and streets: 1st Ave NE; E Hennepin Ave; Island Ave E (E Island Ave); W Island Ave; Main St SE (River Pl); Grove St; de la Salle Dr; Main St NE; 5th St NE; 4th St NE; Nicollet St; Maple Pl; Bank St SE; Power St; 6th St NE; 2nd St NE; Merriam St; Merriam Rd (Merriam St); Ortman St SE; Wilder St; Lourdes Pl; 4th St SE; 7th St NE; 2nd St SE; Eastman Ave; 5th St SE.
Railroad features: Burlington Northern Santa Fe Rlwy.
Nicollet Island neighborhood detailed profile
Area: 0.247 square miles
Population: 1,368
Population density:
| Nicollet Island: | 5,548 people per square mile |
| Minneapolis: | 7,749 people per square mile |
Median household income in 2021:
| Nicollet Island: | $72,935 |
| Minneapolis: | $69,397 |
Median rent in in 2021:
| Nicollet Island: | $1,509 |
| Minneapolis: | $1,138 |
Male vs Females
| Males: | 649 |
| Females: | 718 |
Median age
| Males: | 40.0 years |
| Females: | 38.2 years |
Housing prices:
Average estimated value of detached houses in 2021 (6.7% of all units):
| Nicollet Island: | $503,606 |
| Minneapolis: | $398,431 |
Average estimated value of townhouses or other attached units in 2021 (12.3% of all units):
| This neighborhood: | $730,410 |
| city: | $376,360 |
Average estimated '21 value of housing units in 5-or-more-unit structures (47.8% of all units):
| Nicollet Island: | $403,555 |
| Minneapolis: | $317,891 |
Most popular occupations of males: service occupations (22.1%); management occupations (except farmers) (19.3%); computer and mathematical occupations (11.7%); business and financial operations occupations (11.0%); legal occupations (6.1%); arts, design, entertainment, sports, and media occupations (6.1%); architecture and engineering occupations (5.9%)
Most popular occupations of females: sales and office occupations (19.3%); education, training, and library occupations (15.4%); business and financial operations occupations (11.2%); arts, design, entertainment, sports, and media occupations (11.2%); healthcare practitioners and technical occupations (9.6%); management occupations (except farmers) (8.6%); service occupations (8.2%)
Highways in this neighborhood: State Hwy 65 (Central Ave SE); University Ave NE (State Hwy 47); University Ave SE (State Hwy 47); State Hwy 65 (Central Ave NE).
Roads and streets: 1st Ave NE; E Hennepin Ave; Island Ave E (E Island Ave); W Island Ave; Main St SE (River Pl); Grove St; de la Salle Dr; Main St NE; 5th St NE; 4th St NE; Nicollet St; Maple Pl; Bank St SE; Power St; 6th St NE; 2nd St NE; Merriam St; Merriam Rd (Merriam St); Ortman St SE; Wilder St; Lourdes Pl; 4th St SE; 7th St NE; 2nd St SE; Eastman Ave; 5th St SE.
Railroad features: Burlington Northern Santa Fe Rlwy.
Nicollet Island neighborhood detailed profile
Nokomis neighborhood in Minneapolis statistics: (Find on map)
Area: 7.728 square miles
Population: 44,519
Population density:
Median household income in 2021:
Median rent in in 2021:
Male vs Females
Median age
Housing prices:
Average estimated value of detached houses in 2021 (78.5% of all units):
Average estimated value of townhouses or other attached units in 2021 (9.2% of all units):
Average estimated '21 value of housing units in 5-or-more-unit structures (21.1% of all units):
Most popular occupations of males: sales and office occupations (14.9%); computer and mathematical occupations (12.8%); management occupations (except farmers) (12.7%); business and financial operations occupations (9.8%); service occupations (7.1%); education, training, and library occupations (7.0%); production occupations (6.1%)
Most popular occupations of females: sales and office occupations (22.1%); management occupations (except farmers) (11.6%); business and financial operations occupations (11.4%); service occupations (11.4%); healthcare practitioners and technical occupations (10.2%); education, training, and library occupations (9.2%); arts, design, entertainment, sports, and media occupations (7.2%)
Highways in this neighborhood: Crosstown Hwy (State Hwy 62); State Hwy 55 (Hiawatha Ave); State Hwy 77.
Roads and streets: E Minnehaha Pkwy; E 58th St; E 54th St; E 53rd St; E 56th St; E 52nd St; E 57th St; E 51st St; E 55th St; E 50th St; E 49th St; E 46th St; E 44th St; Co Rd 35 (Portland Ave S); E 47th St; E 43rd St; Chicago Ave S; E 45th St; Co Rd 54 (28th Ave); Cedar Ave S; Park Ave S; 2nd Ave S; 14th Ave S; Clinton Ave S; 12th Ave S; Columbus Ave S; 34th Ave S; W Lake Nokomis Pkwy (W Nokomis Pkwy); Elliot Ave S; 11th Ave S; 10th Ave S; E Nokomis Pkwy; E 62nd St; 15th Ave S; 13th Ave S; 31st Ave S; Bloomington Ave S; 3rd Ave S; E 60th St; 29th Ave S; Woodlawn Blvd; E 48th St; 35th Ave S; Oakland Ave S; 30th Ave S; Nokomis Ave S; E 61st St; 16th Ave S; 36th Ave S; E 59th St; 38th Ave S; 32nd Ave S; 33rd Ave S; 4th Ave S; 42nd Ave S; 37th Ave S; 43rd Ave S; 17th Ave S; 5th Ave S; 40th Ave S; 44th Ave S; 18th Ave S; 39th Ave S; 27th Ave S; 45th Ave S; 41st Ave S; 46th Ave S; 26th Ave S; Crosstown Svc Rd; Boardman St; Longfellow Ave S; Edgewater Blvd; Military Hwy; 25th Ave S; Luverne Ave; Shoreview Ave; E Diamond Lake Rd; 24th Ave S; 23rd Ave S; Hampshire Dr; Chester St; Hiawatha Ln; Mondamin St; Keewaydin Pl; Weenonah Pl; Bossen Ter; Crosby Pl; 20th Ave S; 22nd Ave S; Standish Ave S; Riverview Rd; 47th Ave S; 19th Ave S; 21st Ave S; Longfellow Ave; Tarrymore Ave; Diamond Lake Ln; Nokomis Ct; E 42nd St; Roslyn Pl; E 59th 1/2 St; Nokomis Ln; Loren Dr; Sander Dr; 48th Ave S; Chateau Pl; Parkway Ct; Nokomis Pkwy; Nokomis Cir.
Other features: Minnehaha Crk.
Nokomis neighborhood detailed profile
Area: 7.728 square miles
Population: 44,519
Population density:
| Nokomis: | 5,761 people per square mile |
| Minneapolis: | 7,749 people per square mile |
Median household income in 2021:
| Nokomis: | $104,736 |
| Minneapolis: | $69,397 |
Median rent in in 2021:
| Nokomis: | $1,242 |
| Minneapolis: | $1,138 |
Male vs Females
| Males: | 21,240 |
| Females: | 23,278 |
Median age
| Males: | 38.1 years |
| Females: | 38.2 years |
Housing prices:
Average estimated value of detached houses in 2021 (78.5% of all units):
| Nokomis: | $286,053 |
| Minneapolis: | $398,431 |
Average estimated value of townhouses or other attached units in 2021 (9.2% of all units):
| This neighborhood: | $226,892 |
| city: | $376,360 |
Average estimated '21 value of housing units in 5-or-more-unit structures (21.1% of all units):
| Nokomis: | $106,700 |
| Minneapolis: | $317,891 |
Most popular occupations of males: sales and office occupations (14.9%); computer and mathematical occupations (12.8%); management occupations (except farmers) (12.7%); business and financial operations occupations (9.8%); service occupations (7.1%); education, training, and library occupations (7.0%); production occupations (6.1%)
Most popular occupations of females: sales and office occupations (22.1%); management occupations (except farmers) (11.6%); business and financial operations occupations (11.4%); service occupations (11.4%); healthcare practitioners and technical occupations (10.2%); education, training, and library occupations (9.2%); arts, design, entertainment, sports, and media occupations (7.2%)
Highways in this neighborhood: Crosstown Hwy (State Hwy 62); State Hwy 55 (Hiawatha Ave); State Hwy 77.
Roads and streets: E Minnehaha Pkwy; E 58th St; E 54th St; E 53rd St; E 56th St; E 52nd St; E 57th St; E 51st St; E 55th St; E 50th St; E 49th St; E 46th St; E 44th St; Co Rd 35 (Portland Ave S); E 47th St; E 43rd St; Chicago Ave S; E 45th St; Co Rd 54 (28th Ave); Cedar Ave S; Park Ave S; 2nd Ave S; 14th Ave S; Clinton Ave S; 12th Ave S; Columbus Ave S; 34th Ave S; W Lake Nokomis Pkwy (W Nokomis Pkwy); Elliot Ave S; 11th Ave S; 10th Ave S; E Nokomis Pkwy; E 62nd St; 15th Ave S; 13th Ave S; 31st Ave S; Bloomington Ave S; 3rd Ave S; E 60th St; 29th Ave S; Woodlawn Blvd; E 48th St; 35th Ave S; Oakland Ave S; 30th Ave S; Nokomis Ave S; E 61st St; 16th Ave S; 36th Ave S; E 59th St; 38th Ave S; 32nd Ave S; 33rd Ave S; 4th Ave S; 42nd Ave S; 37th Ave S; 43rd Ave S; 17th Ave S; 5th Ave S; 40th Ave S; 44th Ave S; 18th Ave S; 39th Ave S; 27th Ave S; 45th Ave S; 41st Ave S; 46th Ave S; 26th Ave S; Crosstown Svc Rd; Boardman St; Longfellow Ave S; Edgewater Blvd; Military Hwy; 25th Ave S; Luverne Ave; Shoreview Ave; E Diamond Lake Rd; 24th Ave S; 23rd Ave S; Hampshire Dr; Chester St; Hiawatha Ln; Mondamin St; Keewaydin Pl; Weenonah Pl; Bossen Ter; Crosby Pl; 20th Ave S; 22nd Ave S; Standish Ave S; Riverview Rd; 47th Ave S; 19th Ave S; 21st Ave S; Longfellow Ave; Tarrymore Ave; Diamond Lake Ln; Nokomis Ct; E 42nd St; Roslyn Pl; E 59th 1/2 St; Nokomis Ln; Loren Dr; Sander Dr; 48th Ave S; Chateau Pl; Parkway Ct; Nokomis Pkwy; Nokomis Cir.
Other features: Minnehaha Crk.
Nokomis neighborhood detailed profile
North Loop neighborhood in Minneapolis statistics: (Find on map)
Area: 0.837 square miles
Population: 4,896
Population density:
Median household income in 2021:
Median rent in in 2021:
Male vs Females
Median age
Housing prices:
Average estimated value of detached houses in 2021 (6.4% of all units):
Average estimated value of townhouses or other attached units in 2021 (11.3% of all units):
Average estimated '21 value of housing units in 5-or-more-unit structures (50.0% of all units):
Most popular occupations of males: service occupations (24.5%); management occupations (except farmers) (18.5%); computer and mathematical occupations (11.2%); business and financial operations occupations (11.0%); material moving occupations (8.8%); legal occupations (6.6%); arts, design, entertainment, sports, and media occupations (5.7%)
Most popular occupations of females: sales and office occupations (19.4%); education, training, and library occupations (15.0%); business and financial operations occupations (11.1%); arts, design, entertainment, sports, and media occupations (10.7%); healthcare practitioners and technical occupations (10.4%); management occupations (except farmers) (9.3%); service occupations (8.4%)
Limited-access highways (interstate or state) in this neighborhood: US Hwy 52 (I- 94); I- 394.
Highways in this neighborhood: 10th St N (State Hwy 55).
Roads and streets: 5th St N; N 2nd St; N 4th St; 4th St S; W River Pkwy; 1st St N; Washington Ave N; N 7th St; 3rd St N; 6th Ave N; 3rd Ave N; Lakeside Ave; 10th Ave N; 5th Ave N; 4th Ave N; 12th Ave N; 7th Ave N; Royalston Ave N; Glenwood Ave; Olson Memorial Hwy; Hennepin Ave; Linden Ave W; N 8th Ave; 8th Ave N; River St; Border Ave; Olson Hwy Svc Rd; 12th St N; Azine Way; Chestnut Ave; Napco Ave; Oak Lake Ave; Currie Ave W (Currie Ave); Holden St N; 11th Ave N; 2nd Ave N; 1st Ave N; Bradford Ave; N 6th Ave; Hoag Ave; 6th St N; 9th Ave N; 15th St N; 16th St N.
Railroad features: Burlington Northern Santa Fe Rlwy; Union Pacific RR (Burlington Northern Santa Fe Rlwy).
Other features: Bassett Crk.
North Loop neighborhood detailed profile
Area: 0.837 square miles
Population: 4,896
Population density:
| North Loop: | 5,846 people per square mile |
| Minneapolis: | 7,749 people per square mile |
Median household income in 2021:
| North Loop: | $80,004 |
| Minneapolis: | $69,397 |
Median rent in in 2021:
| North Loop: | $1,517 |
| Minneapolis: | $1,138 |
Male vs Females
| Males: | 2,380 |
| Females: | 2,516 |
Median age
| Males: | 41.0 years |
| Females: | 35.5 years |
Housing prices:
Average estimated value of detached houses in 2021 (6.4% of all units):
| North Loop: | $505,147 |
| Minneapolis: | $398,431 |
Average estimated value of townhouses or other attached units in 2021 (11.3% of all units):
| This neighborhood: | $735,433 |
| city: | $376,360 |
Average estimated '21 value of housing units in 5-or-more-unit structures (50.0% of all units):
| North Loop: | $409,531 |
| Minneapolis: | $317,891 |
Most popular occupations of males: service occupations (24.5%); management occupations (except farmers) (18.5%); computer and mathematical occupations (11.2%); business and financial operations occupations (11.0%); material moving occupations (8.8%); legal occupations (6.6%); arts, design, entertainment, sports, and media occupations (5.7%)
Most popular occupations of females: sales and office occupations (19.4%); education, training, and library occupations (15.0%); business and financial operations occupations (11.1%); arts, design, entertainment, sports, and media occupations (10.7%); healthcare practitioners and technical occupations (10.4%); management occupations (except farmers) (9.3%); service occupations (8.4%)
Limited-access highways (interstate or state) in this neighborhood: US Hwy 52 (I- 94); I- 394.
Highways in this neighborhood: 10th St N (State Hwy 55).
Roads and streets: 5th St N; N 2nd St; N 4th St; 4th St S; W River Pkwy; 1st St N; Washington Ave N; N 7th St; 3rd St N; 6th Ave N; 3rd Ave N; Lakeside Ave; 10th Ave N; 5th Ave N; 4th Ave N; 12th Ave N; 7th Ave N; Royalston Ave N; Glenwood Ave; Olson Memorial Hwy; Hennepin Ave; Linden Ave W; N 8th Ave; 8th Ave N; River St; Border Ave; Olson Hwy Svc Rd; 12th St N; Azine Way; Chestnut Ave; Napco Ave; Oak Lake Ave; Currie Ave W (Currie Ave); Holden St N; 11th Ave N; 2nd Ave N; 1st Ave N; Bradford Ave; N 6th Ave; Hoag Ave; 6th St N; 9th Ave N; 15th St N; 16th St N.
Railroad features: Burlington Northern Santa Fe Rlwy; Union Pacific RR (Burlington Northern Santa Fe Rlwy).
Other features: Bassett Crk.
North Loop neighborhood detailed profile
Northeast neighborhood in Minneapolis statistics: (Find on map)
Area: 7.502 square miles
Population: 43,196
Population density:
Median household income in 2021:
Median rent in in 2021:
Male vs Females
Median age
Housing prices:
Average estimated value of detached houses in 2021 (47.8% of all units):
Average estimated value of townhouses or other attached units in 2021 (7.4% of all units):
Average estimated value of housing units in 2-unit structures in 2021 (24.0% of all units):
Average estimated '21 value of housing units in 5-or-more-unit structures (24.5% of all units):
Most popular occupations of males: sales and office occupations (15.4%); service occupations (12.7%); management occupations (except farmers) (11.9%); arts, design, entertainment, sports, and media occupations (7.7%); business and financial operations occupations (7.1%); production occupations (6.3%); computer and mathematical occupations (6.0%)
Most popular occupations of females: sales and office occupations (20.2%); service occupations (17.3%); management occupations (except farmers) (13.2%); business and financial operations occupations (9.1%); education, training, and library occupations (8.7%); healthcare practitioners and technical occupations (8.6%); arts, design, entertainment, sports, and media occupations (6.0%)
Limited-access highways (interstate or state) in this neighborhood: I- 35.
Highways in this neighborhood: State Hwy 47 (University Ave NE); State Hwy 65 (Central Ave NE).
Roads and streets: Saint Anthony Blvd (Saint Anthony Pkwy); 22nd Ave NE; 23rd Ave NE; Co Rd 153 (Lowry Ave NE); Co Rd 23 (Marshall St NE); 27th Ave NE; Fillmore St NE; 26th Ave NE; 19th Ave NE; 36th Ave NE; Broadway St NE; Johnson St NE; 18th Ave NE; 5th St NE; 4th St NE; 2nd St NE; NE Cleveland St; Stinson Blvd (Co Rd 27); NE Lincoln St; 35th Ave NE; McKinley St NE; 13th Ave NE; NE Ulysses St; Buchanan St NE; 30th Ave NE; 29th Ave NE; Monroe St NE; NE Grand St; 31st Ave NE; 24th Ave NE; NE Arthur St; California St NE; Washington St NE; 32nd Ave NE; 14th Ave NE; 20th Ave NE; 28th Ave NE; Jefferson St NE; 33rd Ave NE; Quincy St NE; 3rd St NE; NE Pierce St; 15th Ave NE; 17th Ave NE; Taylor St NE; Polk St NE; Summer St NE; Pierce St NE; 6th St NE; 34th Ave NE; Main St NE; Spring St NE; Hayes St NE; NE Benjamin St; 8th Ave NE; Ridgeway Rd (Ridgeway Pkwy); NE Polk St; Columbia Pkwy; 3rd Ave NE; Benjamin St NE (NE Benjamin St); NE Buchanan St; NE Tyler St; 16th Ave NE; 36th 1/2 Ave NE; Adams St NE; Brighton Ave NE; Madison St NE; NE Taylor St; Garfield St NE; 18th 1/2 Ave NE; Ramsey St NE; 9th Ave NE; 7th Ave NE; Randolph St NE; NE Garfield St; NE Jackson St; NE Main St; Jackson St NE; 12th Ave NE; NE Hayes St; 6th Ave NE; NE Madison St; New Brighton Blvd (Co Rd 88); NE Howard St; 7th St NE; 5th Ave NE; Tyler St NE; NE Hollywood Ave; E Hennepin Ave; Van Buren St NE; Lincoln St NE; Garfield St; NE Columbia Ave; Coolidge St NE; St Anthony Pkwy Svc Rd; 4th Ave NE; Sibley St NE; Walnut St; 11th Ave NE; Edge Pl; 10th Ave NE; 2nd 1/2 St NE; Winter St NE; NE Madison Pl; E River Rd (Co Rd 23); NE Valley St; Spain Pl (NE Spain Pl); 26th 1/2 Ave NE; Arthur St NE; St Anthony Blvd; NE Wilson St; 1st St NE; NE Wilshire Pl; New Brighton Svc Rd; Water St NE; NE Taft St; NE Roosevelt St; Architect Ave; Main St; 37th Ave NE; Lowry Ave N (Co Rd 153); Cemetery St NE; St Anthony Ln; Autumn St NE; Walden Pl NE; 25th 1/2 Ave NE; Ramsey Cir NE; 3rd Ave; Technology Dr NE; Plymouth Ave NE; NE University Ave.
Railroad features: Burlington Northern Santa Fe Rlwy; Canadian Pacific Rlwy; Abandoned RR.
Northeast neighborhood detailed profile
Area: 7.502 square miles
Population: 43,196
Population density:
| Northeast: | 5,758 people per square mile |
| Minneapolis: | 7,749 people per square mile |
Median household income in 2021:
| Northeast: | $77,751 |
| Minneapolis: | $69,397 |
Median rent in in 2021:
| Northeast: | $1,030 |
| Minneapolis: | $1,138 |
Male vs Females
| Males: | 22,708 |
| Females: | 20,488 |
Median age
| Males: | 37.5 years |
| Females: | 36.4 years |
Housing prices:
Average estimated value of detached houses in 2021 (47.8% of all units):
| Northeast: | $264,892 |
| Minneapolis: | $398,431 |
Average estimated value of townhouses or other attached units in 2021 (7.4% of all units):
| This neighborhood: | $321,857 |
| city: | $376,360 |
Average estimated value of housing units in 2-unit structures in 2021 (24.0% of all units):
| This neighborhood: | $274,302 |
| Minneapolis: | $353,466 |
Average estimated '21 value of housing units in 5-or-more-unit structures (24.5% of all units):
| Northeast: | $125,564 |
| Minneapolis: | $317,891 |
Most popular occupations of males: sales and office occupations (15.4%); service occupations (12.7%); management occupations (except farmers) (11.9%); arts, design, entertainment, sports, and media occupations (7.7%); business and financial operations occupations (7.1%); production occupations (6.3%); computer and mathematical occupations (6.0%)
Most popular occupations of females: sales and office occupations (20.2%); service occupations (17.3%); management occupations (except farmers) (13.2%); business and financial operations occupations (9.1%); education, training, and library occupations (8.7%); healthcare practitioners and technical occupations (8.6%); arts, design, entertainment, sports, and media occupations (6.0%)
Limited-access highways (interstate or state) in this neighborhood: I- 35.
Highways in this neighborhood: State Hwy 47 (University Ave NE); State Hwy 65 (Central Ave NE).
Roads and streets: Saint Anthony Blvd (Saint Anthony Pkwy); 22nd Ave NE; 23rd Ave NE; Co Rd 153 (Lowry Ave NE); Co Rd 23 (Marshall St NE); 27th Ave NE; Fillmore St NE; 26th Ave NE; 19th Ave NE; 36th Ave NE; Broadway St NE; Johnson St NE; 18th Ave NE; 5th St NE; 4th St NE; 2nd St NE; NE Cleveland St; Stinson Blvd (Co Rd 27); NE Lincoln St; 35th Ave NE; McKinley St NE; 13th Ave NE; NE Ulysses St; Buchanan St NE; 30th Ave NE; 29th Ave NE; Monroe St NE; NE Grand St; 31st Ave NE; 24th Ave NE; NE Arthur St; California St NE; Washington St NE; 32nd Ave NE; 14th Ave NE; 20th Ave NE; 28th Ave NE; Jefferson St NE; 33rd Ave NE; Quincy St NE; 3rd St NE; NE Pierce St; 15th Ave NE; 17th Ave NE; Taylor St NE; Polk St NE; Summer St NE; Pierce St NE; 6th St NE; 34th Ave NE; Main St NE; Spring St NE; Hayes St NE; NE Benjamin St; 8th Ave NE; Ridgeway Rd (Ridgeway Pkwy); NE Polk St; Columbia Pkwy; 3rd Ave NE; Benjamin St NE (NE Benjamin St); NE Buchanan St; NE Tyler St; 16th Ave NE; 36th 1/2 Ave NE; Adams St NE; Brighton Ave NE; Madison St NE; NE Taylor St; Garfield St NE; 18th 1/2 Ave NE; Ramsey St NE; 9th Ave NE; 7th Ave NE; Randolph St NE; NE Garfield St; NE Jackson St; NE Main St; Jackson St NE; 12th Ave NE; NE Hayes St; 6th Ave NE; NE Madison St; New Brighton Blvd (Co Rd 88); NE Howard St; 7th St NE; 5th Ave NE; Tyler St NE; NE Hollywood Ave; E Hennepin Ave; Van Buren St NE; Lincoln St NE; Garfield St; NE Columbia Ave; Coolidge St NE; St Anthony Pkwy Svc Rd; 4th Ave NE; Sibley St NE; Walnut St; 11th Ave NE; Edge Pl; 10th Ave NE; 2nd 1/2 St NE; Winter St NE; NE Madison Pl; E River Rd (Co Rd 23); NE Valley St; Spain Pl (NE Spain Pl); 26th 1/2 Ave NE; Arthur St NE; St Anthony Blvd; NE Wilson St; 1st St NE; NE Wilshire Pl; New Brighton Svc Rd; Water St NE; NE Taft St; NE Roosevelt St; Architect Ave; Main St; 37th Ave NE; Lowry Ave N (Co Rd 153); Cemetery St NE; St Anthony Ln; Autumn St NE; Walden Pl NE; 25th 1/2 Ave NE; Ramsey Cir NE; 3rd Ave; Technology Dr NE; Plymouth Ave NE; NE University Ave.
Railroad features: Burlington Northern Santa Fe Rlwy; Canadian Pacific Rlwy; Abandoned RR.
Northeast neighborhood detailed profile
Northeast Park neighborhood in Minneapolis statistics: (Find on map)
Area: 0.704 square miles
Population: 8,734
Population density:
Median household income in 2021:
Median rent in in 2021:
Male vs Females
Median age
Housing prices:
Average estimated value of detached houses in 2021 (33.6% of all units):
Average estimated value of townhouses or other attached units in 2021 (19.4% of all units):
Average estimated value of housing units in 2-unit structures in 2021 (3.1% of all units):
Average estimated '21 value of housing units in 5-or-more-unit structures (121.4% of all units):
Most popular occupations of males: community and social services occupations (21.2%); service occupations (18.4%); management occupations (except farmers) (15.2%); sales and office occupations (10.1%); construction, extraction, and maintenance occupations (7.5%); architecture and engineering occupations (6.5%); education, training, and library occupations (4.8%)
Most popular occupations of females: computer and mathematical occupations (181.6%); life, physical, and social science occupations (142.5%); construction, extraction, and maintenance occupations (109.0%); service occupations (40.9%); architecture and engineering occupations (24.2%); management occupations (except farmers) (22.5%); sales and office occupations (17.3%)
Limited-access highways (interstate or state) in this neighborhood: I- 35.
Roads and streets: Ridgeway Rd (Ridgeway Pkwy); Stinson Blvd (Co Rd 27); New Brighton Blvd (Co Rd 88); 14th Ave NE; Walnut St; 13th Ave NE; Johnson St NE; 16th Ave NE; St Anthony Blvd; Pierce St NE; Buchanan St NE; Tyler St NE; 17th Ave NE; Lincoln St NE; Fillmore St NE; Arthur St NE; Saint Anthony Pkwy (Saint Anthony Blvd).
Railroad features: Burlington Northern Santa Fe Rlwy.
Northeast Park neighborhood detailed profile
Area: 0.704 square miles
Population: 8,734
Population density:
| Northeast Park: | 12,401 people per square mile |
| Minneapolis: | 7,749 people per square mile |
Median household income in 2021:
| Northeast Park: | $93,469 |
| Minneapolis: | $69,397 |
Median rent in in 2021:
| Northeast Park: | $974 |
| Minneapolis: | $1,138 |
Male vs Females
| Males: | 4,865 |
| Females: | 3,869 |
Median age
| Males: | 38.8 years |
| Females: | 41.8 years |
Housing prices:
Average estimated value of detached houses in 2021 (33.6% of all units):
| Northeast Park: | $274,569 |
| Minneapolis: | $398,431 |
Average estimated value of townhouses or other attached units in 2021 (19.4% of all units):
| This neighborhood: | $234,844 |
| city: | $376,360 |
Average estimated value of housing units in 2-unit structures in 2021 (3.1% of all units):
| This neighborhood: | $309,763 |
| Minneapolis: | $353,466 |
Average estimated '21 value of housing units in 5-or-more-unit structures (121.4% of all units):
| Northeast Park: | $292,857 |
| Minneapolis: | $317,891 |
Most popular occupations of males: community and social services occupations (21.2%); service occupations (18.4%); management occupations (except farmers) (15.2%); sales and office occupations (10.1%); construction, extraction, and maintenance occupations (7.5%); architecture and engineering occupations (6.5%); education, training, and library occupations (4.8%)
Most popular occupations of females: computer and mathematical occupations (181.6%); life, physical, and social science occupations (142.5%); construction, extraction, and maintenance occupations (109.0%); service occupations (40.9%); architecture and engineering occupations (24.2%); management occupations (except farmers) (22.5%); sales and office occupations (17.3%)
Limited-access highways (interstate or state) in this neighborhood: I- 35.
Roads and streets: Ridgeway Rd (Ridgeway Pkwy); Stinson Blvd (Co Rd 27); New Brighton Blvd (Co Rd 88); 14th Ave NE; Walnut St; 13th Ave NE; Johnson St NE; 16th Ave NE; St Anthony Blvd; Pierce St NE; Buchanan St NE; Tyler St NE; 17th Ave NE; Lincoln St NE; Fillmore St NE; Arthur St NE; Saint Anthony Pkwy (Saint Anthony Blvd).
Railroad features: Burlington Northern Santa Fe Rlwy.
Northeast Park neighborhood detailed profile
Northrup neighborhood in Minneapolis statistics: (Find on map)
Area: 0.710 square miles
Population: 6,373
Population density:
Median household income in 2021:
Median rent in in 2021:
Male vs Females
Median age
Most popular occupations of males: sales and office occupations (18.2%); management occupations (except farmers) (14.6%); business and financial operations occupations (12.6%); service occupations (9.7%); legal occupations (7.8%); computer and mathematical occupations (5.5%); community and social services occupations (4.4%)
Most popular occupations of females: sales and office occupations (18.4%); service occupations (12.5%); business and financial operations occupations (12.1%); management occupations (except farmers) (11.8%); education, training, and library occupations (9.2%); production occupations (7.5%); legal occupations (7.0%)
Roads and streets: E Minnehaha Pkwy; E 47th St; E 44th St; E 43rd St; 14th Ave S; 15th Ave S; Bloomington Ave S; E 48th St; 16th Ave S; 17th Ave S; 18th Ave S; E 46th St; Elliot Ave S; 13th Ave S; E 45th St; 10th Ave S; 12th Ave S; 11th Ave S; E 49th St; Cedar Ave S.
Other features: Minnehaha Crk.
Northrup neighborhood detailed profile
Area: 0.710 square miles
Population: 6,373
Population density:
| Northrup: | 8,977 people per square mile |
| Minneapolis: | 7,749 people per square mile |
Median household income in 2021:
| Northrup: | $108,438 |
| Minneapolis: | $69,397 |
Median rent in in 2021:
| Northrup: | $970 |
| Minneapolis: | $1,138 |
Male vs Females
| Males: | 3,160 |
| Females: | 3,213 |
Median age
| Males: | 38.7 years |
| Females: | 37.9 years |
Most popular occupations of males: sales and office occupations (18.2%); management occupations (except farmers) (14.6%); business and financial operations occupations (12.6%); service occupations (9.7%); legal occupations (7.8%); computer and mathematical occupations (5.5%); community and social services occupations (4.4%)
Most popular occupations of females: sales and office occupations (18.4%); service occupations (12.5%); business and financial operations occupations (12.1%); management occupations (except farmers) (11.8%); education, training, and library occupations (9.2%); production occupations (7.5%); legal occupations (7.0%)
Roads and streets: E Minnehaha Pkwy; E 47th St; E 44th St; E 43rd St; 14th Ave S; 15th Ave S; Bloomington Ave S; E 48th St; 16th Ave S; 17th Ave S; 18th Ave S; E 46th St; Elliot Ave S; 13th Ave S; E 45th St; 10th Ave S; 12th Ave S; 11th Ave S; E 49th St; Cedar Ave S.
Other features: Minnehaha Crk.
Northrup neighborhood detailed profile
Oak Park neighborhood in Minneapolis statistics: (Find on map)
Area: 0.586 square miles
Population: 2,368
Population density:
Median household income in 2021:
Median rent in in 2021:
Male vs Females
Median age
Housing prices:
Average estimated value of detached houses in 2021 (74.6% of all units):
Average estimated value of townhouses or other attached units in 2021 (26.6% of all units):
Average estimated value of mobile home in 2021 (86.2% of all units):
Most popular occupations of males: sales and office occupations (16.3%); production occupations (15.6%); management occupations (except farmers) (11.1%); service occupations (9.1%); transportation occupations (8.4%); material moving occupations (7.5%); construction, extraction, and maintenance occupations (5.4%)
Most popular occupations of females: sales and office occupations (31.5%); service occupations (24.3%); management occupations (except farmers) (9.5%); production occupations (7.2%); healthcare practitioners and technical occupations (6.4%); education, training, and library occupations (5.4%); material moving occupations (4.5%)
Roads and streets: Co Rd 51 (University Ave NW, University Ave NE); Co Hwy 12 (109th Ave NE); 7th St NE; President Dr NE; 6th St NE; 105th Ave NE; Terrace Rd NE; Jefferson St NE; 111th Ave NE; Co Hwy 12 (Northdale Blvd NW); Washington St NE; Butternut St NW; Cottonwood St NW; Dogwood St NW; Washington Blvd NE; Egret Blvd NW; 105th Ave NW; 105th Ln NW; 106th Ave NW; 107th Ave NE; 108th Ave NW; 106th Ln NE; 5th St NE; 4th St NE; 108th Ave NE; University Av Ser Rd; 106th Ave NE; 107th Ln NW; 110th Ln NW; Cottonwood St; Butternut Cir NW.
Oak Park neighborhood detailed profile
Area: 0.586 square miles
Population: 2,368
Population density:
| Oak Park: | 4,044 people per square mile |
| Minneapolis: | 7,749 people per square mile |
Median household income in 2021:
| Oak Park: | $75,615 |
| Minneapolis: | $69,397 |
Median rent in in 2021:
| Oak Park: | $1,162 |
| Minneapolis: | $1,138 |
Male vs Females
| Males: | 1,165 |
| Females: | 1,202 |
Median age
| Males: | 39.6 years |
| Females: | 46.7 years |
Housing prices:
Average estimated value of detached houses in 2021 (74.6% of all units):
| Oak Park: | $193,723 |
| Minneapolis: | $398,431 |
Average estimated value of townhouses or other attached units in 2021 (26.6% of all units):
| This neighborhood: | $53,820 |
| city: | $376,360 |
Average estimated value of mobile home in 2021 (86.2% of all units):
| Oak Park: | $25,382 |
| Minneapolis: | $9,605 |
Most popular occupations of males: sales and office occupations (16.3%); production occupations (15.6%); management occupations (except farmers) (11.1%); service occupations (9.1%); transportation occupations (8.4%); material moving occupations (7.5%); construction, extraction, and maintenance occupations (5.4%)
Most popular occupations of females: sales and office occupations (31.5%); service occupations (24.3%); management occupations (except farmers) (9.5%); production occupations (7.2%); healthcare practitioners and technical occupations (6.4%); education, training, and library occupations (5.4%); material moving occupations (4.5%)
Roads and streets: Co Rd 51 (University Ave NW, University Ave NE); Co Hwy 12 (109th Ave NE); 7th St NE; President Dr NE; 6th St NE; 105th Ave NE; Terrace Rd NE; Jefferson St NE; 111th Ave NE; Co Hwy 12 (Northdale Blvd NW); Washington St NE; Butternut St NW; Cottonwood St NW; Dogwood St NW; Washington Blvd NE; Egret Blvd NW; 105th Ave NW; 105th Ln NW; 106th Ave NW; 107th Ave NE; 108th Ave NW; 106th Ln NE; 5th St NE; 4th St NE; 108th Ave NE; University Av Ser Rd; 106th Ave NE; 107th Ln NW; 110th Ln NW; Cottonwood St; Butternut Cir NW.
Oak Park neighborhood detailed profile
Page neighborhood in Minneapolis statistics: (Find on map)
Area: 0.331 square miles
Population: 2,042
Population density:
Median household income in 2021:
Median rent in in 2021:
Male vs Females
Median age
Average estimated value of detached houses in 2021 (89.7% of all units):
Most popular occupations of males: management occupations (except farmers) (20.9%); computer and mathematical occupations (16.8%); sales and office occupations (16.4%); business and financial operations occupations (11.2%); architecture and engineering occupations (11.1%); education, training, and library occupations (7.9%); arts, design, entertainment, sports, and media occupations (7.9%)
Most popular occupations of females: sales and office occupations (20.2%); management occupations (except farmers) (15.2%); education, training, and library occupations (11.7%); arts, design, entertainment, sports, and media occupations (11.4%); business and financial operations occupations (10.8%); community and social services occupations (9.8%); healthcare practitioners and technical occupations (8.7%)
Roads and streets: Portland Ave S (Co Rd 35); E Minnehaha Pkwy; E 54th St; E 53rd St; Luverne Ave; Co Rd 33 (Park Ave S); E 51st St; Columbus Ave S; E Diamond Lake Rd; Clinton Ave S; 2nd Ave S; Chicago Ave S; Hampshire Dr; 3rd Ave S; E 55th St; E 52nd St; Oakland Ave S; Tarrymore Ave; Parkway Ct; E 50th St.
Page neighborhood detailed profile
Area: 0.331 square miles
Population: 2,042
Population density:
| Page: | 6,176 people per square mile |
| Minneapolis: | 7,749 people per square mile |
Median household income in 2021:
| Page: | $125,379 |
| Minneapolis: | $69,397 |
Median rent in in 2021:
| Page: | $1,144 |
| Minneapolis: | $1,138 |
Male vs Females
| Males: | 1,020 |
| Females: | 1,022 |
Median age
| Males: | 40.4 years |
| Females: | 35.6 years |
Average estimated value of detached houses in 2021 (89.7% of all units):
| Page: | $333,392 |
| Minneapolis: | $398,431 |
Most popular occupations of males: management occupations (except farmers) (20.9%); computer and mathematical occupations (16.8%); sales and office occupations (16.4%); business and financial operations occupations (11.2%); architecture and engineering occupations (11.1%); education, training, and library occupations (7.9%); arts, design, entertainment, sports, and media occupations (7.9%)
Most popular occupations of females: sales and office occupations (20.2%); management occupations (except farmers) (15.2%); education, training, and library occupations (11.7%); arts, design, entertainment, sports, and media occupations (11.4%); business and financial operations occupations (10.8%); community and social services occupations (9.8%); healthcare practitioners and technical occupations (8.7%)
Roads and streets: Portland Ave S (Co Rd 35); E Minnehaha Pkwy; E 54th St; E 53rd St; Luverne Ave; Co Rd 33 (Park Ave S); E 51st St; Columbus Ave S; E Diamond Lake Rd; Clinton Ave S; 2nd Ave S; Chicago Ave S; Hampshire Dr; 3rd Ave S; E 55th St; E 52nd St; Oakland Ave S; Tarrymore Ave; Parkway Ct; E 50th St.
Page neighborhood detailed profile
Phillips neighborhood in Minneapolis statistics: (Find on map)
Area: 1.569 square miles
Population: 21,016
Population density:
Median household income in 2021:
Median rent in in 2021:
Male vs Females
Median age
Housing prices:
Average estimated value of detached houses in 2021 (9.3% of all units):
Average estimated value of townhouses or other attached units in 2021 (6.6% of all units):
Average estimated value of housing units in 2-unit structures in 2021 (12.0% of all units):
Most popular occupations of males: service occupations (23.1%); production occupations (17.3%); management occupations (except farmers) (11.4%); transportation occupations (8.9%); construction, extraction, and maintenance occupations (6.6%); business and financial operations occupations (6.4%); computer and mathematical occupations (5.1%)
Most popular occupations of females: service occupations (41.9%); sales and office occupations (16.3%); management occupations (except farmers) (10.8%); healthcare practitioners and technical occupations (8.8%); material moving occupations (8.4%); community and social services occupations (5.6%); education, training, and library occupations (3.8%)
Highways in this neighborhood: Hiawatha Ave (State Hwy 55); State Hwy 55.
Roads and streets: E 28th St; E 26th St; E 27th St; E 24th St; E 29th St; Co Rd 5 (E Franklin Ave); E 25th St; E 22nd St; Park Ave S (Co Rd 33); Co Rd 35 (Portland Ave S); 10th Ave S; 13th Ave S; Chicago Ave S; Elliot Ave S; 16th Ave S; 5th Ave S; 17th Ave S; 14th Ave S; 15th Ave S; E 18th St; E 19th St; Bloomington Ave S; Oakland Ave S; 11th Ave S; E Lake St; Columbus Ave S; 12th Ave S; Cedar Ave S; 18th Ave S; E 21st St; Honeywell Plz; 4th Ave S; Longfellow Ave S; E 25th 1/2 St; 21st Ave S; Ogema Pl; Andersen Ln; E 23rd St; Clinton Ave S; 3rd Ave S; 2nd Ave S; 23rd Ave S.
Phillips neighborhood detailed profile
Area: 1.569 square miles
Population: 21,016
Population density:
| Phillips: | 13,393 people per square mile |
| Minneapolis: | 7,749 people per square mile |
Median household income in 2021:
| Phillips: | $39,044 |
| Minneapolis: | $69,397 |
Median rent in in 2021:
| Phillips: | $777 |
| Minneapolis: | $1,138 |
Male vs Females
| Males: | 10,064 |
| Females: | 10,951 |
Median age
| Males: | 34.4 years |
| Females: | 32.2 years |
Housing prices:
Average estimated value of detached houses in 2021 (9.3% of all units):
| Phillips: | $230,011 |
| Minneapolis: | $398,431 |
Average estimated value of townhouses or other attached units in 2021 (6.6% of all units):
| This neighborhood: | $286,419 |
| city: | $376,360 |
Average estimated value of housing units in 2-unit structures in 2021 (12.0% of all units):
| This neighborhood: | $354,412 |
| Minneapolis: | $353,466 |
Most popular occupations of males: service occupations (23.1%); production occupations (17.3%); management occupations (except farmers) (11.4%); transportation occupations (8.9%); construction, extraction, and maintenance occupations (6.6%); business and financial operations occupations (6.4%); computer and mathematical occupations (5.1%)
Most popular occupations of females: service occupations (41.9%); sales and office occupations (16.3%); management occupations (except farmers) (10.8%); healthcare practitioners and technical occupations (8.8%); material moving occupations (8.4%); community and social services occupations (5.6%); education, training, and library occupations (3.8%)
Highways in this neighborhood: Hiawatha Ave (State Hwy 55); State Hwy 55.
Roads and streets: E 28th St; E 26th St; E 27th St; E 24th St; E 29th St; Co Rd 5 (E Franklin Ave); E 25th St; E 22nd St; Park Ave S (Co Rd 33); Co Rd 35 (Portland Ave S); 10th Ave S; 13th Ave S; Chicago Ave S; Elliot Ave S; 16th Ave S; 5th Ave S; 17th Ave S; 14th Ave S; 15th Ave S; E 18th St; E 19th St; Bloomington Ave S; Oakland Ave S; 11th Ave S; E Lake St; Columbus Ave S; 12th Ave S; Cedar Ave S; 18th Ave S; E 21st St; Honeywell Plz; 4th Ave S; Longfellow Ave S; E 25th 1/2 St; 21st Ave S; Ogema Pl; Andersen Ln; E 23rd St; Clinton Ave S; 3rd Ave S; 2nd Ave S; 23rd Ave S.
Phillips neighborhood detailed profile
Powderhorn neighborhood in Minneapolis statistics: (Find on map)
Area: 4.559 square miles
Population: 55,492
Population density:
Median household income in 2021:
Median rent in in 2021:
Male vs Females
Median age
Housing prices:
Average estimated value of detached houses in 2021 (41.0% of all units):
Average estimated value of townhouses or other attached units in 2021 (4.7% of all units):
Average estimated value of housing units in 2-unit structures in 2021 (13.0% of all units):
Average estimated '21 value of housing units in 3-to-4-unit structures (12.5% of all units):
Average estimated '21 value of housing units in 5-or-more-unit structures (23.7% of all units):
Most popular occupations of males: service occupations (18.4%); sales and office occupations (15.9%); management occupations (except farmers) (9.0%); computer and mathematical occupations (7.9%); business and financial operations occupations (6.9%); construction, extraction, and maintenance occupations (5.2%); education, training, and library occupations (4.6%)
Most popular occupations of females: service occupations (21.3%); sales and office occupations (18.3%); education, training, and library occupations (12.3%); management occupations (except farmers) (10.4%); business and financial operations occupations (7.4%); healthcare practitioners and technical occupations (7.3%); arts, design, entertainment, sports, and media occupations (5.3%)
Limited-access highways (interstate or state) in this neighborhood: I- 35 (State Hwy 65).
Highways in this neighborhood: State Hwy 55 (Hiawatha Ave).
Roads and streets: E 40th St; E 36th St; E 41st St; E 39th St; E 35th St; Co Rd 38 (E 38th St); E 37th St; E 31st St; E 42nd St; E 33rd St; E 34th St; E 32nd St; 3rd Ave S; Blaisdell Ave S; 2nd Ave S; 4th Ave S; Pillsbury Ave S; Grand Ave; 1st Ave S; Stevens Ave S; 22nd Ave S; Clinton Ave S; Pleasant Ave S; 21st Ave S; 24th Ave S; Co Rd 52 (Nicollet Ave); 23rd Ave S; Chicago Ave S; Portland Ave S (Co Rd 35); 5th Ave S; Park Ave S (Co Rd 33); Oakland Ave S; 25th Ave S; 20th Ave S; Longfellow Ave S; 17th Ave S; 18th Ave S; 16th Ave S; 15th Ave S; 10th Ave S; Cedar Ave S; Bloomington Ave S; Elliot Ave S; 19th Ave S; 14th Ave S; Columbus Ave S; Harriet Ave S; 26th Ave S; Garfield Ave; 27th Ave S; 11th Ave S; 13th Ave S; 12th Ave S; Co Rd 54 (28th Ave); Standish Ave S; W 35th St; W 34th St; W 33rd St; W 22nd St; W 32nd St; W 31st St; W 28th St; W 25th St; W 26th St; W 27th St; W Lake St; W 24th St; E 43rd St; W 36th St; E 24th St; E 22nd St; E 26th St; 30th Ave S; Garfield Ave S; 29th Ave S; E 27th St; Nokomis Ave S; Harriet Ave; W 29th St; E 36th 1/2 St; E 25th St; E 28th St; 31st Ave S; E Lake St; Powderhorn Ter; Cecil Newman Ln; Findley Pl; Elroy St; 32nd Ave S; E 34th 1/2 St; E 29th St.
Powderhorn neighborhood detailed profile
Area: 4.559 square miles
Population: 55,492
Population density:
| Powderhorn: | 12,172 people per square mile |
| Minneapolis: | 7,749 people per square mile |
Median household income in 2021:
| Powderhorn: | $68,281 |
| Minneapolis: | $69,397 |
Median rent in in 2021:
| Powderhorn: | $1,063 |
| Minneapolis: | $1,138 |
Male vs Females
| Males: | 27,849 |
| Females: | 27,642 |
Median age
| Males: | 33.0 years |
| Females: | 32.0 years |
Housing prices:
Average estimated value of detached houses in 2021 (41.0% of all units):
| Powderhorn: | $317,483 |
| Minneapolis: | $398,431 |
Average estimated value of townhouses or other attached units in 2021 (4.7% of all units):
| This neighborhood: | $189,978 |
| city: | $376,360 |
Average estimated value of housing units in 2-unit structures in 2021 (13.0% of all units):
| This neighborhood: | $468,145 |
| Minneapolis: | $353,466 |
Average estimated '21 value of housing units in 3-to-4-unit structures (12.5% of all units):
| Powderhorn: | $216,184 |
| city: | $335,939 |
Average estimated '21 value of housing units in 5-or-more-unit structures (23.7% of all units):
| Powderhorn: | $66,975 |
| Minneapolis: | $317,891 |
Most popular occupations of males: service occupations (18.4%); sales and office occupations (15.9%); management occupations (except farmers) (9.0%); computer and mathematical occupations (7.9%); business and financial operations occupations (6.9%); construction, extraction, and maintenance occupations (5.2%); education, training, and library occupations (4.6%)
Most popular occupations of females: service occupations (21.3%); sales and office occupations (18.3%); education, training, and library occupations (12.3%); management occupations (except farmers) (10.4%); business and financial operations occupations (7.4%); healthcare practitioners and technical occupations (7.3%); arts, design, entertainment, sports, and media occupations (5.3%)
Limited-access highways (interstate or state) in this neighborhood: I- 35 (State Hwy 65).
Highways in this neighborhood: State Hwy 55 (Hiawatha Ave).
Roads and streets: E 40th St; E 36th St; E 41st St; E 39th St; E 35th St; Co Rd 38 (E 38th St); E 37th St; E 31st St; E 42nd St; E 33rd St; E 34th St; E 32nd St; 3rd Ave S; Blaisdell Ave S; 2nd Ave S; 4th Ave S; Pillsbury Ave S; Grand Ave; 1st Ave S; Stevens Ave S; 22nd Ave S; Clinton Ave S; Pleasant Ave S; 21st Ave S; 24th Ave S; Co Rd 52 (Nicollet Ave); 23rd Ave S; Chicago Ave S; Portland Ave S (Co Rd 35); 5th Ave S; Park Ave S (Co Rd 33); Oakland Ave S; 25th Ave S; 20th Ave S; Longfellow Ave S; 17th Ave S; 18th Ave S; 16th Ave S; 15th Ave S; 10th Ave S; Cedar Ave S; Bloomington Ave S; Elliot Ave S; 19th Ave S; 14th Ave S; Columbus Ave S; Harriet Ave S; 26th Ave S; Garfield Ave; 27th Ave S; 11th Ave S; 13th Ave S; 12th Ave S; Co Rd 54 (28th Ave); Standish Ave S; W 35th St; W 34th St; W 33rd St; W 22nd St; W 32nd St; W 31st St; W 28th St; W 25th St; W 26th St; W 27th St; W Lake St; W 24th St; E 43rd St; W 36th St; E 24th St; E 22nd St; E 26th St; 30th Ave S; Garfield Ave S; 29th Ave S; E 27th St; Nokomis Ave S; Harriet Ave; W 29th St; E 36th 1/2 St; E 25th St; E 28th St; 31st Ave S; E Lake St; Powderhorn Ter; Cecil Newman Ln; Findley Pl; Elroy St; 32nd Ave S; E 34th 1/2 St; E 29th St.
Powderhorn neighborhood detailed profile
Powderhorn Park neighborhood in Minneapolis statistics: (Find on map)
Area: 0.731 square miles
Population: 10,530
Population density:
Median household income in 2021:
Median rent in in 2021:
Male vs Females
Median age
Housing prices:
Average estimated value of detached houses in 2021 (46.3% of all units):
Average estimated value of housing units in 2-unit structures in 2021 (16.9% of all units):
Most popular occupations of males: service occupations (22.4%); sales and office occupations (20.9%); management occupations (except farmers) (13.7%); construction, extraction, and maintenance occupations (7.7%); education, training, and library occupations (5.0%); material moving occupations (4.5%); community and social services occupations (3.9%)
Most popular occupations of females: service occupations (26.7%); sales and office occupations (17.3%); education, training, and library occupations (12.8%); management occupations (except farmers) (7.9%); business and financial operations occupations (7.1%); healthcare practitioners and technical occupations (6.8%); community and social services occupations (6.0%)
Roads and streets: E 31st St; E 35th St; E 37th St; E 36th St; E 38th St (Co Rd 38); Cedar Ave S; 18th Ave S; 17th Ave S; 16th Ave S; Bloomington Ave S; 15th Ave S; 10th Ave S; Elliot Ave S; 14th Ave S; E 33rd St; E 32nd St; E 34th St; 11th Ave S; 13th Ave S; 12th Ave S; Powderhorn Ter; E 34th 1/2 St.
Powderhorn Park neighborhood detailed profile
Area: 0.731 square miles
Population: 10,530
Population density:
| Powderhorn Park: | 14,403 people per square mile |
| Minneapolis: | 7,749 people per square mile |
Median household income in 2021:
| Powderhorn Park: | $70,664 |
| Minneapolis: | $69,397 |
Median rent in in 2021:
| Powderhorn Park: | $1,004 |
| Minneapolis: | $1,138 |
Male vs Females
| Males: | 5,385 |
| Females: | 5,145 |
Median age
| Males: | 31.3 years |
| Females: | 31.8 years |
Housing prices:
Average estimated value of detached houses in 2021 (46.3% of all units):
| Powderhorn Park: | $194,092 |
| Minneapolis: | $398,431 |
Average estimated value of housing units in 2-unit structures in 2021 (16.9% of all units):
| This neighborhood: | $976,728 |
| Minneapolis: | $353,466 |
Most popular occupations of males: service occupations (22.4%); sales and office occupations (20.9%); management occupations (except farmers) (13.7%); construction, extraction, and maintenance occupations (7.7%); education, training, and library occupations (5.0%); material moving occupations (4.5%); community and social services occupations (3.9%)
Most popular occupations of females: service occupations (26.7%); sales and office occupations (17.3%); education, training, and library occupations (12.8%); management occupations (except farmers) (7.9%); business and financial operations occupations (7.1%); healthcare practitioners and technical occupations (6.8%); community and social services occupations (6.0%)
Roads and streets: E 31st St; E 35th St; E 37th St; E 36th St; E 38th St (Co Rd 38); Cedar Ave S; 18th Ave S; 17th Ave S; 16th Ave S; Bloomington Ave S; 15th Ave S; 10th Ave S; Elliot Ave S; 14th Ave S; E 33rd St; E 32nd St; E 34th St; 11th Ave S; 13th Ave S; 12th Ave S; Powderhorn Ter; E 34th 1/2 St.
Powderhorn Park neighborhood detailed profile
Prospect Park neighborhood in Minneapolis statistics: (Find on map)
Area: 1.241 square miles
Population: 2,184
Population density:
Median household income in 2021:
Median rent in in 2021:
Male vs Females
Median age
Housing prices:
Average estimated value of detached houses in 2021 (49.1% of all units):
Average estimated '21 value of housing units in 5-or-more-unit structures (33.6% of all units):
Most popular occupations of males: sales and office occupations (26.6%); service occupations (12.4%); life, physical, and social science occupations (9.6%); production occupations (8.9%); education, training, and library occupations (7.6%); arts, design, entertainment, sports, and media occupations (7.0%); management occupations (except farmers) (6.3%)
Most popular occupations of females: service occupations (31.5%); sales and office occupations (26.1%); education, training, and library occupations (16.8%); arts, design, entertainment, sports, and media occupations (11.7%); management occupations (except farmers) (9.8%); computer and mathematical occupations (7.0%); healthcare practitioners and technical occupations (3.1%)
Limited-access highways (interstate or state) in this neighborhood: US Hwy 52 (I- 94, US Hwy 12).
Highways in this neighborhood: State Hwy 122 (Washington Ave SE).
Roads and streets: E River Pkwy (E River Rd); University Ave SE; 4th St SE; Franklin Ave SE; Malcolm Ave SE; Arthur Ave SE; 5th St SE; 27th Ave SE (Co Rd 5); E River Ter; Bedford St SE; Orlin Ave SE; Emerald St SE; Seymour Ave SE; Delaware St SE; Essex St SE; Ontario St SE; Cecil St SE; Williams Ave SE; Melbourne Ave SE; 25th Ave SE; Erie St SE; Clarence Ave SE; Sharon Ave SE; St Anthony Ave; St Marys Ave SE; Yale Ave SE; Barton Ave SE; Huron Blvd SE; 29th Ave SE; Warwick St SE; Fulton St SE; Thornton St SE; 26th Ave SE; Sidney Pl; 30th Ave SE; Seymour Pl SE; Dartmouth Pl SE; Dartmouth Ave SE; Oak St SE; 23rd Ave SE; Huron St; Beacon St SE; Co Rd 5 (E Franklin Ave); Prospect Ter SE; River Terrace Ct; Superior St SE; St Marys Pl; Arthur Pl SE.
Railroad features: Burlington Northern Santa Fe Rlwy; Canadian Pacific Rlwy; Minnesota Commercial RR.
Limited-access highways (interstate or state) in this neighborhood: .
Roads and streets: Emerald St SE; St Anthony Ave.
Prospect Park neighborhood detailed profile
Area: 1.241 square miles
Population: 2,184
Population density:
| Prospect Park: | 1,760 people per square mile |
| Minneapolis: | 7,749 people per square mile |
Median household income in 2021:
| Prospect Park: | $85,187 |
| Minneapolis: | $69,397 |
Median rent in in 2021:
| Prospect Park: | $1,220 |
| Minneapolis: | $1,138 |
Male vs Females
| Males: | 1,070 |
| Females: | 1,114 |
Median age
| Males: | 30.6 years |
| Females: | 24.9 years |
Housing prices:
Average estimated value of detached houses in 2021 (49.1% of all units):
| Prospect Park: | $247,818 |
| Minneapolis: | $398,431 |
Average estimated '21 value of housing units in 5-or-more-unit structures (33.6% of all units):
| Prospect Park: | $226,017 |
| Minneapolis: | $317,891 |
Most popular occupations of males: sales and office occupations (26.6%); service occupations (12.4%); life, physical, and social science occupations (9.6%); production occupations (8.9%); education, training, and library occupations (7.6%); arts, design, entertainment, sports, and media occupations (7.0%); management occupations (except farmers) (6.3%)
Most popular occupations of females: service occupations (31.5%); sales and office occupations (26.1%); education, training, and library occupations (16.8%); arts, design, entertainment, sports, and media occupations (11.7%); management occupations (except farmers) (9.8%); computer and mathematical occupations (7.0%); healthcare practitioners and technical occupations (3.1%)
Limited-access highways (interstate or state) in this neighborhood: US Hwy 52 (I- 94, US Hwy 12).
Highways in this neighborhood: State Hwy 122 (Washington Ave SE).
Roads and streets: E River Pkwy (E River Rd); University Ave SE; 4th St SE; Franklin Ave SE; Malcolm Ave SE; Arthur Ave SE; 5th St SE; 27th Ave SE (Co Rd 5); E River Ter; Bedford St SE; Orlin Ave SE; Emerald St SE; Seymour Ave SE; Delaware St SE; Essex St SE; Ontario St SE; Cecil St SE; Williams Ave SE; Melbourne Ave SE; 25th Ave SE; Erie St SE; Clarence Ave SE; Sharon Ave SE; St Anthony Ave; St Marys Ave SE; Yale Ave SE; Barton Ave SE; Huron Blvd SE; 29th Ave SE; Warwick St SE; Fulton St SE; Thornton St SE; 26th Ave SE; Sidney Pl; 30th Ave SE; Seymour Pl SE; Dartmouth Pl SE; Dartmouth Ave SE; Oak St SE; 23rd Ave SE; Huron St; Beacon St SE; Co Rd 5 (E Franklin Ave); Prospect Ter SE; River Terrace Ct; Superior St SE; St Marys Pl; Arthur Pl SE.
Railroad features: Burlington Northern Santa Fe Rlwy; Canadian Pacific Rlwy; Minnesota Commercial RR.
Limited-access highways (interstate or state) in this neighborhood: .
Roads and streets: Emerald St SE; St Anthony Ave.
Prospect Park neighborhood detailed profile
Regina neighborhood in Minneapolis statistics: (Find on map)
Area: 0.299 square miles
Population: 3,460
Population density:
Median household income in 2021:
Median rent in in 2021:
Male vs Females
Median age
Housing prices:
Average estimated value of detached houses in 2021 (77.4% of all units):
Average estimated value of townhouses or other attached units in 2021 (37.2% of all units):
Most popular occupations of males: service occupations (15.8%); management occupations (except farmers) (12.6%); computer and mathematical occupations (11.3%); sales and office occupations (11.0%); production occupations (8.5%); business and financial operations occupations (7.5%); education, training, and library occupations (6.7%)
Most popular occupations of females: sales and office occupations (24.8%); management occupations (except farmers) (17.3%); education, training, and library occupations (11.3%); community and social services occupations (9.7%); business and financial operations occupations (9.1%); healthcare practitioners and technical occupations (6.7%); service occupations (5.5%)
Roads and streets: E 43rd St; E 44th St; E 45th St; E 46th St; 3rd Ave S; 4th Ave S; 2nd Ave S; Columbus Ave S; Chicago Ave S; 5th Ave S; Co Rd 33 (Park Ave S); Co Rd 35 (Portland Ave S); Oakland Ave S; Clinton Ave S; E 42nd St.
Regina neighborhood detailed profile
Area: 0.299 square miles
Population: 3,460
Population density:
| Regina: | 11,587 people per square mile |
| Minneapolis: | 7,749 people per square mile |
Median household income in 2021:
| Regina: | $95,430 |
| Minneapolis: | $69,397 |
Median rent in in 2021:
| Regina: | $1,528 |
| Minneapolis: | $1,138 |
Male vs Females
| Males: | 1,538 |
| Females: | 1,922 |
Median age
| Males: | 35.4 years |
| Females: | 36.9 years |
Housing prices:
Average estimated value of detached houses in 2021 (77.4% of all units):
| Regina: | $287,867 |
| Minneapolis: | $398,431 |
Average estimated value of townhouses or other attached units in 2021 (37.2% of all units):
| This neighborhood: | $189,978 |
| city: | $376,360 |
Most popular occupations of males: service occupations (15.8%); management occupations (except farmers) (12.6%); computer and mathematical occupations (11.3%); sales and office occupations (11.0%); production occupations (8.5%); business and financial operations occupations (7.5%); education, training, and library occupations (6.7%)
Most popular occupations of females: sales and office occupations (24.8%); management occupations (except farmers) (17.3%); education, training, and library occupations (11.3%); community and social services occupations (9.7%); business and financial operations occupations (9.1%); healthcare practitioners and technical occupations (6.7%); service occupations (5.5%)
Roads and streets: E 43rd St; E 44th St; E 45th St; E 46th St; 3rd Ave S; 4th Ave S; 2nd Ave S; Columbus Ave S; Chicago Ave S; 5th Ave S; Co Rd 33 (Park Ave S); Co Rd 35 (Portland Ave S); Oakland Ave S; Clinton Ave S; E 42nd St.
Regina neighborhood detailed profile
Seward neighborhood in Minneapolis statistics: (Find on map)
Area: 1.039 square miles
Population: 7,118
Population density:
Median household income in 2021:
Median rent in in 2021:
Male vs Females
Median age
Housing prices:
Average estimated value of detached houses in 2021 (32.9% of all units):
Average estimated value of townhouses or other attached units in 2021 (7.6% of all units):
Average estimated value of housing units in 2-unit structures in 2021 (11.1% of all units):
Most popular occupations of males: service occupations (17.5%); sales and office occupations (15.0%); business and financial operations occupations (10.0%); arts, design, entertainment, sports, and media occupations (8.9%); transportation occupations (8.4%); computer and mathematical occupations (7.5%); education, training, and library occupations (6.1%)
Most popular occupations of females: sales and office occupations (20.1%); service occupations (18.4%); education, training, and library occupations (13.8%); management occupations (except farmers) (8.5%); healthcare practitioners and technical occupations (8.5%); business and financial operations occupations (7.3%); life, physical, and social science occupations (5.6%)
Roads and streets: Co Rd 5 (E Franklin Ave); E 24th St; E 26th St; E 25th St; W River Pkwy; E 22nd St; Minnehaha Ave; Seabury Ave S; 26th Ave S; E 27th St; S 9th St; Co Rd 48 (27th Ave S); 30th Ave S; 29th Ave S; 31st Ave S; 32nd Ave S; 24th Ave S; 25th Ave S; 33rd Ave S; Co Rd 54 (28th Ave); 23rd Ave S; 22nd Ave S; 9th St S; 35th Ave S; 34th Ave S; Cedar Ave S; Minneapolis Ave S; 37th Ave S; 21st Ave S; Milwaukee Ave S; 38th Ave S; 36th Ave S; Evergreen Dr; Riverside Ave; 19th Ave S; Snelling Ave; Franklin Ter; 39th Ave S; 20th Ave S; Pautz St; Milwaukee Ave Exd; 40th Ave S.
Railroad features: Minnesota Commercial RR.
Seward neighborhood detailed profile
Area: 1.039 square miles
Population: 7,118
Population density:
| Seward: | 6,851 people per square mile |
| Minneapolis: | 7,749 people per square mile |
Median household income in 2021:
| Seward: | $65,883 |
| Minneapolis: | $69,397 |
Median rent in in 2021:
| Seward: | $945 |
| Minneapolis: | $1,138 |
Male vs Females
| Males: | 3,771 |
| Females: | 3,347 |
Median age
| Males: | 36.2 years |
| Females: | 41.5 years |
Housing prices:
Average estimated value of detached houses in 2021 (32.9% of all units):
| Seward: | $233,304 |
| Minneapolis: | $398,431 |
Average estimated value of townhouses or other attached units in 2021 (7.6% of all units):
| This neighborhood: | $286,419 |
| city: | $376,360 |
Average estimated value of housing units in 2-unit structures in 2021 (11.1% of all units):
| This neighborhood: | $354,412 |
| Minneapolis: | $353,466 |
Most popular occupations of males: service occupations (17.5%); sales and office occupations (15.0%); business and financial operations occupations (10.0%); arts, design, entertainment, sports, and media occupations (8.9%); transportation occupations (8.4%); computer and mathematical occupations (7.5%); education, training, and library occupations (6.1%)
Most popular occupations of females: sales and office occupations (20.1%); service occupations (18.4%); education, training, and library occupations (13.8%); management occupations (except farmers) (8.5%); healthcare practitioners and technical occupations (8.5%); business and financial operations occupations (7.3%); life, physical, and social science occupations (5.6%)
Roads and streets: Co Rd 5 (E Franklin Ave); E 24th St; E 26th St; E 25th St; W River Pkwy; E 22nd St; Minnehaha Ave; Seabury Ave S; 26th Ave S; E 27th St; S 9th St; Co Rd 48 (27th Ave S); 30th Ave S; 29th Ave S; 31st Ave S; 32nd Ave S; 24th Ave S; 25th Ave S; 33rd Ave S; Co Rd 54 (28th Ave); 23rd Ave S; 22nd Ave S; 9th St S; 35th Ave S; 34th Ave S; Cedar Ave S; Minneapolis Ave S; 37th Ave S; 21st Ave S; Milwaukee Ave S; 38th Ave S; 36th Ave S; Evergreen Dr; Riverside Ave; 19th Ave S; Snelling Ave; Franklin Ter; 39th Ave S; 20th Ave S; Pautz St; Milwaukee Ave Exd; 40th Ave S.
Railroad features: Minnesota Commercial RR.
Seward neighborhood detailed profile
Sheridan neighborhood in Minneapolis statistics: (Find on map)
Area: 0.314 square miles
Population: 4,500
Population density:
Median household income in 2021:
Median rent in in 2021:
Male vs Females
Median age
Housing prices:
Average estimated value of detached houses in 2021 (23.6% of all units):
Average estimated value of townhouses or other attached units in 2021 (5.5% of all units):
Average estimated value of housing units in 2-unit structures in 2021 (32.0% of all units):
Average estimated '21 value of housing units in 5-or-more-unit structures (19.0% of all units):
Most popular occupations of males: sales and office occupations (22.1%); service occupations (16.7%); management occupations (except farmers) (8.4%); education, training, and library occupations (7.9%); arts, design, entertainment, sports, and media occupations (7.1%); computer and mathematical occupations (6.1%); material moving occupations (5.9%)
Most popular occupations of females: service occupations (17.6%); sales and office occupations (17.6%); management occupations (except farmers) (16.2%); healthcare practitioners and technical occupations (11.8%); community and social services occupations (11.2%); business and financial operations occupations (11.0%); arts, design, entertainment, sports, and media occupations (6.6%)
Highways in this neighborhood: State Hwy 47 (University Ave NE).
Roads and streets: 13th Ave NE; 15th Ave NE; 14th Ave NE; 16th Ave NE; NE Grand St; Co Rd 23 (Marshall St NE); 4th St NE; 3rd St NE; 2nd St NE; Main St NE; California St NE; 5th St NE; 6th St NE; Washington St NE; 17th Ave NE.
Railroad features: Burlington Northern Santa Fe Rlwy.
Sheridan neighborhood detailed profile
Area: 0.314 square miles
Population: 4,500
Population density:
| Sheridan: | 14,338 people per square mile |
| Minneapolis: | 7,749 people per square mile |
Median household income in 2021:
| Sheridan: | $73,213 |
| Minneapolis: | $69,397 |
Median rent in in 2021:
| Sheridan: | $1,389 |
| Minneapolis: | $1,138 |
Male vs Females
| Males: | 2,639 |
| Females: | 1,860 |
Median age
| Males: | 48.5 years |
| Females: | 41.1 years |
Housing prices:
Average estimated value of detached houses in 2021 (23.6% of all units):
| Sheridan: | $282,365 |
| Minneapolis: | $398,431 |
Average estimated value of townhouses or other attached units in 2021 (5.5% of all units):
| This neighborhood: | $269,286 |
| city: | $376,360 |
Average estimated value of housing units in 2-unit structures in 2021 (32.0% of all units):
| This neighborhood: | $269,922 |
| Minneapolis: | $353,466 |
Average estimated '21 value of housing units in 5-or-more-unit structures (19.0% of all units):
| Sheridan: | $292,857 |
| Minneapolis: | $317,891 |
Most popular occupations of males: sales and office occupations (22.1%); service occupations (16.7%); management occupations (except farmers) (8.4%); education, training, and library occupations (7.9%); arts, design, entertainment, sports, and media occupations (7.1%); computer and mathematical occupations (6.1%); material moving occupations (5.9%)
Most popular occupations of females: service occupations (17.6%); sales and office occupations (17.6%); management occupations (except farmers) (16.2%); healthcare practitioners and technical occupations (11.8%); community and social services occupations (11.2%); business and financial operations occupations (11.0%); arts, design, entertainment, sports, and media occupations (6.6%)
Highways in this neighborhood: State Hwy 47 (University Ave NE).
Roads and streets: 13th Ave NE; 15th Ave NE; 14th Ave NE; 16th Ave NE; NE Grand St; Co Rd 23 (Marshall St NE); 4th St NE; 3rd St NE; 2nd St NE; Main St NE; California St NE; 5th St NE; 6th St NE; Washington St NE; 17th Ave NE.
Railroad features: Burlington Northern Santa Fe Rlwy.
Sheridan neighborhood detailed profile
Shingle Creek neighborhood in Minneapolis statistics: (Find on map)
Area: 0.496 square miles
Population: 2,920
Population density:
Median household income in 2021:
Median rent in in 2021:
Male vs Females
Median age
Housing prices:
Average estimated value of detached houses in 2021 (97.0% of all units):
Average estimated value of townhouses or other attached units in 2021 (4.6% of all units):
Average estimated '21 value of housing units in 5-or-more-unit structures (1.1% of all units):
Most popular occupations of males: production occupations (24.8%); sales and office occupations (17.6%); service occupations (14.1%); healthcare practitioners and technical occupations (13.1%); computer and mathematical occupations (8.8%); business and financial operations occupations (5.5%); management occupations (except farmers) (3.6%)
Most popular occupations of females: sales and office occupations (16.1%); service occupations (15.4%); life, physical, and social science occupations (10.8%); education, training, and library occupations (10.2%); management occupations (except farmers) (10.1%); production occupations (9.3%); business and financial operations occupations (8.1%)
Roads and streets: 51st Ave N; 52nd Ave N; 50th Ave N; 49th Ave N; Queen Ave N; Sheridan Ave N; Russell Ave N; Humboldt Ave N (Co Rd 57); Upton Ave N; Penn Ave N; Vincent Ave N; Washburn Ave N; Thomas Ave N; Morgan Ave N; Knox Ave N; Logan Ave N; Irving Ave N; Oliver Ave N; Newton Ave N; James Ave N; 52nd Ave.
Other features: Shingle Crk; Ryan Crk.
Shingle Creek neighborhood detailed profile
Area: 0.496 square miles
Population: 2,920
Population density:
| Shingle Creek: | 5,886 people per square mile |
| Minneapolis: | 7,749 people per square mile |
Median household income in 2021:
| Shingle Creek: | $75,251 |
| Minneapolis: | $69,397 |
Median rent in in 2021:
| Shingle Creek: | $1,009 |
| Minneapolis: | $1,138 |
Male vs Females
| Males: | 1,554 |
| Females: | 1,366 |
Median age
| Males: | 33.6 years |
| Females: | 34.7 years |
Housing prices:
Average estimated value of detached houses in 2021 (97.0% of all units):
| Shingle Creek: | $153,777 |
| Minneapolis: | $398,431 |
Average estimated value of townhouses or other attached units in 2021 (4.6% of all units):
| This neighborhood: | $120,761 |
| city: | $376,360 |
Average estimated '21 value of housing units in 5-or-more-unit structures (1.1% of all units):
| Shingle Creek: | $78,212 |
| Minneapolis: | $317,891 |
Most popular occupations of males: production occupations (24.8%); sales and office occupations (17.6%); service occupations (14.1%); healthcare practitioners and technical occupations (13.1%); computer and mathematical occupations (8.8%); business and financial operations occupations (5.5%); management occupations (except farmers) (3.6%)
Most popular occupations of females: sales and office occupations (16.1%); service occupations (15.4%); life, physical, and social science occupations (10.8%); education, training, and library occupations (10.2%); management occupations (except farmers) (10.1%); production occupations (9.3%); business and financial operations occupations (8.1%)
Roads and streets: 51st Ave N; 52nd Ave N; 50th Ave N; 49th Ave N; Queen Ave N; Sheridan Ave N; Russell Ave N; Humboldt Ave N (Co Rd 57); Upton Ave N; Penn Ave N; Vincent Ave N; Washburn Ave N; Thomas Ave N; Morgan Ave N; Knox Ave N; Logan Ave N; Irving Ave N; Oliver Ave N; Newton Ave N; James Ave N; 52nd Ave.
Other features: Shingle Crk; Ryan Crk.
Shingle Creek neighborhood detailed profile
Southwest neighborhood in Minneapolis statistics: (Find on map)
Area: 8.142 square miles
Population: 57,894
Population density:
Median household income in 2021:
Median rent in in 2021:
Male vs Females
Median age
Housing prices:
Average estimated value of detached houses in 2021 (71.6% of all units):
Average estimated value of townhouses or other attached units in 2021 (5.2% of all units):
Average estimated value of housing units in 2-unit structures in 2021 (9.5% of all units):
Average estimated '21 value of housing units in 3-to-4-unit structures (4.6% of all units):
Average estimated '21 value of housing units in 5-or-more-unit structures (16.5% of all units):
Most popular occupations of males: management occupations (except farmers) (18.2%); sales and office occupations (14.4%); business and financial operations occupations (9.7%); computer and mathematical occupations (9.0%); service occupations (7.0%); healthcare practitioners and technical occupations (6.5%); education, training, and library occupations (5.3%)
Most popular occupations of females: sales and office occupations (18.2%); management occupations (except farmers) (15.3%); business and financial operations occupations (11.4%); education, training, and library occupations (10.9%); service occupations (10.1%); healthcare practitioners and technical occupations (8.8%); arts, design, entertainment, sports, and media occupations (7.1%)
Limited-access highways (interstate or state) in this neighborhood: State Hwy 65 (Crosstown Hwy, I- 35, State Hwy 62).
Highways in this neighborhood: State Hwy 121; State Hwy 62 (Crosstown Hwy).
Roads and streets: W Minnehaha Pkwy; W 50th St; W 49th St; Nicollet Ave (Co Rd 52); Lyndale Ave S; Upton Ave S; Vincent Ave S; Washburn Ave S; Harriet Ave S; Bryant Ave S; W 51st St; W 56th St; Aldrich Ave S; W 58th St; W 53rd St; Colfax Ave S; Garfield Ave S; W 47th St; Pleasant Ave S; W 42nd St; W 57th St; W 44th St; W 48th St; Stevens Ave S; W 54th St; W 52nd St; W 61st St; W 40th St; W 55th St; W 46th St; W 59th St; W 43rd St; 1st Ave S; W 60th St; Pillsbury Ave S; W 41st St; Blaisdell Ave S; Xerxes Ave (Co Rd 31); Dupont Ave S; Fremont Ave S; W 38th St; W 45th St; Sheridan Ave S; Zenith Ave S; Wentworth Ave S; Chowen Ave S; Drew Ave S; W 39th St; Abbott Ave S; E Lake Harriet Pkwy; Ewing Ave S; York Ave S; Thomas Ave S; Beard Ave S; Morgan Ave S; Co Rd 32 (Penn Ave S); Oliver Ave S; Emerson Ave S; Queen Ave S; James Ave S; Knox Ave S; Grand Ave; Logan Ave S; Girard Ave S; E Lake Harriet Blvd; W 62nd St; Newton Ave S; Russell Ave S; Irving Ave S; Kings Hwy (Dupont Ave S); W 37th St; W Lake Harriet Pkwy; Grand Ave S; W Lake Harriet Blvd; Humboldt Ave S; Grass Lake Ter; W Calhoun Pkwy; Linden Hills Blvd; W Diamond Lake Rd; E Minnehaha Pkwy; W Elmwood Pl; Forestdale Rd; Belmont Ave; Prospect Ave; Sunrise Dr; Roseway Rd; William Berry Pkwy; Valley View Pl; Robbins St; Richfield Rd; Rustic Lodge Ave W; Gladstone Ave; Cumberland Rd; Richmond Curve; E 50th St; E 38th St (Co Rd 38); E Diamond Lake Rd; E 42nd St; E 46th St; W 59th 1/2 St; E 60th St; Colfax Ln S; Luverne Ave; E 51st St; Cromwell Dr; Park Dr; E 37th St; E 54th St; E 39th St; Rustic Lodge Ave E; E 40th St; E 49th St; E 43rd St; E 48th St; E 44th St; E 45th St; E 47th St; E 56th St; E 58th St; E 57th St; Elmwood Pl E; Brookwood Ter; E 61st St; Pratt St; Busch Ter; Van Nest Ave; E Calhoun Pkwy; Highview Pl; E 59th St; Longview Ter; Wentworth Ct W; E 62nd St; Motor Pl; Glendale Ter; Wentworth Ct E; Humboldt Cir; Red Cedar Ln; Thomas Cir S; Russell Ct; Girard Ct; E 53rd St; Morgan Ct; Cromwell Ct.
Railroad features: Canadian Pacific Rlwy.
Other features: Minnehaha Crk.
Southwest neighborhood detailed profile
Area: 8.142 square miles
Population: 57,894
Population density:
| Southwest: | 7,111 people per square mile |
| Minneapolis: | 7,749 people per square mile |
Median household income in 2021:
| Southwest: | $124,035 |
| Minneapolis: | $69,397 |
Median rent in in 2021:
| Southwest: | $1,278 |
| Minneapolis: | $1,138 |
Male vs Females
| Males: | 28,913 |
| Females: | 28,981 |
Median age
| Males: | 39.6 years |
| Females: | 39.1 years |
Housing prices:
Average estimated value of detached houses in 2021 (71.6% of all units):
| Southwest: | $458,219 |
| Minneapolis: | $398,431 |
Average estimated value of townhouses or other attached units in 2021 (5.2% of all units):
| This neighborhood: | $825,485 |
| city: | $376,360 |
Average estimated value of housing units in 2-unit structures in 2021 (9.5% of all units):
| This neighborhood: | $379,113 |
| Minneapolis: | $353,466 |
Average estimated '21 value of housing units in 3-to-4-unit structures (4.6% of all units):
| Southwest: | $1,532,760 |
| city: | $335,939 |
Average estimated '21 value of housing units in 5-or-more-unit structures (16.5% of all units):
| Southwest: | $195,107 |
| Minneapolis: | $317,891 |
Most popular occupations of males: management occupations (except farmers) (18.2%); sales and office occupations (14.4%); business and financial operations occupations (9.7%); computer and mathematical occupations (9.0%); service occupations (7.0%); healthcare practitioners and technical occupations (6.5%); education, training, and library occupations (5.3%)
Most popular occupations of females: sales and office occupations (18.2%); management occupations (except farmers) (15.3%); business and financial operations occupations (11.4%); education, training, and library occupations (10.9%); service occupations (10.1%); healthcare practitioners and technical occupations (8.8%); arts, design, entertainment, sports, and media occupations (7.1%)
Limited-access highways (interstate or state) in this neighborhood: State Hwy 65 (Crosstown Hwy, I- 35, State Hwy 62).
Highways in this neighborhood: State Hwy 121; State Hwy 62 (Crosstown Hwy).
Roads and streets: W Minnehaha Pkwy; W 50th St; W 49th St; Nicollet Ave (Co Rd 52); Lyndale Ave S; Upton Ave S; Vincent Ave S; Washburn Ave S; Harriet Ave S; Bryant Ave S; W 51st St; W 56th St; Aldrich Ave S; W 58th St; W 53rd St; Colfax Ave S; Garfield Ave S; W 47th St; Pleasant Ave S; W 42nd St; W 57th St; W 44th St; W 48th St; Stevens Ave S; W 54th St; W 52nd St; W 61st St; W 40th St; W 55th St; W 46th St; W 59th St; W 43rd St; 1st Ave S; W 60th St; Pillsbury Ave S; W 41st St; Blaisdell Ave S; Xerxes Ave (Co Rd 31); Dupont Ave S; Fremont Ave S; W 38th St; W 45th St; Sheridan Ave S; Zenith Ave S; Wentworth Ave S; Chowen Ave S; Drew Ave S; W 39th St; Abbott Ave S; E Lake Harriet Pkwy; Ewing Ave S; York Ave S; Thomas Ave S; Beard Ave S; Morgan Ave S; Co Rd 32 (Penn Ave S); Oliver Ave S; Emerson Ave S; Queen Ave S; James Ave S; Knox Ave S; Grand Ave; Logan Ave S; Girard Ave S; E Lake Harriet Blvd; W 62nd St; Newton Ave S; Russell Ave S; Irving Ave S; Kings Hwy (Dupont Ave S); W 37th St; W Lake Harriet Pkwy; Grand Ave S; W Lake Harriet Blvd; Humboldt Ave S; Grass Lake Ter; W Calhoun Pkwy; Linden Hills Blvd; W Diamond Lake Rd; E Minnehaha Pkwy; W Elmwood Pl; Forestdale Rd; Belmont Ave; Prospect Ave; Sunrise Dr; Roseway Rd; William Berry Pkwy; Valley View Pl; Robbins St; Richfield Rd; Rustic Lodge Ave W; Gladstone Ave; Cumberland Rd; Richmond Curve; E 50th St; E 38th St (Co Rd 38); E Diamond Lake Rd; E 42nd St; E 46th St; W 59th 1/2 St; E 60th St; Colfax Ln S; Luverne Ave; E 51st St; Cromwell Dr; Park Dr; E 37th St; E 54th St; E 39th St; Rustic Lodge Ave E; E 40th St; E 49th St; E 43rd St; E 48th St; E 44th St; E 45th St; E 47th St; E 56th St; E 58th St; E 57th St; Elmwood Pl E; Brookwood Ter; E 61st St; Pratt St; Busch Ter; Van Nest Ave; E Calhoun Pkwy; Highview Pl; E 59th St; Longview Ter; Wentworth Ct W; E 62nd St; Motor Pl; Glendale Ter; Wentworth Ct E; Humboldt Cir; Red Cedar Ln; Thomas Cir S; Russell Ct; Girard Ct; E 53rd St; Morgan Ct; Cromwell Ct.
Railroad features: Canadian Pacific Rlwy.
Other features: Minnehaha Crk.
Southwest neighborhood detailed profile
St. Anthony East neighborhood in Minneapolis statistics: (Find on map)
Area: 0.242 square miles
Population: 1,334
Population density:
Median household income in 2021:
Median rent in in 2021:
Male vs Females
Median age
Housing prices:
Average estimated value of detached houses in 2021 (12.5% of all units):
Average estimated value of townhouses or other attached units in 2021 (13.4% of all units):
Average estimated value of housing units in 2-unit structures in 2021 (12.1% of all units):
Average estimated '21 value of housing units in 5-or-more-unit structures (39.4% of all units):
Most popular occupations of males: arts, design, entertainment, sports, and media occupations (19.2%); architecture and engineering occupations (14.6%); service occupations (13.8%); sales and office occupations (12.7%); production occupations (11.4%); computer and mathematical occupations (7.7%); life, physical, and social science occupations (6.0%)
Most popular occupations of females: service occupations (18.6%); business and financial operations occupations (16.2%); sales and office occupations (16.1%); management occupations (except farmers) (12.7%); healthcare practitioners and technical occupations (11.7%); education, training, and library occupations (8.2%); arts, design, entertainment, sports, and media occupations (5.4%)
Highways in this neighborhood: State Hwy 65 (Central Ave NE).
Roads and streets: Spring St NE; Broadway St NE; Summer St NE; 3rd Ave NE; Madison St NE; Monroe St NE; Quincy St NE; Van Buren St NE; Jackson St NE; Jefferson St NE; Adams St NE; 12th Ave NE; Autumn St NE; 7th St NE; Washington St NE.
Railroad features: Burlington Northern Santa Fe Rlwy.
St. Anthony East neighborhood detailed profile
Area: 0.242 square miles
Population: 1,334
Population density:
| St. Anthony East: | 5,512 people per square mile |
| Minneapolis: | 7,749 people per square mile |
Median household income in 2021:
| St. Anthony East: | $70,688 |
| Minneapolis: | $69,397 |
Median rent in in 2021:
| St. Anthony East: | $791 |
| Minneapolis: | $1,138 |
Male vs Females
| Males: | 751 |
| Females: | 582 |
Median age
| Males: | 41.6 years |
| Females: | 34.6 years |
Housing prices:
Average estimated value of detached houses in 2021 (12.5% of all units):
| St. Anthony East: | $275,053 |
| Minneapolis: | $398,431 |
Average estimated value of townhouses or other attached units in 2021 (13.4% of all units):
| This neighborhood: | $395,455 |
| city: | $376,360 |
Average estimated value of housing units in 2-unit structures in 2021 (12.1% of all units):
| This neighborhood: | $234,134 |
| Minneapolis: | $353,466 |
Average estimated '21 value of housing units in 5-or-more-unit structures (39.4% of all units):
| St. Anthony East: | $113,881 |
| Minneapolis: | $317,891 |
Most popular occupations of males: arts, design, entertainment, sports, and media occupations (19.2%); architecture and engineering occupations (14.6%); service occupations (13.8%); sales and office occupations (12.7%); production occupations (11.4%); computer and mathematical occupations (7.7%); life, physical, and social science occupations (6.0%)
Most popular occupations of females: service occupations (18.6%); business and financial operations occupations (16.2%); sales and office occupations (16.1%); management occupations (except farmers) (12.7%); healthcare practitioners and technical occupations (11.7%); education, training, and library occupations (8.2%); arts, design, entertainment, sports, and media occupations (5.4%)
Highways in this neighborhood: State Hwy 65 (Central Ave NE).
Roads and streets: Spring St NE; Broadway St NE; Summer St NE; 3rd Ave NE; Madison St NE; Monroe St NE; Quincy St NE; Van Buren St NE; Jackson St NE; Jefferson St NE; Adams St NE; 12th Ave NE; Autumn St NE; 7th St NE; Washington St NE.
Railroad features: Burlington Northern Santa Fe Rlwy.
St. Anthony East neighborhood detailed profile
St. Anthony West neighborhood in Minneapolis statistics: (Find on map)
Area: 0.551 square miles
Population: 3,668
Population density:
Median household income in 2021:
Median rent in in 2021:
Male vs Females
Median age
Housing prices:
Average estimated value of detached houses in 2021 (19.7% of all units):
Average estimated value of townhouses or other attached units in 2021 (16.2% of all units):
Average estimated value of housing units in 2-unit structures in 2021 (23.5% of all units):
Average estimated '21 value of housing units in 5-or-more-unit structures (23.0% of all units):
Most popular occupations of males: sales and office occupations (18.2%); business and financial operations occupations (13.0%); management occupations (except farmers) (12.9%); production occupations (10.9%); service occupations (7.3%); arts, design, entertainment, sports, and media occupations (7.2%); computer and mathematical occupations (6.9%)
Most popular occupations of females: service occupations (14.9%); sales and office occupations (13.7%); business and financial operations occupations (13.5%); management occupations (except farmers) (13.2%); healthcare practitioners and technical occupations (8.3%); education, training, and library occupations (8.2%); arts, design, entertainment, sports, and media occupations (8.0%)
Highways in this neighborhood: State Hwy 47 (University Ave NE).
Roads and streets: Broadway St NE; 8th Ave NE; Main St NE; Co Rd 23 (Marshall St NE); 2nd St NE; 9th Ave NE; 7th Ave NE; 4th St NE; 5th St NE; Ramsey St NE; 6th Ave NE; 5th Ave NE; 3rd Ave NE; 4th Ave NE; Sibley St NE; 12th Ave NE; 11th Ave NE; 10th Ave NE; 6th St NE; Washington St NE; 13th Ave NE; Ramsey Cir NE; 3rd St NE; 3rd Ave; Summer St NE; Plymouth Ave NE; NE University Ave.
St. Anthony West neighborhood detailed profile
Area: 0.551 square miles
Population: 3,668
Population density:
| St. Anthony West: | 6,652 people per square mile |
| Minneapolis: | 7,749 people per square mile |
Median household income in 2021:
| St. Anthony West: | $69,146 |
| Minneapolis: | $69,397 |
Median rent in in 2021:
| St. Anthony West: | $1,038 |
| Minneapolis: | $1,138 |
Male vs Females
| Males: | 2,154 |
| Females: | 1,514 |
Median age
| Males: | 43.3 years |
| Females: | 37.6 years |
Housing prices:
Average estimated value of detached houses in 2021 (19.7% of all units):
| St. Anthony West: | $339,533 |
| Minneapolis: | $398,431 |
Average estimated value of townhouses or other attached units in 2021 (16.2% of all units):
| This neighborhood: | $481,274 |
| city: | $376,360 |
Average estimated value of housing units in 2-unit structures in 2021 (23.5% of all units):
| This neighborhood: | $234,079 |
| Minneapolis: | $353,466 |
Average estimated '21 value of housing units in 5-or-more-unit structures (23.0% of all units):
| St. Anthony West: | $129,477 |
| Minneapolis: | $317,891 |
Most popular occupations of males: sales and office occupations (18.2%); business and financial operations occupations (13.0%); management occupations (except farmers) (12.9%); production occupations (10.9%); service occupations (7.3%); arts, design, entertainment, sports, and media occupations (7.2%); computer and mathematical occupations (6.9%)
Most popular occupations of females: service occupations (14.9%); sales and office occupations (13.7%); business and financial operations occupations (13.5%); management occupations (except farmers) (13.2%); healthcare practitioners and technical occupations (8.3%); education, training, and library occupations (8.2%); arts, design, entertainment, sports, and media occupations (8.0%)
Highways in this neighborhood: State Hwy 47 (University Ave NE).
Roads and streets: Broadway St NE; 8th Ave NE; Main St NE; Co Rd 23 (Marshall St NE); 2nd St NE; 9th Ave NE; 7th Ave NE; 4th St NE; 5th St NE; Ramsey St NE; 6th Ave NE; 5th Ave NE; 3rd Ave NE; 4th Ave NE; Sibley St NE; 12th Ave NE; 11th Ave NE; 10th Ave NE; 6th St NE; Washington St NE; 13th Ave NE; Ramsey Cir NE; 3rd St NE; 3rd Ave; Summer St NE; Plymouth Ave NE; NE University Ave.
St. Anthony West neighborhood detailed profile
Standish neighborhood in Minneapolis statistics: (Find on map)
Area: 0.820 square miles
Population: 7,218
Population density:
Median household income in 2021:
Median rent in in 2021:
Male vs Females
Median age
Housing prices:
Average estimated value of detached houses in 2021 (74.3% of all units):
Average estimated value of townhouses or other attached units in 2021 (3.0% of all units):
Average estimated value of housing units in 2-unit structures in 2021 (8.2% of all units):
Average estimated '21 value of housing units in 5-or-more-unit structures (19.9% of all units):
Most popular occupations of males: sales and office occupations (17.3%); business and financial operations occupations (11.1%); service occupations (10.0%); computer and mathematical occupations (8.5%); construction, extraction, and maintenance occupations (7.4%); management occupations (except farmers) (6.1%); arts, design, entertainment, sports, and media occupations (5.9%)
Most popular occupations of females: sales and office occupations (14.5%); management occupations (except farmers) (14.4%); service occupations (13.4%); education, training, and library occupations (12.5%); healthcare practitioners and technical occupations (11.8%); architecture and engineering occupations (6.7%); community and social services occupations (5.2%)
Highways in this neighborhood: State Hwy 55 (Hiawatha Ave).
Roads and streets: E 40th St; E 41st St; E 39th St; E 38th St (Co Rd 38); E 37th St; E 42nd St; 21st Ave S; 23rd Ave S; 22nd Ave S; 24th Ave S; 25th Ave S; Standish Ave S; 27th Ave S; Co Rd 54 (28th Ave); 26th Ave S; 20th Ave S; Longfellow Ave S; E 43rd St; 19th Ave S; 30th Ave S; 29th Ave S; Nokomis Ave S; E 36th 1/2 St; 31st Ave S; 32nd Ave S; E 36th St.
Standish neighborhood detailed profile
Area: 0.820 square miles
Population: 7,218
Population density:
| Standish: | 8,808 people per square mile |
| Minneapolis: | 7,749 people per square mile |
Median household income in 2021:
| Standish: | $85,321 |
| Minneapolis: | $69,397 |
Median rent in in 2021:
| Standish: | $1,340 |
| Minneapolis: | $1,138 |
Male vs Females
| Males: | 3,619 |
| Females: | 3,599 |
Median age
| Males: | 37.1 years |
| Females: | 37.9 years |
Housing prices:
Average estimated value of detached houses in 2021 (74.3% of all units):
| Standish: | $300,073 |
| Minneapolis: | $398,431 |
Average estimated value of townhouses or other attached units in 2021 (3.0% of all units):
| This neighborhood: | $276,948 |
| city: | $376,360 |
Average estimated value of housing units in 2-unit structures in 2021 (8.2% of all units):
| This neighborhood: | $256,667 |
| Minneapolis: | $353,466 |
Average estimated '21 value of housing units in 5-or-more-unit structures (19.9% of all units):
| Standish: | $58,227 |
| Minneapolis: | $317,891 |
Most popular occupations of males: sales and office occupations (17.3%); business and financial operations occupations (11.1%); service occupations (10.0%); computer and mathematical occupations (8.5%); construction, extraction, and maintenance occupations (7.4%); management occupations (except farmers) (6.1%); arts, design, entertainment, sports, and media occupations (5.9%)
Most popular occupations of females: sales and office occupations (14.5%); management occupations (except farmers) (14.4%); service occupations (13.4%); education, training, and library occupations (12.5%); healthcare practitioners and technical occupations (11.8%); architecture and engineering occupations (6.7%); community and social services occupations (5.2%)
Highways in this neighborhood: State Hwy 55 (Hiawatha Ave).
Roads and streets: E 40th St; E 41st St; E 39th St; E 38th St (Co Rd 38); E 37th St; E 42nd St; 21st Ave S; 23rd Ave S; 22nd Ave S; 24th Ave S; 25th Ave S; Standish Ave S; 27th Ave S; Co Rd 54 (28th Ave); 26th Ave S; 20th Ave S; Longfellow Ave S; E 43rd St; 19th Ave S; 30th Ave S; 29th Ave S; Nokomis Ave S; E 36th 1/2 St; 31st Ave S; 32nd Ave S; E 36th St.
Standish neighborhood detailed profile
Stevens Square neighborhood in Minneapolis statistics: (Find on map)
Area: 0.187 square miles
Population: 2,368
Population density:
Median household income in 2021:
Median rent in in 2021:
Male vs Females
Median age
Housing prices:
Average estimated value of detached houses in 2021 (4.3% of all units):
Average estimated '21 value of housing units in 5-or-more-unit structures (9.8% of all units):
Most popular occupations of males: service occupations (18.7%); sales and office occupations (15.0%); management occupations (except farmers) (14.4%); business and financial operations occupations (12.3%); production occupations (9.5%); computer and mathematical occupations (8.2%); transportation occupations (4.7%)
Most popular occupations of females: service occupations (22.4%); sales and office occupations (20.9%); management occupations (except farmers) (19.8%); business and financial operations occupations (11.6%); community and social services occupations (6.8%); education, training, and library occupations (5.7%); transportation occupations (4.8%)
Limited-access highways (interstate or state) in this neighborhood: I- 35 (State Hwy 65).
Roads and streets: Co Rd 5 (W Franklin Ave); E 18th St; E 19th St; Co Rd 5 (E Franklin Ave); E 17th St; 1st Ave S; 2nd Ave S; Stevens Ave S; 3rd Ave S; Clinton Ave S; Groveland Ave; Ridgewood Ave; Co Rd 52 (Nicollet Ave); 4th Ave S; Pillsbury Ave S; Lasalle Ave; Pleasant Ave; Blaisdell Ave S.
Stevens Square neighborhood detailed profile
Area: 0.187 square miles
Population: 2,368
Population density:
| Stevens Square: | 12,657 people per square mile |
| Minneapolis: | 7,749 people per square mile |
Median household income in 2021:
| Stevens Square: | $40,804 |
| Minneapolis: | $69,397 |
Median rent in in 2021:
| Stevens Square: | $676 |
| Minneapolis: | $1,138 |
Male vs Females
| Males: | 1,510 |
| Females: | 858 |
Median age
| Males: | 34.2 years |
| Females: | 32.4 years |
Housing prices:
Average estimated value of detached houses in 2021 (4.3% of all units):
| Stevens Square: | $362,719 |
| Minneapolis: | $398,431 |
Average estimated '21 value of housing units in 5-or-more-unit structures (9.8% of all units):
| Stevens Square: | $29,657 |
| Minneapolis: | $317,891 |
Most popular occupations of males: service occupations (18.7%); sales and office occupations (15.0%); management occupations (except farmers) (14.4%); business and financial operations occupations (12.3%); production occupations (9.5%); computer and mathematical occupations (8.2%); transportation occupations (4.7%)
Most popular occupations of females: service occupations (22.4%); sales and office occupations (20.9%); management occupations (except farmers) (19.8%); business and financial operations occupations (11.6%); community and social services occupations (6.8%); education, training, and library occupations (5.7%); transportation occupations (4.8%)
Limited-access highways (interstate or state) in this neighborhood: I- 35 (State Hwy 65).
Roads and streets: Co Rd 5 (W Franklin Ave); E 18th St; E 19th St; Co Rd 5 (E Franklin Ave); E 17th St; 1st Ave S; 2nd Ave S; Stevens Ave S; 3rd Ave S; Clinton Ave S; Groveland Ave; Ridgewood Ave; Co Rd 52 (Nicollet Ave); 4th Ave S; Pillsbury Ave S; Lasalle Ave; Pleasant Ave; Blaisdell Ave S.
Stevens Square neighborhood detailed profile
Sumner-glenwood neighborhood in Minneapolis statistics: (Find on map)
Area: 0.220 square miles
Population: 2,361
Population density:
Median household income in 2021:
Median rent in in 2021:
Male vs Females
Median age
Housing prices:
Average estimated value of detached houses in 2021 (2.4% of all units):
Average estimated value of townhouses or other attached units in 2021 (6.7% of all units):
Average estimated '21 value of housing units in 5-or-more-unit structures (76.6% of all units):
Most popular occupations of males: sales and office occupations (67.6%); service occupations (9.9%); business and financial operations occupations (6.6%); computer and mathematical occupations (5.9%); production occupations (5.6%); management occupations (except farmers) (4.3%)
Most popular occupations of females: service occupations (41.5%); sales and office occupations (16.5%); education, training, and library occupations (14.3%); healthcare practitioners and technical occupations (13.5%); transportation occupations (5.9%); production occupations (4.5%); business and financial operations occupations (2.6%)
Limited-access highways (interstate or state) in this neighborhood: I- 94 (US Hwy 52).
Highways in this neighborhood: State Hwy 55 (Olson Memorial Hwy).
Roads and streets: Lyndale Ave N; Glenwood Ave; Bryant Ave N; Dupont Ave N; 4th Ave N; 8th Ave N; 5th Ave N; Service Rd; N 7th St; Aldrich Ave N; Olson Highway Svc Rd (6th Ave N); 3rd Ave N; Fremont Ave N; Colfax Ave N; Market St; Lyndale Pl.
Other features: Bassett Crk.
Sumner-glenwood neighborhood detailed profile
Area: 0.220 square miles
Population: 2,361
Population density:
| Sumner-glenwood: | 10,741 people per square mile |
| Minneapolis: | 7,749 people per square mile |
Median household income in 2021:
| Sumner-glenwood: | $61,113 |
| Minneapolis: | $69,397 |
Median rent in in 2021:
| Sumner-glenwood: | $736 |
| Minneapolis: | $1,138 |
Male vs Females
| Males: | 1,157 |
| Females: | 1,203 |
Median age
| Males: | 26.2 years |
| Females: | 31.3 years |
Housing prices:
Average estimated value of detached houses in 2021 (2.4% of all units):
| Sumner-glenwood: | $6,953 |
| Minneapolis: | $398,431 |
Average estimated value of townhouses or other attached units in 2021 (6.7% of all units):
| This neighborhood: | $252,742 |
| city: | $376,360 |
Average estimated '21 value of housing units in 5-or-more-unit structures (76.6% of all units):
| Sumner-glenwood: | $292,750 |
| Minneapolis: | $317,891 |
Most popular occupations of males: sales and office occupations (67.6%); service occupations (9.9%); business and financial operations occupations (6.6%); computer and mathematical occupations (5.9%); production occupations (5.6%); management occupations (except farmers) (4.3%)
Most popular occupations of females: service occupations (41.5%); sales and office occupations (16.5%); education, training, and library occupations (14.3%); healthcare practitioners and technical occupations (13.5%); transportation occupations (5.9%); production occupations (4.5%); business and financial operations occupations (2.6%)
Limited-access highways (interstate or state) in this neighborhood: I- 94 (US Hwy 52).
Highways in this neighborhood: State Hwy 55 (Olson Memorial Hwy).
Roads and streets: Lyndale Ave N; Glenwood Ave; Bryant Ave N; Dupont Ave N; 4th Ave N; 8th Ave N; 5th Ave N; Service Rd; N 7th St; Aldrich Ave N; Olson Highway Svc Rd (6th Ave N); 3rd Ave N; Fremont Ave N; Colfax Ave N; Market St; Lyndale Pl.
Other features: Bassett Crk.
Sumner-glenwood neighborhood detailed profile
Tangletown neighborhood in Minneapolis statistics: (Find on map)
Area: 0.688 square miles
Population: 8,388
Population density:
Median household income in 2021:
Median rent in in 2021:
Male vs Females
Median age
Average estimated value of detached houses in 2021 (60.6% of all units):
Most popular occupations of males: legal occupations (17.6%); sales and office occupations (12.9%); computer and mathematical occupations (10.4%); education, training, and library occupations (8.6%); service occupations (8.4%); management occupations (except farmers) (7.8%); production occupations (6.8%)
Most popular occupations of females: arts, design, entertainment, sports, and media occupations (14.8%); management occupations (except farmers) (12.9%); service occupations (11.1%); education, training, and library occupations (10.5%); healthcare practitioners and technical occupations (10.3%); business and financial operations occupations (9.4%); life, physical, and social science occupations (6.5%)
Limited-access highways (interstate or state) in this neighborhood: I- 35 (State Hwy 65).
Roads and streets: W Minnehaha Pkwy; Harriet Ave S; Co Rd 52 (Nicollet Ave); Stevens Ave S; Garfield Ave S; W 50th St; W 47th St; W 48th St; W 49th St; 1st Ave S; E Minnehaha Pkwy; W Elmwood Pl; Belmont Ave; Prospect Ave; Wentworth Ave S; W 52nd St; Pleasant Ave S; Valley View Pl; Rustic Lodge Ave W; Gladstone Ave; Grand Ave; E 50th St; Luverne Ave; E 51st St; E 54th St; Rustic Lodge Ave E; E 49th St; E 48th St; E 47th St; Elmwood Pl E; Pratt St; Grand Ave S; Busch Ter; Pillsbury Ave S; Blaisdell Ave S; Highview Pl; Longview Ter; W Diamond Lake Rd; W 53rd St; W 54th St; E Diamond Lake Rd; W 51st St; E 53rd St.
Other features: Minnehaha Crk.
Tangletown neighborhood detailed profile
Area: 0.688 square miles
Population: 8,388
Population density:
| Tangletown: | 12,193 people per square mile |
| Minneapolis: | 7,749 people per square mile |
Median household income in 2021:
| Tangletown: | $157,287 |
| Minneapolis: | $69,397 |
Median rent in in 2021:
| Tangletown: | $1,323 |
| Minneapolis: | $1,138 |
Male vs Females
| Males: | 3,833 |
| Females: | 4,554 |
Median age
| Males: | 39.1 years |
| Females: | 42.0 years |
Average estimated value of detached houses in 2021 (60.6% of all units):
| Tangletown: | $472,085 |
| Minneapolis: | $398,431 |
Most popular occupations of males: legal occupations (17.6%); sales and office occupations (12.9%); computer and mathematical occupations (10.4%); education, training, and library occupations (8.6%); service occupations (8.4%); management occupations (except farmers) (7.8%); production occupations (6.8%)
Most popular occupations of females: arts, design, entertainment, sports, and media occupations (14.8%); management occupations (except farmers) (12.9%); service occupations (11.1%); education, training, and library occupations (10.5%); healthcare practitioners and technical occupations (10.3%); business and financial operations occupations (9.4%); life, physical, and social science occupations (6.5%)
Limited-access highways (interstate or state) in this neighborhood: I- 35 (State Hwy 65).
Roads and streets: W Minnehaha Pkwy; Harriet Ave S; Co Rd 52 (Nicollet Ave); Stevens Ave S; Garfield Ave S; W 50th St; W 47th St; W 48th St; W 49th St; 1st Ave S; E Minnehaha Pkwy; W Elmwood Pl; Belmont Ave; Prospect Ave; Wentworth Ave S; W 52nd St; Pleasant Ave S; Valley View Pl; Rustic Lodge Ave W; Gladstone Ave; Grand Ave; E 50th St; Luverne Ave; E 51st St; E 54th St; Rustic Lodge Ave E; E 49th St; E 48th St; E 47th St; Elmwood Pl E; Pratt St; Grand Ave S; Busch Ter; Pillsbury Ave S; Blaisdell Ave S; Highview Pl; Longview Ter; W Diamond Lake Rd; W 53rd St; W 54th St; E Diamond Lake Rd; W 51st St; E 53rd St.
Other features: Minnehaha Crk.
Tangletown neighborhood detailed profile
University neighborhood in Minneapolis statistics: (Find on map)
Area: 5.714 square miles
Population: 72,006
Population density:
Median household income in 2021:
Median rent in in 2021:
Male vs Females
Median age
Housing prices:
Average estimated value of detached houses in 2021 (6.0% of all units):
Average estimated value of townhouses or other attached units in 2021 (5.5% of all units):
Average estimated value of housing units in 2-unit structures in 2021 (5.3% of all units):
Average estimated '21 value of housing units in 5-or-more-unit structures (52.4% of all units):
Most popular occupations of males: sales and office occupations (14.2%); service occupations (13.4%); education, training, and library occupations (11.3%); management occupations (except farmers) (10.5%); business and financial operations occupations (7.8%); healthcare practitioners and technical occupations (7.5%); architecture and engineering occupations (7.4%)
Most popular occupations of females: service occupations (22.8%); sales and office occupations (16.1%); education, training, and library occupations (15.5%); management occupations (except farmers) (11.0%); business and financial operations occupations (8.1%); arts, design, entertainment, sports, and media occupations (7.1%); healthcare practitioners and technical occupations (7.1%)
Limited-access highways (interstate or state) in this neighborhood: I- 94 (US Hwy 12, US Hwy 52); I- 35.
Highways in this neighborhood: University Ave SE (State Hwy 47); Washington Ave SE (State Hwy 122); State Hwy 122; State Hwy 65 (Central Ave SE); University Ave NE (State Hwy 47); State Hwy 65 (Central Ave NE).
Roads and streets: 4th St SE; E Hennepin Ave; E River Pkwy (E River Rd); 5th St SE; Broadway St NE; Como Ave SE; Talmage Ave SE; 10th Ave SE; 8th St SE; W River Pkwy; Elm St SE; 6th St SE; 7th St SE; Delaware St SE; Co Rd 27 (Stinson Blvd); 27th Ave SE (Co Rd 5); 15th Ave SE; Main St SE; 6th St S; 2nd St SE; Riverside Ave; 14th Ave SE; S 7th St; 29th Ave SE; Franklin Ave SE; Malcolm Ave SE; 1st Ave NE; Arthur Ave SE; Kasota Ave SE; Kennedy St NE; 11th Ave SE; Industrial Blvd NE; 13th Ave SE; S 8th St; 12th Ave SE; Weeks Ave SE; 25th Ave SE; 6th Ave SE; E River Ter; Fairmount Ave SE; Bedford St SE; 18th Ave SE; 17th Ave SE; 5th Ave SE; Winter St NE; Hoover St NE; Oak St SE; 19th Ave S; Traffic St NE; 24th Ave SE; Essex St SE; 7th Ave SE; Orlin Ave SE; 2nd Ave SE; Spring St NE (Kennedy St NE); Johnson St NE; Emerald St SE; 9th St SE; Seymour Ave SE; Summer St NE; 26th Ave SE; 3rd Ave SE; Butler Pl S; S 4th St; Taft St NE; 21st Ave S; 8th Ave SE; 33rd Ave SE; Cedar Ave S; Pleasant St SE; Ontario St SE; Island Ave E (E Island Ave); 19th Ave SE; 23rd Ave SE; 20th Ave S; Fulton St SE; 22nd Ave SE; 21st Ave SE; Cecil St SE; Church St SE; 22nd Ave S; Williams Ave SE; Cole Ave SE; 16th Ave SE; Melbourne Ave SE; W Island Ave; Pillsbury Dr SE; Cleveland St NE; Co Rd 88 (New Brighton Blvd); Harding St NE; S 5th St; Rollins Ave SE; Godward St NE; Erie St SE; Clarence Ave SE; Sharon Ave SE; 4th Ave SE; 20th Ave SE; 23rd Ave S; 15th Ave S; S 2nd St; S 1st St; Arthur St NE; Washington Ave S; Harrison St NE; St Anthony Ave; 3rd St S; 30th Ave SE; 9th Ave SE; St Marys Ave SE; Yale Ave SE; Harvard St SE; Brook Ave SE; Union St SE; Ulysses St NE; 25th Ave S; Barton Ave SE; Huron Blvd SE; 5th St; 16th Ave S; Grove St; Warwick St SE; Roosevelt St NE; NE Wilson St; Broadway Rd NE; Beacon St SE; de la Salle Dr; Main St NE; Thornton St SE; 5th St NE; 27th Ave S; 4th St NE; 26th Ave S; Nicollet St; Maple Pl; Sidney Pl; Bank St SE; Power St; 6th St NE; 2nd St NE; 24th Ave S; McKinley Pl NE; R St NE; Delano St NE; Bluff St S; 28th Ave SE; Merriam St; Merriam Rd (Merriam St); S 7th 1/2 St; Seymour Pl SE; 14th Ave S; Arlington St; Coolidge St NE; Dartmouth Pl SE; Dartmouth Ave SE; Ortman St SE; Wilder St; Walnut St SE; Kasota Cir SE; Lourdes Pl; Locust St S; Huron St; 7th St NE; Co Rd 5 (E Franklin Ave); Paul Pl; Prospect Ter SE; River Terrace Ct; Superior St SE; Franklin Ter; St Anthony Blvd; Eastman Ave; 3rd Ave; St Marys Pl; Co Rd 54 (28th Ave); 7th St S; 17th Ave S; Arthur Pl SE.
Railroad features: Burlington Northern Santa Fe Rlwy; Canadian Pacific Rlwy; Minnesota Commercial RR.
Limited-access highways (interstate or state) in this neighborhood: .
Roads and streets: Emerald St SE; St Anthony Ave.
University neighborhood detailed profile
Area: 5.714 square miles
Population: 72,006
Population density:
| University: | 12,601 people per square mile |
| Minneapolis: | 7,749 people per square mile |
Median household income in 2021:
| University: | $62,869 |
| Minneapolis: | $69,397 |
Median rent in in 2021:
| University: | $1,222 |
| Minneapolis: | $1,138 |
Male vs Females
| Males: | 36,237 |
| Females: | 35,769 |
Median age
| Males: | 33.0 years |
| Females: | 34.4 years |
Housing prices:
Average estimated value of detached houses in 2021 (6.0% of all units):
| University: | $488,991 |
| Minneapolis: | $398,431 |
Average estimated value of townhouses or other attached units in 2021 (5.5% of all units):
| This neighborhood: | $730,402 |
| city: | $376,360 |
Average estimated value of housing units in 2-unit structures in 2021 (5.3% of all units):
| This neighborhood: | $280,758 |
| Minneapolis: | $353,466 |
Average estimated '21 value of housing units in 5-or-more-unit structures (52.4% of all units):
| University: | $417,244 |
| Minneapolis: | $317,891 |
Most popular occupations of males: sales and office occupations (14.2%); service occupations (13.4%); education, training, and library occupations (11.3%); management occupations (except farmers) (10.5%); business and financial operations occupations (7.8%); healthcare practitioners and technical occupations (7.5%); architecture and engineering occupations (7.4%)
Most popular occupations of females: service occupations (22.8%); sales and office occupations (16.1%); education, training, and library occupations (15.5%); management occupations (except farmers) (11.0%); business and financial operations occupations (8.1%); arts, design, entertainment, sports, and media occupations (7.1%); healthcare practitioners and technical occupations (7.1%)
Limited-access highways (interstate or state) in this neighborhood: I- 94 (US Hwy 12, US Hwy 52); I- 35.
Highways in this neighborhood: University Ave SE (State Hwy 47); Washington Ave SE (State Hwy 122); State Hwy 122; State Hwy 65 (Central Ave SE); University Ave NE (State Hwy 47); State Hwy 65 (Central Ave NE).
Roads and streets: 4th St SE; E Hennepin Ave; E River Pkwy (E River Rd); 5th St SE; Broadway St NE; Como Ave SE; Talmage Ave SE; 10th Ave SE; 8th St SE; W River Pkwy; Elm St SE; 6th St SE; 7th St SE; Delaware St SE; Co Rd 27 (Stinson Blvd); 27th Ave SE (Co Rd 5); 15th Ave SE; Main St SE; 6th St S; 2nd St SE; Riverside Ave; 14th Ave SE; S 7th St; 29th Ave SE; Franklin Ave SE; Malcolm Ave SE; 1st Ave NE; Arthur Ave SE; Kasota Ave SE; Kennedy St NE; 11th Ave SE; Industrial Blvd NE; 13th Ave SE; S 8th St; 12th Ave SE; Weeks Ave SE; 25th Ave SE; 6th Ave SE; E River Ter; Fairmount Ave SE; Bedford St SE; 18th Ave SE; 17th Ave SE; 5th Ave SE; Winter St NE; Hoover St NE; Oak St SE; 19th Ave S; Traffic St NE; 24th Ave SE; Essex St SE; 7th Ave SE; Orlin Ave SE; 2nd Ave SE; Spring St NE (Kennedy St NE); Johnson St NE; Emerald St SE; 9th St SE; Seymour Ave SE; Summer St NE; 26th Ave SE; 3rd Ave SE; Butler Pl S; S 4th St; Taft St NE; 21st Ave S; 8th Ave SE; 33rd Ave SE; Cedar Ave S; Pleasant St SE; Ontario St SE; Island Ave E (E Island Ave); 19th Ave SE; 23rd Ave SE; 20th Ave S; Fulton St SE; 22nd Ave SE; 21st Ave SE; Cecil St SE; Church St SE; 22nd Ave S; Williams Ave SE; Cole Ave SE; 16th Ave SE; Melbourne Ave SE; W Island Ave; Pillsbury Dr SE; Cleveland St NE; Co Rd 88 (New Brighton Blvd); Harding St NE; S 5th St; Rollins Ave SE; Godward St NE; Erie St SE; Clarence Ave SE; Sharon Ave SE; 4th Ave SE; 20th Ave SE; 23rd Ave S; 15th Ave S; S 2nd St; S 1st St; Arthur St NE; Washington Ave S; Harrison St NE; St Anthony Ave; 3rd St S; 30th Ave SE; 9th Ave SE; St Marys Ave SE; Yale Ave SE; Harvard St SE; Brook Ave SE; Union St SE; Ulysses St NE; 25th Ave S; Barton Ave SE; Huron Blvd SE; 5th St; 16th Ave S; Grove St; Warwick St SE; Roosevelt St NE; NE Wilson St; Broadway Rd NE; Beacon St SE; de la Salle Dr; Main St NE; Thornton St SE; 5th St NE; 27th Ave S; 4th St NE; 26th Ave S; Nicollet St; Maple Pl; Sidney Pl; Bank St SE; Power St; 6th St NE; 2nd St NE; 24th Ave S; McKinley Pl NE; R St NE; Delano St NE; Bluff St S; 28th Ave SE; Merriam St; Merriam Rd (Merriam St); S 7th 1/2 St; Seymour Pl SE; 14th Ave S; Arlington St; Coolidge St NE; Dartmouth Pl SE; Dartmouth Ave SE; Ortman St SE; Wilder St; Walnut St SE; Kasota Cir SE; Lourdes Pl; Locust St S; Huron St; 7th St NE; Co Rd 5 (E Franklin Ave); Paul Pl; Prospect Ter SE; River Terrace Ct; Superior St SE; Franklin Ter; St Anthony Blvd; Eastman Ave; 3rd Ave; St Marys Pl; Co Rd 54 (28th Ave); 7th St S; 17th Ave S; Arthur Pl SE.
Railroad features: Burlington Northern Santa Fe Rlwy; Canadian Pacific Rlwy; Minnesota Commercial RR.
Limited-access highways (interstate or state) in this neighborhood: .
Roads and streets: Emerald St SE; St Anthony Ave.
University neighborhood detailed profile
University Of Minnesota neighborhood in Minneapolis statistics: (Find on map)
Area: 0.668 square miles
Highways in this neighborhood: Washington Ave SE (State Hwy 122); State Hwy 122.
Roads and streets: E River Pkwy (E River Rd); Delaware St SE; University Ave SE; Oak St SE; Church St SE; 4th St SE; Pleasant St SE; Pillsbury Dr SE; 5th St SE; Harvard St SE; Union St SE; S 2nd St; S 4th St; Fulton St SE; 18th Ave SE; 17th Ave SE; 19th Ave S; 21st Ave S; 3rd St S; 14th Ave SE; 5th St; 19th Ave SE; Arlington St; Walnut St SE; 16th Ave SE; Washington Ave S; 10th Ave SE; W River Pkwy.
Railroad features: Burlington Northern Santa Fe Rlwy; Canadian Pacific Rlwy.
University Of Minnesota neighborhood detailed profile
Victory neighborhood in Minneapolis statistics: (Find on map)
Area: 0.684 square miles
Population: 4,550
Population density:
Median household income in 2021:
Median rent in in 2021:
Male vs Females
Median age
Housing prices:
Average estimated value of detached houses in 2021 (77.1% of all units):
Average estimated value of townhouses or other attached units in 2021 (2.5% of all units):
Average estimated '21 value of housing units in 5-or-more-unit structures (19.2% of all units):
Most popular occupations of males: management occupations (except farmers) (15.8%); sales and office occupations (12.8%); material moving occupations (12.0%); computer and mathematical occupations (10.6%); education, training, and library occupations (6.5%); service occupations (6.2%); transportation occupations (5.7%)
Most popular occupations of females: sales and office occupations (29.6%); education, training, and library occupations (16.1%); service occupations (11.9%); management occupations (except farmers) (11.4%); business and financial operations occupations (7.2%); arts, design, entertainment, sports, and media occupations (6.5%); community and social services occupations (4.3%)
Roads and streets: Queen Ave N; Co Rd 2 (Penn Ave N); Russell Ave N; Washburn Ave N; Upton Ave N; Sheridan Ave N; Vincent Ave N; Thomas Ave N; Osseo Rd; 43rd Ave N; 42nd Ave N; Victory Memorial Dr (Memorial Pkwy, Memorial Dr); 44th Ave N; 45th Ave N; 40th Ave N; 41st Ave N; 39th Ave N; Oliver Ave N; Memorial Pkwy (Victory Memorial Dr); 46th Ave N; 47th Ave N; 38th Ave N (Dowling Ave N); Newton Ave N; Xerxes Ave N; Victory Ave N.
Railroad features: Canadian Pacific Rlwy.
Other features: Ryan Crk.
Victory neighborhood detailed profile
Area: 0.684 square miles
Population: 4,550
Population density:
| Victory: | 6,654 people per square mile |
| Minneapolis: | 7,749 people per square mile |
Median household income in 2021:
| Victory: | $73,440 |
| Minneapolis: | $69,397 |
Median rent in in 2021:
| Victory: | $836 |
| Minneapolis: | $1,138 |
Male vs Females
| Males: | 2,216 |
| Females: | 2,334 |
Median age
| Males: | 40.2 years |
| Females: | 37.2 years |
Housing prices:
Average estimated value of detached houses in 2021 (77.1% of all units):
| Victory: | $205,495 |
| Minneapolis: | $398,431 |
Average estimated value of townhouses or other attached units in 2021 (2.5% of all units):
| This neighborhood: | $177,952 |
| city: | $376,360 |
Average estimated '21 value of housing units in 5-or-more-unit structures (19.2% of all units):
| Victory: | $78,212 |
| Minneapolis: | $317,891 |
Most popular occupations of males: management occupations (except farmers) (15.8%); sales and office occupations (12.8%); material moving occupations (12.0%); computer and mathematical occupations (10.6%); education, training, and library occupations (6.5%); service occupations (6.2%); transportation occupations (5.7%)
Most popular occupations of females: sales and office occupations (29.6%); education, training, and library occupations (16.1%); service occupations (11.9%); management occupations (except farmers) (11.4%); business and financial operations occupations (7.2%); arts, design, entertainment, sports, and media occupations (6.5%); community and social services occupations (4.3%)
Roads and streets: Queen Ave N; Co Rd 2 (Penn Ave N); Russell Ave N; Washburn Ave N; Upton Ave N; Sheridan Ave N; Vincent Ave N; Thomas Ave N; Osseo Rd; 43rd Ave N; 42nd Ave N; Victory Memorial Dr (Memorial Pkwy, Memorial Dr); 44th Ave N; 45th Ave N; 40th Ave N; 41st Ave N; 39th Ave N; Oliver Ave N; Memorial Pkwy (Victory Memorial Dr); 46th Ave N; 47th Ave N; 38th Ave N (Dowling Ave N); Newton Ave N; Xerxes Ave N; Victory Ave N.
Railroad features: Canadian Pacific Rlwy.
Other features: Ryan Crk.
Victory neighborhood detailed profile
Waite Park neighborhood in Minneapolis statistics: (Find on map)
Area: 0.880 square miles
Population: 7,228
Population density:
Median household income in 2021:
Median rent in in 2021:
Male vs Females
Median age
Average estimated value of detached houses in 2021 (86.5% of all units):
Most popular occupations of males: sales and office occupations (13.2%); management occupations (except farmers) (10.8%); production occupations (9.5%); service occupations (9.1%); material moving occupations (7.6%); business and financial operations occupations (6.9%); arts, design, entertainment, sports, and media occupations (5.8%)
Most popular occupations of females: sales and office occupations (25.0%); education, training, and library occupations (14.3%); service occupations (10.5%); business and financial operations occupations (9.0%); management occupations (except farmers) (8.3%); healthcare practitioners and technical occupations (7.4%); computer and mathematical occupations (5.8%)
Roads and streets: 36th Ave NE; 32nd Ave NE; 33rd Ave NE; 34th Ave NE; 31st Ave NE; NE Benjamin St; McKinley St NE; NE Cleveland St; 35th Ave NE; Stinson Blvd (Co Rd 27); Fillmore St NE; Johnson St NE; Saint Anthony Pkwy (Saint Anthony Blvd); NE Pierce St; Garfield St NE; NE Buchanan St; NE Lincoln St; NE Ulysses St; NE Polk St; NE Tyler St; NE Taylor St; NE Hayes St; NE Arthur St; NE Hollywood Ave; 30th Ave NE; Co Rd 94 (Co Rd C, 29th Ave NE); 36th 1/2 Ave NE; Brighton Ave NE; NE Wilshire Pl.
Railroad features: Canadian Pacific Rlwy.
Waite Park neighborhood detailed profile
Area: 0.880 square miles
Population: 7,228
Population density:
| Waite Park: | 8,213 people per square mile |
| Minneapolis: | 7,749 people per square mile |
Median household income in 2021:
| Waite Park: | $97,995 |
| Minneapolis: | $69,397 |
Median rent in in 2021:
| Waite Park: | $1,060 |
| Minneapolis: | $1,138 |
Male vs Females
| Males: | 3,636 |
| Females: | 3,592 |
Median age
| Males: | 39.5 years |
| Females: | 39.1 years |
Average estimated value of detached houses in 2021 (86.5% of all units):
| Waite Park: | $260,244 |
| Minneapolis: | $398,431 |
Most popular occupations of males: sales and office occupations (13.2%); management occupations (except farmers) (10.8%); production occupations (9.5%); service occupations (9.1%); material moving occupations (7.6%); business and financial operations occupations (6.9%); arts, design, entertainment, sports, and media occupations (5.8%)
Most popular occupations of females: sales and office occupations (25.0%); education, training, and library occupations (14.3%); service occupations (10.5%); business and financial operations occupations (9.0%); management occupations (except farmers) (8.3%); healthcare practitioners and technical occupations (7.4%); computer and mathematical occupations (5.8%)
Roads and streets: 36th Ave NE; 32nd Ave NE; 33rd Ave NE; 34th Ave NE; 31st Ave NE; NE Benjamin St; McKinley St NE; NE Cleveland St; 35th Ave NE; Stinson Blvd (Co Rd 27); Fillmore St NE; Johnson St NE; Saint Anthony Pkwy (Saint Anthony Blvd); NE Pierce St; Garfield St NE; NE Buchanan St; NE Lincoln St; NE Ulysses St; NE Polk St; NE Tyler St; NE Taylor St; NE Hayes St; NE Arthur St; NE Hollywood Ave; 30th Ave NE; Co Rd 94 (Co Rd C, 29th Ave NE); 36th 1/2 Ave NE; Brighton Ave NE; NE Wilshire Pl.
Railroad features: Canadian Pacific Rlwy.
Waite Park neighborhood detailed profile
Webber-Camden neighborhood in Minneapolis statistics: (Find on map)
Area: 0.920 square miles
Population: 7,330
Population density:
Median household income in 2021:
Median rent in in 2021:
Male vs Females
Median age
Average estimated value of detached houses in 2021 (85.2% of all units):
Most popular occupations of males: service occupations (16.7%); sales and office occupations (16.0%); material moving occupations (9.8%); construction, extraction, and maintenance occupations (8.5%); production occupations (7.5%); business and financial operations occupations (6.8%); transportation occupations (5.7%)
Most popular occupations of females: sales and office occupations (23.1%); service occupations (19.0%); arts, design, entertainment, sports, and media occupations (16.0%); healthcare practitioners and technical occupations (10.1%); management occupations (except farmers) (7.7%); education, training, and library occupations (5.7%); business and financial operations occupations (5.4%)
Limited-access highways (interstate or state) in this neighborhood: I- 94 (US Hwy 52).
Roads and streets: 42nd Ave N; 39th Ave N; 41st Ave N; Humboldt Ave N; 40th Ave N; 43rd Ave N; Webber Pkwy; Fremont Ave N; Girard Ave N; Emerson Ave N; 44th Ave N; Dupont Ave N; Colfax Ave N; Bryant Ave N; 38th Ave N (Dowling Ave N); James Ave N; Aldrich Ave N; Irving Ave N; Morgan Ave N; 45th Ave N; Lyndale Ave N; Co Rd 152 (N Mississippi Dr, Washington Ave N); Memorial Pkwy (Memorial Dr, Victory Memorial Dr); Memorial Pkwy (Victory Memorial Dr); 6th St N; Logan Ave N; Knox Ave N; N 4th St; 46th Ave N; N 3rd St.
Railroad features: Canadian Pacific Rlwy.
Other features: Shingle Crk.
Webber-Camden neighborhood detailed profile
Area: 0.920 square miles
Population: 7,330
Population density:
| Webber-Camden: | 7,965 people per square mile |
| Minneapolis: | 7,749 people per square mile |
Median household income in 2021:
| Webber-Camden: | $55,605 |
| Minneapolis: | $69,397 |
Median rent in in 2021:
| Webber-Camden: | $1,217 |
| Minneapolis: | $1,138 |
Male vs Females
| Males: | 3,671 |
| Females: | 3,658 |
Median age
| Males: | 35.0 years |
| Females: | 37.0 years |
Average estimated value of detached houses in 2021 (85.2% of all units):
| Webber-Camden: | $176,882 |
| Minneapolis: | $398,431 |
Most popular occupations of males: service occupations (16.7%); sales and office occupations (16.0%); material moving occupations (9.8%); construction, extraction, and maintenance occupations (8.5%); production occupations (7.5%); business and financial operations occupations (6.8%); transportation occupations (5.7%)
Most popular occupations of females: sales and office occupations (23.1%); service occupations (19.0%); arts, design, entertainment, sports, and media occupations (16.0%); healthcare practitioners and technical occupations (10.1%); management occupations (except farmers) (7.7%); education, training, and library occupations (5.7%); business and financial operations occupations (5.4%)
Limited-access highways (interstate or state) in this neighborhood: I- 94 (US Hwy 52).
Roads and streets: 42nd Ave N; 39th Ave N; 41st Ave N; Humboldt Ave N; 40th Ave N; 43rd Ave N; Webber Pkwy; Fremont Ave N; Girard Ave N; Emerson Ave N; 44th Ave N; Dupont Ave N; Colfax Ave N; Bryant Ave N; 38th Ave N (Dowling Ave N); James Ave N; Aldrich Ave N; Irving Ave N; Morgan Ave N; 45th Ave N; Lyndale Ave N; Co Rd 152 (N Mississippi Dr, Washington Ave N); Memorial Pkwy (Memorial Dr, Victory Memorial Dr); Memorial Pkwy (Victory Memorial Dr); 6th St N; Logan Ave N; Knox Ave N; N 4th St; 46th Ave N; N 3rd St.
Railroad features: Canadian Pacific Rlwy.
Other features: Shingle Crk.
Webber-Camden neighborhood detailed profile
Wenonah neighborhood in Minneapolis statistics: (Find on map)
Area: 1.226 square miles
Population: 4,866
Population density:
Median household income in 2021:
Median rent in in 2021:
Male vs Females
Median age
Housing prices:
Average estimated value of detached houses in 2021 (72.7% of all units):
Average estimated value of townhouses or other attached units in 2021 (15.0% of all units):
Average estimated '21 value of housing units in 5-or-more-unit structures (8.8% of all units):
Most popular occupations of males: computer and mathematical occupations (23.7%); sales and office occupations (17.5%); production occupations (9.3%); management occupations (except farmers) (8.3%); business and financial operations occupations (7.3%); education, training, and library occupations (7.3%); architecture and engineering occupations (4.7%)
Most popular occupations of females: sales and office occupations (23.2%); service occupations (13.4%); healthcare practitioners and technical occupations (12.1%); management occupations (except farmers) (8.1%); business and financial operations occupations (7.7%); arts, design, entertainment, sports, and media occupations (7.5%); education, training, and library occupations (7.0%)
Highways in this neighborhood: State Hwy 62 (Crosstown Hwy).
Roads and streets: E 58th St; E 56th St; E 55th St; E 57th St; Co Rd 54 (28th Ave); Woodlawn Blvd; E 62nd St; 34th Ave S; 24th Ave S; 27th Ave S; 26th Ave S; 23rd Ave S; 25th Ave S; 31st Ave S; E 60th St; Shoreview Ave; 33rd Ave S; Bossen Ter; 20th Ave S; 22nd Ave S; Standish Ave S; 19th Ave S; 21st Ave S; Longfellow Ave; E 59th St; 32nd Ave S; E 59th 1/2 St; Sander Dr; Nokomis Ave S; 30th Ave S; 29th Ave S.
Wenonah neighborhood detailed profile
Area: 1.226 square miles
Population: 4,866
Population density:
| Wenonah: | 3,969 people per square mile |
| Minneapolis: | 7,749 people per square mile |
Median household income in 2021:
| Wenonah: | $96,140 |
| Minneapolis: | $69,397 |
Median rent in in 2021:
| Wenonah: | $1,050 |
| Minneapolis: | $1,138 |
Male vs Females
| Males: | 2,454 |
| Females: | 2,412 |
Median age
| Males: | 34.4 years |
| Females: | 35.9 years |
Housing prices:
Average estimated value of detached houses in 2021 (72.7% of all units):
| Wenonah: | $290,039 |
| Minneapolis: | $398,431 |
Average estimated value of townhouses or other attached units in 2021 (15.0% of all units):
| This neighborhood: | $296,875 |
| city: | $376,360 |
Average estimated '21 value of housing units in 5-or-more-unit structures (8.8% of all units):
| Wenonah: | $63,974 |
| Minneapolis: | $317,891 |
Most popular occupations of males: computer and mathematical occupations (23.7%); sales and office occupations (17.5%); production occupations (9.3%); management occupations (except farmers) (8.3%); business and financial operations occupations (7.3%); education, training, and library occupations (7.3%); architecture and engineering occupations (4.7%)
Most popular occupations of females: sales and office occupations (23.2%); service occupations (13.4%); healthcare practitioners and technical occupations (12.1%); management occupations (except farmers) (8.1%); business and financial operations occupations (7.7%); arts, design, entertainment, sports, and media occupations (7.5%); education, training, and library occupations (7.0%)
Highways in this neighborhood: State Hwy 62 (Crosstown Hwy).
Roads and streets: E 58th St; E 56th St; E 55th St; E 57th St; Co Rd 54 (28th Ave); Woodlawn Blvd; E 62nd St; 34th Ave S; 24th Ave S; 27th Ave S; 26th Ave S; 23rd Ave S; 25th Ave S; 31st Ave S; E 60th St; Shoreview Ave; 33rd Ave S; Bossen Ter; 20th Ave S; 22nd Ave S; Standish Ave S; 19th Ave S; 21st Ave S; Longfellow Ave; E 59th St; 32nd Ave S; E 59th 1/2 St; Sander Dr; Nokomis Ave S; 30th Ave S; 29th Ave S.
Wenonah neighborhood detailed profile
West Calhoun neighborhood in Minneapolis statistics: (Find on map)
Area: 0.674 square miles
Population: 1,104
Population density:
Median household income in 2021:
Median rent in in 2021:
Male vs Females
Median age
Housing prices:
Average estimated value of detached houses in 2021 (17.1% of all units):
Average estimated value of townhouses or other attached units in 2021 (1.2% of all units):
Average estimated value of housing units in 2-unit structures in 2021 (4.7% of all units):
Average estimated '21 value of housing units in 5-or-more-unit structures (56.5% of all units):
Most popular occupations of males: business and financial operations occupations (18.5%); sales and office occupations (18.3%); healthcare practitioners and technical occupations (17.5%); material moving occupations (13.4%); management occupations (except farmers) (12.0%); computer and mathematical occupations (10.7%); architecture and engineering occupations (6.2%)
Most popular occupations of females: sales and office occupations (28.5%); business and financial operations occupations (20.8%); healthcare practitioners and technical occupations (10.4%); management occupations (except farmers) (10.3%); service occupations (6.6%); life, physical, and social science occupations (5.7%); education, training, and library occupations (5.5%)
Roads and streets: W 32nd St; W Calhoun Pkwy; Excelsior Blvd; Zenith Ave S; S Chowen Ave; Ivy Ln; W Calhoun Pkwy (Calhoun Blvd); W Calhoun Blvd; W 31st St; Ewing Ave S; W 34th 1/2 St; Abbott Ave S; List Pl; Rose Ln; Lakeshore Dr; Calhoun Pkwy W; Market Plz.
Railroad features: Twin Cities & Western RR.
West Calhoun neighborhood detailed profile
Area: 0.674 square miles
Population: 1,104
Population density:
| West Calhoun: | 1,637 people per square mile |
| Minneapolis: | 7,749 people per square mile |
Median household income in 2021:
| West Calhoun: | $153,973 |
| Minneapolis: | $69,397 |
Median rent in in 2021:
| West Calhoun: | $1,566 |
| Minneapolis: | $1,138 |
Male vs Females
| Males: | 529 |
| Females: | 575 |
Median age
| Males: | 36.1 years |
| Females: | 38.2 years |
Housing prices:
Average estimated value of detached houses in 2021 (17.1% of all units):
| West Calhoun: | $942,478 |
| Minneapolis: | $398,431 |
Average estimated value of townhouses or other attached units in 2021 (1.2% of all units):
| This neighborhood: | $75,349 |
| city: | $376,360 |
Average estimated value of housing units in 2-unit structures in 2021 (4.7% of all units):
| This neighborhood: | $424,107 |
| Minneapolis: | $353,466 |
Average estimated '21 value of housing units in 5-or-more-unit structures (56.5% of all units):
| West Calhoun: | $281,331 |
| Minneapolis: | $317,891 |
Most popular occupations of males: business and financial operations occupations (18.5%); sales and office occupations (18.3%); healthcare practitioners and technical occupations (17.5%); material moving occupations (13.4%); management occupations (except farmers) (12.0%); computer and mathematical occupations (10.7%); architecture and engineering occupations (6.2%)
Most popular occupations of females: sales and office occupations (28.5%); business and financial operations occupations (20.8%); healthcare practitioners and technical occupations (10.4%); management occupations (except farmers) (10.3%); service occupations (6.6%); life, physical, and social science occupations (5.7%); education, training, and library occupations (5.5%)
Roads and streets: W 32nd St; W Calhoun Pkwy; Excelsior Blvd; Zenith Ave S; S Chowen Ave; Ivy Ln; W Calhoun Pkwy (Calhoun Blvd); W Calhoun Blvd; W 31st St; Ewing Ave S; W 34th 1/2 St; Abbott Ave S; List Pl; Rose Ln; Lakeshore Dr; Calhoun Pkwy W; Market Plz.
Railroad features: Twin Cities & Western RR.
West Calhoun neighborhood detailed profile
Whittier neighborhood in Minneapolis statistics: (Find on map)
Area: 0.816 square miles
Population: 12,358
Population density:
Median household income in 2021:
Median rent in in 2021:
Male vs Females
Median age
Housing prices:
Average estimated value of detached houses in 2021 (10.0% of all units):
Average estimated value of housing units in 2-unit structures in 2021 (7.1% of all units):
Average estimated '21 value of housing units in 3-to-4-unit structures (11.0% of all units):
Average estimated '21 value of housing units in 5-or-more-unit structures (17.9% of all units):
Most popular occupations of males: service occupations (18.4%); sales and office occupations (13.4%); management occupations (except farmers) (11.7%); computer and mathematical occupations (8.0%); transportation occupations (6.4%); business and financial operations occupations (6.0%); education, training, and library occupations (5.4%)
Most popular occupations of females: sales and office occupations (21.7%); service occupations (19.2%); education, training, and library occupations (11.0%); business and financial operations occupations (9.0%); management occupations (except farmers) (8.1%); production occupations (5.7%); arts, design, entertainment, sports, and media occupations (4.7%)
Limited-access highways (interstate or state) in this neighborhood: State Hwy 65 (I- 35).
Roads and streets: Blaisdell Ave S; Pillsbury Ave S; Pleasant Ave S; 1st Ave S; Stevens Ave S; Garfield Ave; Grand Ave; Nicollet Ave (Co Rd 52); W 22nd St; W 28th St; W 25th St; W 26th St; W 27th St; W 24th St; 3rd Ave S; W Lake St; E 24th St; E 22nd St; E 26th St; Clinton Ave S; Harriet Ave S; E 27th St; Harriet Ave; W 29th St; E 25th St; E 28th St; 2nd Ave S; 4th Ave S; Cecil Newman Ln; E Lake St; Elroy St; E 29th St.
Whittier neighborhood detailed profile
Area: 0.816 square miles
Population: 12,358
Population density:
| Whittier: | 15,136 people per square mile |
| Minneapolis: | 7,749 people per square mile |
Median household income in 2021:
| Whittier: | $52,465 |
| Minneapolis: | $69,397 |
Median rent in in 2021:
| Whittier: | $996 |
| Minneapolis: | $1,138 |
Male vs Females
| Males: | 6,509 |
| Females: | 5,849 |
Median age
| Males: | 30.7 years |
| Females: | 29.0 years |
Housing prices:
Average estimated value of detached houses in 2021 (10.0% of all units):
| Whittier: | $340,045 |
| Minneapolis: | $398,431 |
Average estimated value of housing units in 2-unit structures in 2021 (7.1% of all units):
| This neighborhood: | $739,425 |
| Minneapolis: | $353,466 |
Average estimated '21 value of housing units in 3-to-4-unit structures (11.0% of all units):
| Whittier: | $250,315 |
| city: | $335,939 |
Average estimated '21 value of housing units in 5-or-more-unit structures (17.9% of all units):
| Whittier: | $92,125 |
| Minneapolis: | $317,891 |
Most popular occupations of males: service occupations (18.4%); sales and office occupations (13.4%); management occupations (except farmers) (11.7%); computer and mathematical occupations (8.0%); transportation occupations (6.4%); business and financial operations occupations (6.0%); education, training, and library occupations (5.4%)
Most popular occupations of females: sales and office occupations (21.7%); service occupations (19.2%); education, training, and library occupations (11.0%); business and financial operations occupations (9.0%); management occupations (except farmers) (8.1%); production occupations (5.7%); arts, design, entertainment, sports, and media occupations (4.7%)
Limited-access highways (interstate or state) in this neighborhood: State Hwy 65 (I- 35).
Roads and streets: Blaisdell Ave S; Pillsbury Ave S; Pleasant Ave S; 1st Ave S; Stevens Ave S; Garfield Ave; Grand Ave; Nicollet Ave (Co Rd 52); W 22nd St; W 28th St; W 25th St; W 26th St; W 27th St; W 24th St; 3rd Ave S; W Lake St; E 24th St; E 22nd St; E 26th St; Clinton Ave S; Harriet Ave S; E 27th St; Harriet Ave; W 29th St; E 25th St; E 28th St; 2nd Ave S; 4th Ave S; Cecil Newman Ln; E Lake St; Elroy St; E 29th St.
Whittier neighborhood detailed profile
Willard-Hay neighborhood in Minneapolis statistics: (Find on map)
Area: 1.068 square miles
Population: 10,102
Population density:
Median household income in 2021:
Median rent in in 2021:
Male vs Females
Median age
Housing prices:
Average estimated value of detached houses in 2021 (70.3% of all units):
Average estimated value of townhouses or other attached units in 2021 (2.5% of all units):
Most popular occupations of males: service occupations (24.1%); management occupations (except farmers) (10.8%); sales and office occupations (10.0%); material moving occupations (8.2%); construction, extraction, and maintenance occupations (7.2%); production occupations (7.1%); education, training, and library occupations (5.6%)
Most popular occupations of females: service occupations (31.2%); sales and office occupations (17.2%); education, training, and library occupations (10.0%); management occupations (except farmers) (8.7%); healthcare practitioners and technical occupations (8.4%); material moving occupations (6.6%); production occupations (6.1%)
Highways in this neighborhood: Olson Memorial Hwy (State Hwy 55).
Roads and streets: Vincent Ave N; Upton Ave N; Thomas Ave N; Sheridan Ave N; Russell Ave N; Penn Ave N (Co Rd 2); Golden Valley Rd; Queen Ave N; 16th Ave N; Washburn Ave N; 14th Ave N; 17th Ave N; Co Rd 81 (W Broadway Ave); 21st Ave N; Plymouth Ave N; Oliver Ave N; 23rd Ave N; McNair Ave N; 12th Ave N; 8th Ave N; Oak Park Ave N; Newton Ave N; N Theodore Wirth Pkwy; Morgan Ave N; 15th Ave N; 24th Ave N; Farwell Ave; Logan Ave N; 26th Ave N; 18th Ave N; Knox Ave N; James Ave N; Ferrant Pl; 27th Ave N; 29th Ave N; Olson Hwy Svc Rd; Irving Ave N; Farwell Pl; Walton Pl; N Knox Ave N; State Hwy 55 Svc Rd.
Railroad features: Union Pacific RR (Burlington Northern Santa Fe Rlwy).
Willard-Hay neighborhood detailed profile
Area: 1.068 square miles
Population: 10,102
Population density:
| Willard-Hay: | 9,462 people per square mile |
| Minneapolis: | 7,749 people per square mile |
Median household income in 2021:
| Willard-Hay: | $56,685 |
| Minneapolis: | $69,397 |
Median rent in in 2021:
| Willard-Hay: | $891 |
| Minneapolis: | $1,138 |
Male vs Females
| Males: | 5,026 |
| Females: | 5,075 |
Median age
| Males: | 31.1 years |
| Females: | 30.6 years |
Housing prices:
Average estimated value of detached houses in 2021 (70.3% of all units):
| Willard-Hay: | $220,246 |
| Minneapolis: | $398,431 |
Average estimated value of townhouses or other attached units in 2021 (2.5% of all units):
| This neighborhood: | $216,275 |
| city: | $376,360 |
Most popular occupations of males: service occupations (24.1%); management occupations (except farmers) (10.8%); sales and office occupations (10.0%); material moving occupations (8.2%); construction, extraction, and maintenance occupations (7.2%); production occupations (7.1%); education, training, and library occupations (5.6%)
Most popular occupations of females: service occupations (31.2%); sales and office occupations (17.2%); education, training, and library occupations (10.0%); management occupations (except farmers) (8.7%); healthcare practitioners and technical occupations (8.4%); material moving occupations (6.6%); production occupations (6.1%)
Highways in this neighborhood: Olson Memorial Hwy (State Hwy 55).
Roads and streets: Vincent Ave N; Upton Ave N; Thomas Ave N; Sheridan Ave N; Russell Ave N; Penn Ave N (Co Rd 2); Golden Valley Rd; Queen Ave N; 16th Ave N; Washburn Ave N; 14th Ave N; 17th Ave N; Co Rd 81 (W Broadway Ave); 21st Ave N; Plymouth Ave N; Oliver Ave N; 23rd Ave N; McNair Ave N; 12th Ave N; 8th Ave N; Oak Park Ave N; Newton Ave N; N Theodore Wirth Pkwy; Morgan Ave N; 15th Ave N; 24th Ave N; Farwell Ave; Logan Ave N; 26th Ave N; 18th Ave N; Knox Ave N; James Ave N; Ferrant Pl; 27th Ave N; 29th Ave N; Olson Hwy Svc Rd; Irving Ave N; Farwell Pl; Walton Pl; N Knox Ave N; State Hwy 55 Svc Rd.
Railroad features: Union Pacific RR (Burlington Northern Santa Fe Rlwy).
Willard-Hay neighborhood detailed profile
Windom neighborhood in Minneapolis statistics: (Find on map)
Area: 0.749 square miles
Population: 8,721
Population density:
Median household income in 2021:
Median rent in in 2021:
Male vs Females
Median age
Average estimated value of detached houses in 2021 (92.2% of all units):
Most popular occupations of males: sales and office occupations (18.9%); management occupations (except farmers) (15.0%); healthcare practitioners and technical occupations (13.6%); business and financial operations occupations (10.0%); production occupations (9.9%); service occupations (8.2%); computer and mathematical occupations (6.5%)
Most popular occupations of females: sales and office occupations (18.4%); management occupations (except farmers) (15.3%); business and financial operations occupations (12.9%); healthcare practitioners and technical occupations (11.4%); service occupations (10.9%); education, training, and library occupations (7.3%); arts, design, entertainment, sports, and media occupations (5.1%)
Limited-access highways (interstate or state) in this neighborhood: State Hwy 65 (Crosstown Hwy, I- 35, State Hwy 62).
Roads and streets: W 61st St; Nicollet Ave (Co Rd 52); W 59th St; Pleasant Ave S; Pillsbury Ave S; W 57th St; W 58th St; Blaisdell Ave S; Wentworth Ave S; Harriet Ave S; W 60th St; 1st Ave S; W 56th St; Lyndale Ave S; Grand Ave S; Garfield Ave S; W 62nd St; Stevens Ave S; W Diamond Lake Rd; W 55th St; W 59th 1/2 St; E 60th St; Colfax Ln S; E 56th St; E 58th St; E 57th St; E 61st St; Aldrich Ave S; Dupont Ave S; E 59th St; Wentworth Ct W; E 62nd St; E Diamond Lake Rd; Wentworth Ct E.
Railroad features: Canadian Pacific Rlwy.
Windom neighborhood detailed profile
Area: 0.749 square miles
Population: 8,721
Population density:
| Windom: | 11,636 people per square mile |
| Minneapolis: | 7,749 people per square mile |
Median household income in 2021:
| Windom: | $120,319 |
| Minneapolis: | $69,397 |
Median rent in in 2021:
| Windom: | $1,109 |
| Minneapolis: | $1,138 |
Male vs Females
| Males: | 4,588 |
| Females: | 4,132 |
Median age
| Males: | 36.1 years |
| Females: | 35.1 years |
Average estimated value of detached houses in 2021 (92.2% of all units):
| Windom: | $315,180 |
| Minneapolis: | $398,431 |
Most popular occupations of males: sales and office occupations (18.9%); management occupations (except farmers) (15.0%); healthcare practitioners and technical occupations (13.6%); business and financial operations occupations (10.0%); production occupations (9.9%); service occupations (8.2%); computer and mathematical occupations (6.5%)
Most popular occupations of females: sales and office occupations (18.4%); management occupations (except farmers) (15.3%); business and financial operations occupations (12.9%); healthcare practitioners and technical occupations (11.4%); service occupations (10.9%); education, training, and library occupations (7.3%); arts, design, entertainment, sports, and media occupations (5.1%)
Limited-access highways (interstate or state) in this neighborhood: State Hwy 65 (Crosstown Hwy, I- 35, State Hwy 62).
Roads and streets: W 61st St; Nicollet Ave (Co Rd 52); W 59th St; Pleasant Ave S; Pillsbury Ave S; W 57th St; W 58th St; Blaisdell Ave S; Wentworth Ave S; Harriet Ave S; W 60th St; 1st Ave S; W 56th St; Lyndale Ave S; Grand Ave S; Garfield Ave S; W 62nd St; Stevens Ave S; W Diamond Lake Rd; W 55th St; W 59th 1/2 St; E 60th St; Colfax Ln S; E 56th St; E 58th St; E 57th St; E 61st St; Aldrich Ave S; Dupont Ave S; E 59th St; Wentworth Ct W; E 62nd St; E Diamond Lake Rd; Wentworth Ct E.
Railroad features: Canadian Pacific Rlwy.
Windom neighborhood detailed profile
Windom Park neighborhood in Minneapolis statistics: (Find on map)
Area: 0.594 square miles
Population: 6,609
Population density:
Median household income in 2021:
Median rent in in 2021:
Male vs Females
Median age
Housing prices:
Average estimated value of detached houses in 2021 (39.1% of all units):
Average estimated value of townhouses or other attached units in 2021 (7.3% of all units):
Average estimated value of housing units in 2-unit structures in 2021 (19.5% of all units):
Average estimated '21 value of housing units in 5-or-more-unit structures (33.2% of all units):
Most popular occupations of males: management occupations (except farmers) (17.7%); sales and office occupations (13.7%); service occupations (11.1%); community and social services occupations (8.4%); architecture and engineering occupations (7.1%); construction, extraction, and maintenance occupations (6.4%); computer and mathematical occupations (6.0%)
Most popular occupations of females: service occupations (20.3%); management occupations (except farmers) (19.2%); sales and office occupations (16.2%); healthcare practitioners and technical occupations (9.7%); business and financial operations occupations (9.1%); education, training, and library occupations (8.0%); arts, design, entertainment, sports, and media occupations (3.7%)
Roads and streets: 23rd Ave NE; 22nd Ave NE; 19th Ave NE; 18th Ave NE; Co Rd 27 (Stinson Blvd); Polk St NE; Taylor St NE; Fillmore St NE; Benjamin St NE (NE Benjamin St); NE Cleveland St; NE Garfield St; NE Arthur St; Hayes St NE; Johnson St NE; NE Ulysses St; Buchanan St NE; Pierce St NE; NE Lincoln St; Coolidge St NE; McKinley St NE; 24th Ave NE; 18th 1/2 Ave NE; 20th Ave NE; NE Wilson St; New Brighton Svc Rd; NE Taft St; NE Roosevelt St; Walden Pl NE.
Windom Park neighborhood detailed profile
Area: 0.594 square miles
Population: 6,609
Population density:
| Windom Park: | 11,123 people per square mile |
| Minneapolis: | 7,749 people per square mile |
Median household income in 2021:
| Windom Park: | $85,198 |
| Minneapolis: | $69,397 |
Median rent in in 2021:
| Windom Park: | $886 |
| Minneapolis: | $1,138 |
Male vs Females
| Males: | 3,464 |
| Females: | 3,145 |
Median age
| Males: | 36.4 years |
| Females: | 37.4 years |
Housing prices:
Average estimated value of detached houses in 2021 (39.1% of all units):
| Windom Park: | $278,372 |
| Minneapolis: | $398,431 |
Average estimated value of townhouses or other attached units in 2021 (7.3% of all units):
| This neighborhood: | $234,844 |
| city: | $376,360 |
Average estimated value of housing units in 2-unit structures in 2021 (19.5% of all units):
| This neighborhood: | $276,528 |
| Minneapolis: | $353,466 |
Average estimated '21 value of housing units in 5-or-more-unit structures (33.2% of all units):
| Windom Park: | $292,857 |
| Minneapolis: | $317,891 |
Most popular occupations of males: management occupations (except farmers) (17.7%); sales and office occupations (13.7%); service occupations (11.1%); community and social services occupations (8.4%); architecture and engineering occupations (7.1%); construction, extraction, and maintenance occupations (6.4%); computer and mathematical occupations (6.0%)
Most popular occupations of females: service occupations (20.3%); management occupations (except farmers) (19.2%); sales and office occupations (16.2%); healthcare practitioners and technical occupations (9.7%); business and financial operations occupations (9.1%); education, training, and library occupations (8.0%); arts, design, entertainment, sports, and media occupations (3.7%)
Roads and streets: 23rd Ave NE; 22nd Ave NE; 19th Ave NE; 18th Ave NE; Co Rd 27 (Stinson Blvd); Polk St NE; Taylor St NE; Fillmore St NE; Benjamin St NE (NE Benjamin St); NE Cleveland St; NE Garfield St; NE Arthur St; Hayes St NE; Johnson St NE; NE Ulysses St; Buchanan St NE; Pierce St NE; NE Lincoln St; Coolidge St NE; McKinley St NE; 24th Ave NE; 18th 1/2 Ave NE; 20th Ave NE; NE Wilson St; New Brighton Svc Rd; NE Taft St; NE Roosevelt St; Walden Pl NE.
Windom Park neighborhood detailed profile