Stevens Square neighborhood in Minneapolis, Minnesota (MN), 55403, 55404 detailed profile
Settings
X

Business Search - 14 Million verified businesses
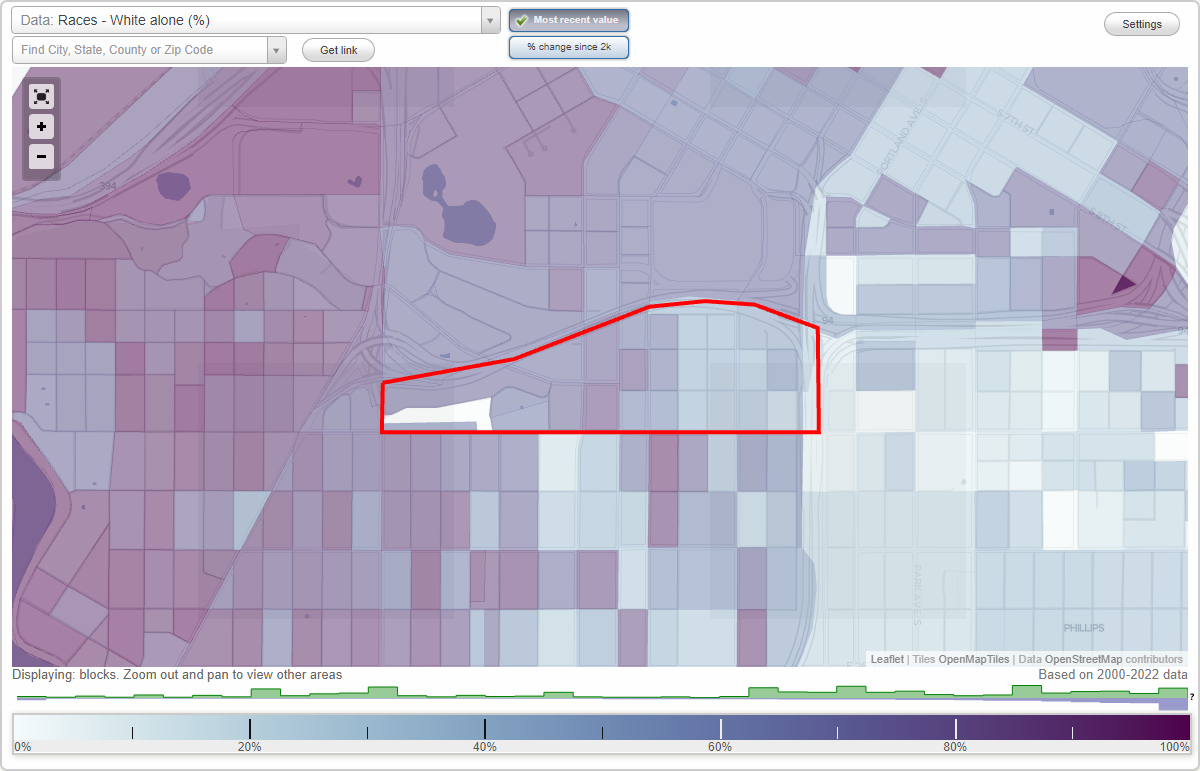
Area: 0.187 square miles
Population: 2,498
Population density:
| Stevens Square: | 13,351 people per square mile |
| Minneapolis: | 7,744 people per square mile |

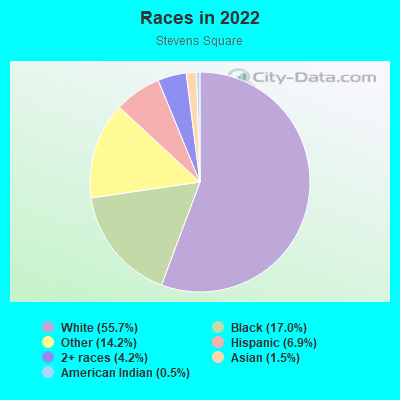
- 1,53555.7%White
- 46717.0%Black
- 39014.2%Some other race
- 1916.9%Hispanic or Latino
- 1154.2%Two or more races
- 421.5%Asian
- 140.5%American Indian
Median household income in 2022:
| Stevens Square: | $45,383 |
| Minneapolis: | $74,473 |
Distribution of median household income
![Distribution of median household income]()
- 81Less than $10,000
- 433$10,000 to $19,999
- 288$20,000 to $29,999
- 299$30,000 to $39,999
- 151$40,000 to $49,999
- 206$50,000 to $59,999
- 175$60,000 to $74,999
- 150$75,000 to $99,999
- 169$100,000 to $124,999
- 101$125,000 to $149,999
- 111$150,000 to $199,999
- 102$200,000 or more

Distribution of owner-occupied house/condo value
![Distribution of owner-occupied house/condo value]()
- 83Less than $50,000
- 228$50,000 to $99,999
- 93$100,000 to $149,999
- 213$150,000 to $199,999
- 287$200,000 to $249,999
- 61$250,000 to $299,999
- 206$300,000 to $399,999
- 97$400,000 to $499,999
- 59$500,000 to $749,999
- 84$750,000 to $999,999
- 12$1,000,000 or more

Distribution of rent paid by renters
![Distribution of rent paid by renters]()
- 50$100 to $199
- 406$200 to $299
- 364$300 to $399
- 154$400 to $499
- 91$500 to $599
- 127$600 to $699
- 171$700 to $799
- 171$800 to $899
- 257$900 to $999
- 213$1,000 to $1,249
- 190$1,250 to $1,499
- 73$1,500 to $1,999
- 165$2,000 or more

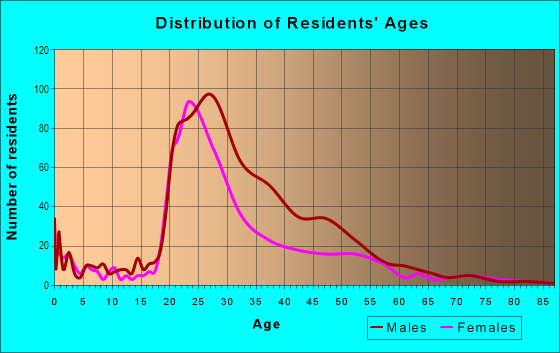
| Males: | 1,615 |
| Females: | 882 |
Males:
| This neighborhood: | 34.8 years |
| Whole city: | 33.3 years |
| This neighborhood: | 31.4 years |
| Whole city: | 33.2 years |
Average household size:
| Stevens Square: | 1.5 people |
| Minneapolis: | 2.1 people |
Percentage of family households:
| Stevens Square: | 7.5% |
| Minneapolis: | 34.1% |
| Here: | 7.8% |
| Minneapolis: | 29.8% |
Percentage of married-couple families with children (among all households):
| Stevens Square: | 58.1% |
| Minneapolis: | 31.8% |
Percentage of single-mother households (among all households):
| Stevens Square: | 94.6% |
| Minneapolis: | 10.5% |
Percentage of never married males 15 years old and over:
Percentage of never married females 15 years old and over:
| Stevens Square: | 48.4% |
| Minneapolis: | 27.0% |
Percentage of never married females 15 years old and over:
| Stevens Square: | 24.5% |
| city: | 25.4% |
Percentage of people that speak English not well or not at all:
| Stevens Square: | 3.3% |
| Minneapolis: | 3.8% |
Percentage of people born in this state:
Percentage of people born in another U.S. state:
Percentage of native residents but born outside the U.S.:
Percentage of foreign born residents:
| Here: | 48.4% |
| Minneapolis: | 51.9% |
Percentage of people born in another U.S. state:
| Stevens Square: | 34.8% |
| Minneapolis: | 31.8% |
Percentage of native residents but born outside the U.S.:
| Here: | 3.7% |
| city: | 1.5% |
Percentage of foreign born residents:
| Here: | 13.0% |
| Minneapolis: | 14.7% |
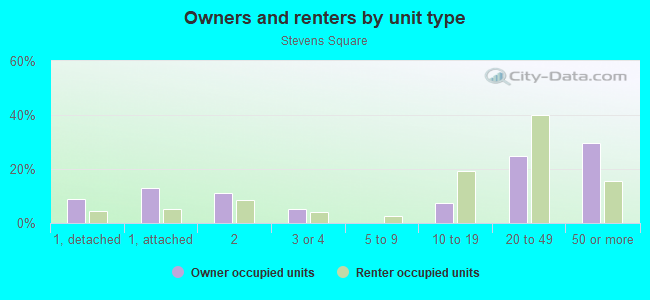
Owner-occupied
Renter-occupied

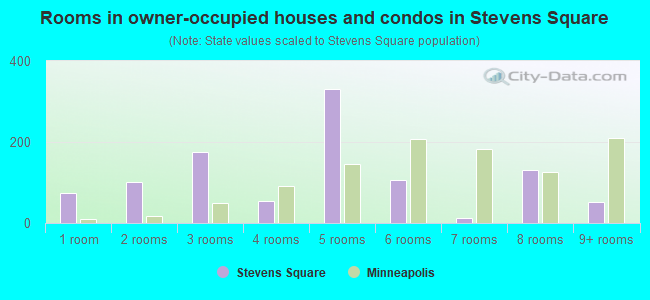
- Rooms in owner-occupied houses and condos in Stevens Square
- 741 room
- 1022 rooms
- 1753 rooms
- 544 rooms
- 3305 rooms
- 1066 rooms
- 127 rooms
- 1328 rooms
- 529+ rooms
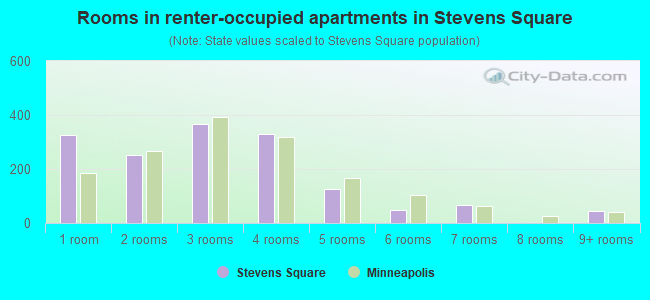
- Rooms in renter-occupied apartments in Stevens Square
- 3251 room
- 2512 rooms
- 3663 rooms
- 3294 rooms
- 1255 rooms
- 506 rooms
- 687 rooms
- 08 rooms
- 439+ rooms
Owner-occupied
Renter-occupied
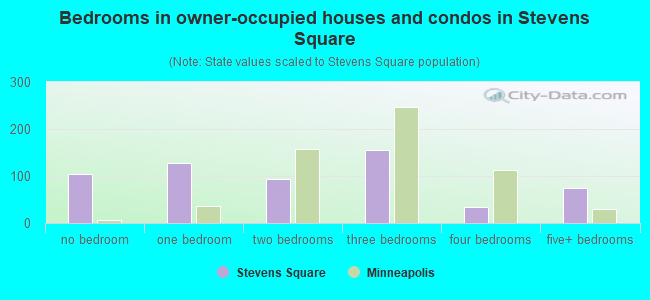
- Bedrooms in owner-occupied houses and condos in Stevens Square
- 105no bedroom
- 1281 bedroom
- 932 bedrooms
- 1563 bedrooms
- 334 bedrooms
- 745+ bedrooms
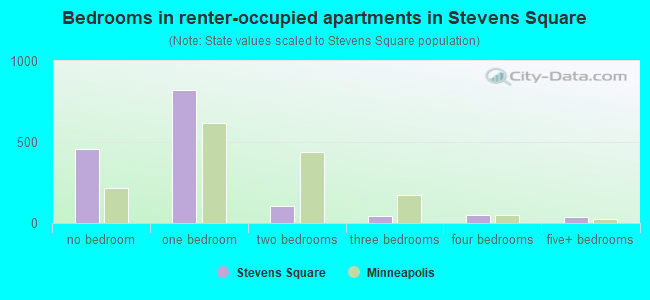
- Bedrooms in renter-occupied apartments in Stevens Square
- 458no bedroom
- 8221 bedroom
- 1042 bedrooms
- 453 bedrooms
- 514 bedrooms
- 365+ bedrooms
Average number of cars or other vehicles available in houses/condos:
Average number of cars or other vehicles available in apartments:
| This neighborhood: | |
| Minneapolis: |
Average number of cars or other vehicles available in apartments:
| Here: | 0.6 |
| city: | 1.1 |
Percentage of units with a mortgage:
| Stevens Square: | 71.6% |
| Minneapolis: | 71.8% |
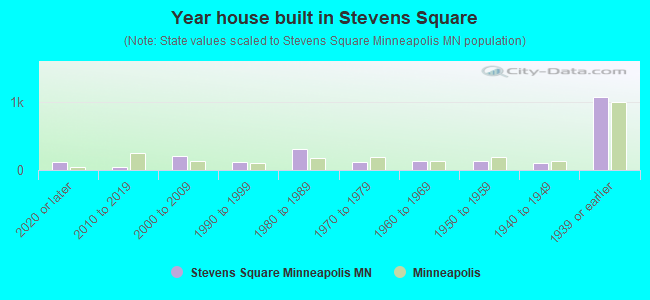
- Year house built in Stevens Square
- 1122020 or later
- 472010 to 2019
- 2052000 to 2009
- 1141990 to 1999
- 3141980 to 1989
- 1231970 to 1979
- 1261960 to 1969
- 1381950 to 1959
- 1021940 to 1949
- 1,0731939 or earlier
City-data.com crime index for city in 2020 (higher means more crime):
| City: | 600.2 |
| U.S. average: | 219.5 |
Travel time to work (commute)
![Travel time to work (commute)]()
- 19Less than 5 minutes
- 2895 to 9 minutes
- 24210 to 14 minutes
- 33515 to 19 minutes
- 33820 to 24 minutes
- 7725 to 29 minutes
- 23130 to 34 minutes
- 6735 to 39 minutes
- 2740 to 44 minutes
- 3645 to 59 minutes
- 13460 to 89 minutes
- 1690 or more minutes

Means of transportation to work
![Means of transportation to work]()
- 38.2%669Drove a car alone
- 9.3%163Carpooled
- 13.3%233Bus
- 0.9%16Subway or elevated rail
- 2.6%46Light rail, streetcar or trolley
- 4.2%73Bicycle
- 14.5%254Walked
- 19.1%335Other means
- 13.3%233Worked at home

Time leaving home to go to work
![Time leaving home to go to work]()
- 6612:00 a.m. to 4:59 a.m.
- 225:00 a.m. to 5:29 a.m.
- 185:30 a.m. to 5:59 a.m.
- 1206:00 a.m. to 6:29 a.m.
- 656:30 a.m. to 6:59 a.m.
- 3007:00 a.m. to 7:29 a.m.
- 2397:30 a.m. to 7:59 a.m.
- 2348:00 a.m. to 8:29 a.m.
- 1308:30 a.m. to 8:59 a.m.
- 939:00 a.m. to 9:59 a.m.
- 15810:00 a.m. to 10:59 a.m.
- 5711:00 a.m. to 11:59 a.m.
- 22912:00 p.m. to 3:59 p.m.
- 1394:00 p.m. to 11:59 p.m.

Occupations of males:
- Percentage of males in management occupations (except farmers):
Here: 13.9% city: 12.1%
- Percentage of males in business and financial operations occupations:
Here: 5.3% city: 9.1%
- Percentage of males in computer and mathematical occupations:
Here: 5.9% city: 8.4%
- Percentage of males in architecture and engineering occupations:
Here: 2.9% city: 4.6%
- Percentage of males in life, physical, and social science occupations:
Here: 1.4% city: 2.0%
- Percentage of males in community and social services occupations:
Here: 1.6% city: 1.8%
- Percentage of males in education, training, and library occupations:
Here: 3.4% city: 5.2%
- Percentage of males in arts, design, entertainment, sports, and media occupations:
Here: 1.6% city: 4.0%
- Percentage of males in healthcare practitioners and technical occupations:
Here: 9.1% city: 3.6%
- Percentage of males in service occupations:
Here: 16.7% city: 12.6%
- Percentage of males in sales and office occupations:
Here: 16.8% city: 15.3%
- Percentage of males in construction, extraction, and maintenance occupations:
Here: 3.4% city: 3.3%
- Percentage of males in production occupations:
Here: 12.8% city: 5.8%
- Percentage of males in transportation occupations:
Here: 3.7% city: 4.1%
- Percentage of males in material moving occupations:
Here: 1.5% city: 3.6%
Occupations of females:
- Percentage of females in management occupations (except farmers):
Here: 22.1% city: 11.4%
- Percentage of females in business and financial operations occupations:
Here: 12.0% city: 9.8%
- Percentage of females in architecture and engineering occupations:
Here: 2.2% city: 1.2%
- Percentage of females in life, physical, and social science occupations:
Here: 2.3% city: 2.3%
- Percentage of females in community and social services occupations:
Here: 7.7% city: 3.8%
- Percentage of females in legal occupations:
Here: 2.5% city: 2.3%
- Percentage of females in education, training, and library occupations:
Here: 8.0% city: 10.6%
- Percentage of females in healthcare practitioners and technical occupations:
Here: 2.3% city: 8.3%
- Percentage of females in service occupations:
Here: 16.2% city: 17.8%
- Percentage of females in sales and office occupations:
Here: 19.2% city: 18.7%
- Percentage of females in construction, extraction, and maintenance occupations:
Here: 2.8% city: 0.2%
- Percentage of females in transportation occupations:
Here: 4.8% city: 0.9%
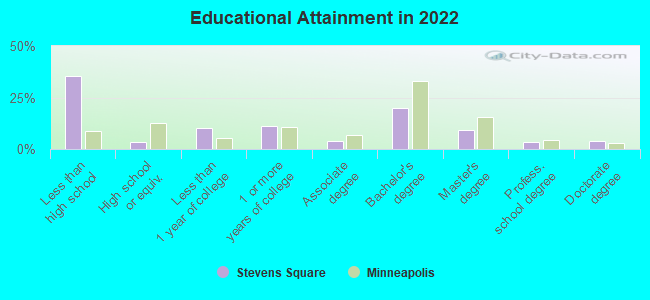
Education in this neighborhood (subdivision or community):
- Percentage of people 3 years and older in K-12 schools:
Stevens Square: 21.3% Minneapolis: 14.0%
- Percentage of people 3 years and older in undergraduate colleges:
Stevens Square: 8.6% Minneapolis: 8.6%
- Percentage of people 3 years and older in grad. or professional schools:
Stevens Square: 5.8% Minneapolis: 2.9%
- Percentage of students K-12 enrolled in private schools:
Stevens Square: 27.7% Minneapolis: 14.1%
Percentage of population below poverty level:
| Stevens Square: | 17.6% |
| Minneapolis: | 17.2% |
Median year renter moved in (as recorded in 2022):
| Stevens Square: | 2016 |
| Minneapolis: | 2021 |
Percentage of married-couple families with both working:
| Stevens Square: | 176.0% |
| Minneapolis: | 73.9% |
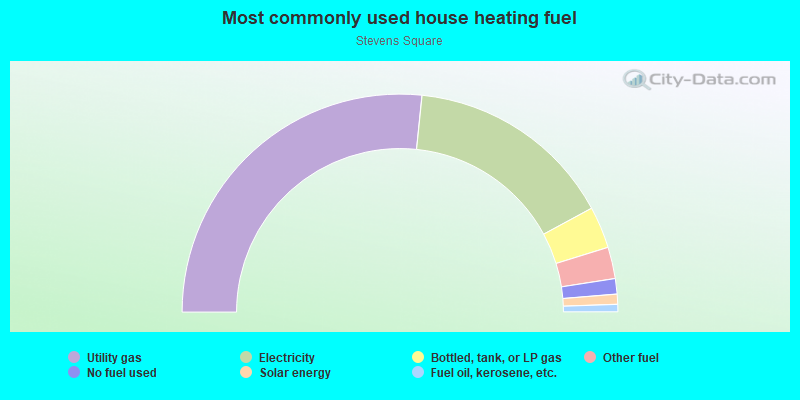
- 53.3%Utility gas
- 31.0%Electricity
- 6.2%Bottled, tank, or LP gas
- 4.7%Other fuel
- 2.3%No fuel used
- 1.5%Solar energy
- 1.1%Fuel oil, kerosene, etc.
Limited-access highways (interstate or state) in this neighborhood:
I- 35 (State Hwy 65)
Length: 0.15 miles
Direction: N-S
Direction: N-S
Roads and streets:
Co Rd 5 (W Franklin Ave)
Length: 0.62 miles
Direction: E-W
Address range: 1 to 599
Direction: E-W
Address range: 1 to 599
E 18th St
Length: 0.53 miles
Direction: E-W
Address range: 1 to 399
Direction: E-W
Address range: 1 to 399
E 19th St
Length: 0.53 miles
Direction: E-W
Address range: 1 to 499
Direction: E-W
Address range: 1 to 499
Co Rd 5 (E Franklin Ave)
Length: 0.43 miles
Direction: E-W
Address range: 1 to 349
Direction: E-W
Address range: 1 to 349
E 17th St
Length: 0.26 miles
Direction: E-W
Address range: 1 to 299
Direction: E-W
Address range: 1 to 299
1st Ave S
Length: 0.25 miles
Directions: E-W, N-S
Address range: 1700 to 1999
Directions: E-W, N-S
Address range: 1700 to 1999
2nd Ave S
Length: 0.25 miles
Direction: N-S
Address range: 1700 to 1999
Direction: N-S
Address range: 1700 to 1999
Stevens Ave S
Length: 0.25 miles
Direction: N-S
Address range: 1700 to 1999
Direction: N-S
Address range: 1700 to 1999
3rd Ave S
Length: 0.25 miles
Direction: N-S
Address range: 1700 to 1999
Direction: N-S
Address range: 1700 to 1999
Clinton Ave S
Length: 0.22 miles
Directions: N-S, SW-NE
Address range: 1700 to 1999
Directions: N-S, SW-NE
Address range: 1700 to 1999
Groveland Ave
Length: 0.20 miles
Direction: E-W
Address range: 1 to 199
Direction: E-W
Address range: 1 to 199
Ridgewood Ave
Length: 0.18 miles
Directions: E-W, SW-NE
Address range: 200 to 320
Directions: E-W, SW-NE
Address range: 200 to 320
Co Rd 52 (Nicollet Ave)
Length: 0.17 miles
Direction: N-S
Address range: 1800 to 1999
Direction: N-S
Address range: 1800 to 1999
4th Ave S
Length: 0.17 miles
Direction: N-S
Address range: 1800 to 1999
Direction: N-S
Address range: 1800 to 1999
Pillsbury Ave S
Length: 0.11 miles
Directions: N-S, SW-NE
Address range: 1920 to 1999
Directions: N-S, SW-NE
Address range: 1920 to 1999
Lasalle Ave
Length: 0.10 miles
Direction: N-S
Address range: 1900 to 1999
Direction: N-S
Address range: 1900 to 1999
Pleasant Ave
Length: 0.08 miles
Direction: N-S
Address range: 1900 to 1999
Direction: N-S
Address range: 1900 to 1999
Blaisdell Ave S
Length: 0.06 miles
Direction: N-S
Direction: N-S