Shingle Creek neighborhood in Minneapolis, Minnesota (MN), 55430 detailed profile
Settings
X


Business Search - 14 Million verified businesses
Area: 0.496 square miles
Population: 2,760
Population density:
| Shingle Creek: | 5,563 people per square mile |
| Minneapolis: | 7,744 people per square mile |

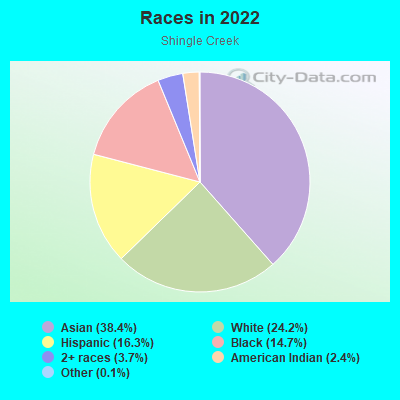
- 1,19938.4%Asian
- 75624.2%White
- 50816.3%Hispanic or Latino
- 46014.7%Black
- 1163.7%Two or more races
- 762.4%American Indian
- 40.1%Some other race
Median household income in 2022:
| Shingle Creek: | $84,057 |
| Minneapolis: | $74,473 |
Distribution of median household income
![Distribution of median household income]()
- 64Less than $10,000
- 155$10,000 to $19,999
- 76$20,000 to $29,999
- 116$30,000 to $39,999
- 113$40,000 to $49,999
- 40$50,000 to $59,999
- 188$60,000 to $74,999
- 173$75,000 to $99,999
- 156$100,000 to $124,999
- 62$125,000 to $149,999
- 43$150,000 to $199,999
- 239$200,000 or more

Distribution of owner-occupied house/condo value
![Distribution of owner-occupied house/condo value]()
- 77Less than $50,000
- 66$50,000 to $99,999
- 153$100,000 to $149,999
- 306$150,000 to $199,999
- 223$200,000 to $249,999
- 87$250,000 to $299,999
- 36$300,000 to $399,999
- 59$400,000 to $499,999
- 469$500,000 to $749,999
- 16$750,000 to $999,999

Distribution of rent paid by renters
![Distribution of rent paid by renters]()
- 10$100 to $199
- 34$300 to $399
- 36$400 to $499
- 21$500 to $599
- 42$600 to $699
- 33$700 to $799
- 120$800 to $899
- 39$900 to $999
- 27$1,000 to $1,249
- 29$1,250 to $1,499
- 44$1,500 to $1,999
- 45$2,000 or more

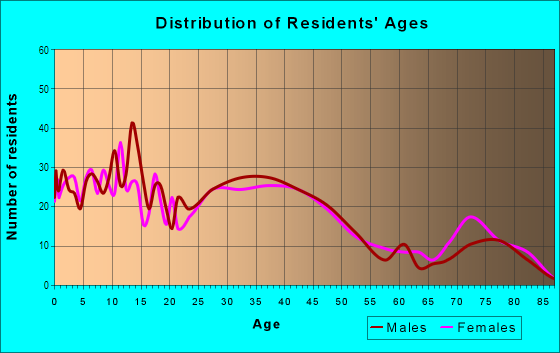
| Males: | 1,488 |
| Females: | 1,271 |
Males:
| This neighborhood: | 34.5 years |
| Whole city: | 33.3 years |
| This neighborhood: | 32.6 years |
| Whole city: | 33.2 years |
Average household size:
| Shingle Creek: | 10.1 people |
| Minneapolis: | 2.1 people |
Percentage of family households:
| Shingle Creek: | 61.3% |
| Minneapolis: | 34.1% |
| Here: | 48.6% |
| Minneapolis: | 29.8% |
Percentage of married-couple families with children (among all households):
| Shingle Creek: | 26.8% |
| Minneapolis: | 31.8% |
Percentage of single-mother households (among all households):
| Shingle Creek: | 7.8% |
| Minneapolis: | 10.5% |
Percentage of never married males 15 years old and over:
Percentage of never married females 15 years old and over:
| Shingle Creek: | 26.5% |
| Minneapolis: | 27.0% |
Percentage of never married females 15 years old and over:
| Shingle Creek: | 17.6% |
| city: | 25.4% |
Percentage of people that speak English not well or not at all:
| Shingle Creek: | 10.0% |
| Minneapolis: | 3.8% |
Percentage of people born in this state:
Percentage of people born in another U.S. state:
Percentage of native residents but born outside the U.S.:
Percentage of foreign born residents:
| Here: | 54.0% |
| Minneapolis: | 51.9% |
Percentage of people born in another U.S. state:
| Shingle Creek: | 22.5% |
| Minneapolis: | 31.8% |
Percentage of native residents but born outside the U.S.:
| Here: | 0.4% |
| city: | 1.5% |
Percentage of foreign born residents:
| Here: | 23.4% |
| Minneapolis: | 14.7% |
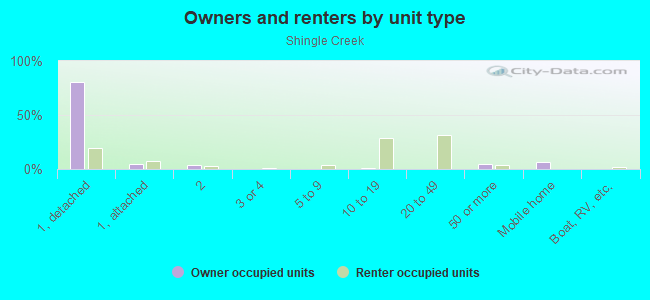
Owner-occupied
Renter-occupied

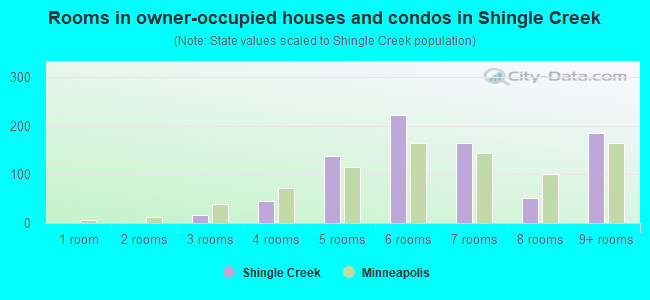
- Rooms in owner-occupied houses and condos in Shingle Creek
- 01 room
- 02 rooms
- 163 rooms
- 454 rooms
- 1375 rooms
- 2226 rooms
- 1657 rooms
- 518 rooms
- 1849+ rooms
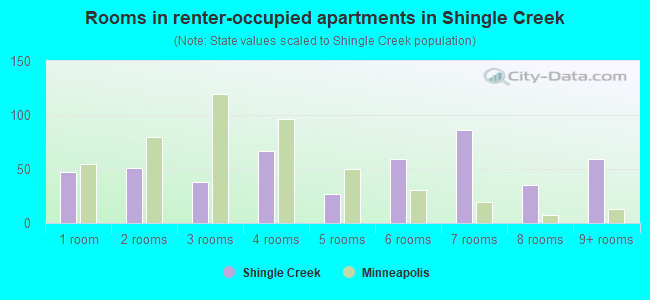
- Rooms in renter-occupied apartments in Shingle Creek
- 471 room
- 512 rooms
- 383 rooms
- 674 rooms
- 275 rooms
- 596 rooms
- 867 rooms
- 358 rooms
- 599+ rooms
Owner-occupied
Renter-occupied
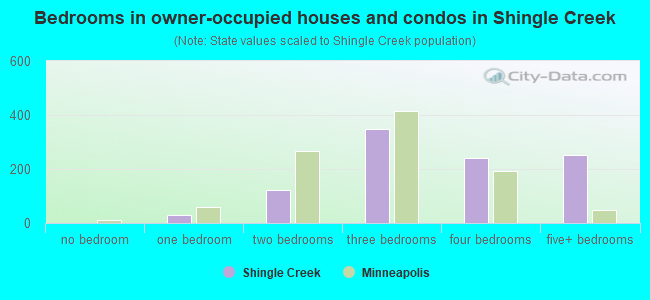
- Bedrooms in owner-occupied houses and condos in Shingle Creek
- 0no bedroom
- 311 bedroom
- 1232 bedrooms
- 3473 bedrooms
- 2414 bedrooms
- 2525+ bedrooms
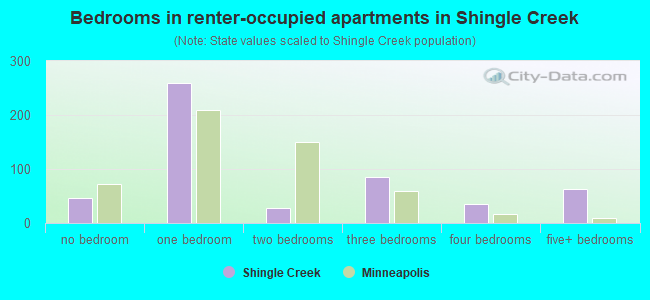
- Bedrooms in renter-occupied apartments in Shingle Creek
- 47no bedroom
- 2591 bedroom
- 272 bedrooms
- 853 bedrooms
- 364 bedrooms
- 635+ bedrooms
Average number of cars or other vehicles available in houses/condos:
Average number of cars or other vehicles available in apartments:
| This neighborhood: | 3.5 |
| Minneapolis: | 1.6 |
Average number of cars or other vehicles available in apartments:
| Here: | 3.8 |
| city: | 1.1 |
Percentage of units with a mortgage:
| Shingle Creek: | 62.3% |
| Minneapolis: | 71.8% |
Average estimated value of detached houses in 2022 (93.4% of all units):
| Shingle Creek: | $183,761 |
| Minnesota: | $374,552 |
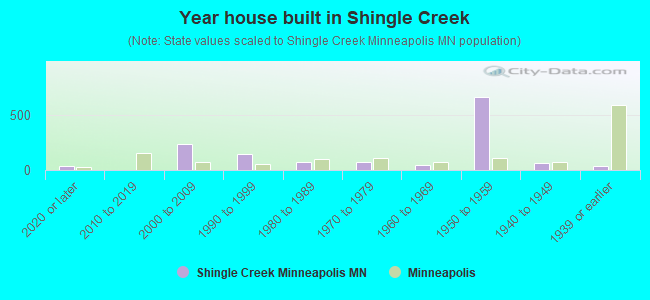
- Year house built in Shingle Creek
- 372020 or later
- 02010 to 2019
- 2392000 to 2009
- 1461990 to 1999
- 771980 to 1989
- 741970 to 1979
- 501960 to 1969
- 6611950 to 1959
- 611940 to 1949
- 351939 or earlier
City-data.com crime index for city in 2020 (higher means more crime):
| City: | 600.2 |
| U.S. average: | 219.5 |
Travel time to work (commute)
![Travel time to work (commute)]()
- 6Less than 5 minutes
- 385 to 9 minutes
- 14610 to 14 minutes
- 21715 to 19 minutes
- 17620 to 24 minutes
- 12025 to 29 minutes
- 34530 to 34 minutes
- 2335 to 39 minutes
- 1940 to 44 minutes
- 9745 to 59 minutes
- 2360 to 89 minutes
- 6090 or more minutes

Means of transportation to work
![Means of transportation to work]()
- 65.2%957Drove a car alone
- 13.7%201Carpooled
- 11.0%162Bus
- 0.1%2Taxi
- 0.7%10Bicycle
- 2.2%32Walked
- 13.7%201Other means
- 8.9%130Worked at home

Time leaving home to go to work
![Time leaving home to go to work]()
- 18112:00 a.m. to 4:59 a.m.
- 605:00 a.m. to 5:29 a.m.
- 285:30 a.m. to 5:59 a.m.
- 166:00 a.m. to 6:29 a.m.
- 2346:30 a.m. to 6:59 a.m.
- 997:00 a.m. to 7:29 a.m.
- 1417:30 a.m. to 7:59 a.m.
- 1098:00 a.m. to 8:29 a.m.
- 978:30 a.m. to 8:59 a.m.
- 379:00 a.m. to 9:59 a.m.
- 4310:00 a.m. to 10:59 a.m.
- 2711:00 a.m. to 11:59 a.m.
- 17412:00 p.m. to 3:59 p.m.
- 854:00 p.m. to 11:59 p.m.

Occupations of males:
- Percentage of males in management occupations (except farmers):
Here: 2.0% city: 12.1%
- Percentage of males in business and financial operations occupations:
Here: 7.7% city: 9.1%
- Percentage of males in computer and mathematical occupations:
Here: 6.8% city: 8.4%
- Percentage of males in community and social services occupations:
Here: 2.2% city: 1.8%
- Percentage of males in education, training, and library occupations:
Here: 2.4% city: 5.2%
- Percentage of males in healthcare practitioners and technical occupations:
Here: 12.6% city: 3.6%
- Percentage of males in service occupations:
Here: 16.7% city: 12.6%
- Percentage of males in sales and office occupations:
Here: 16.6% city: 15.3%
- Percentage of males in production occupations:
Here: 21.7% city: 5.8%
- Percentage of males in transportation occupations:
Here: 4.4% city: 4.1%
- Percentage of males in material moving occupations:
Here: 2.0% city: 3.6%
Occupations of females:
- Percentage of females in management occupations (except farmers):
Here: 11.9% city: 11.4%
- Percentage of females in business and financial operations occupations:
Here: 7.7% city: 9.8%
- Percentage of females in computer and mathematical occupations:
Here: 3.9% city: 2.6%
- Percentage of females in life, physical, and social science occupations:
Here: 10.4% city: 2.3%
- Percentage of females in community and social services occupations:
Here: 1.3% city: 3.8%
- Percentage of females in education, training, and library occupations:
Here: 9.1% city: 10.6%
- Percentage of females in arts, design, entertainment, sports, and media occupations:
Here: 2.6% city: 5.6%
- Percentage of females in healthcare practitioners and technical occupations:
Here: 6.0% city: 8.3%
- Percentage of females in service occupations:
Here: 17.9% city: 17.8%
- Percentage of females in sales and office occupations:
Here: 13.8% city: 18.7%
- Percentage of females in farming, fishing, and forestry occupations:
Here: 4.1% city: 0.1%
- Percentage of females in production occupations:
Here: 10.2% city: 2.7%
- Percentage of females in transportation occupations:
Here: 1.1% city: 0.9%
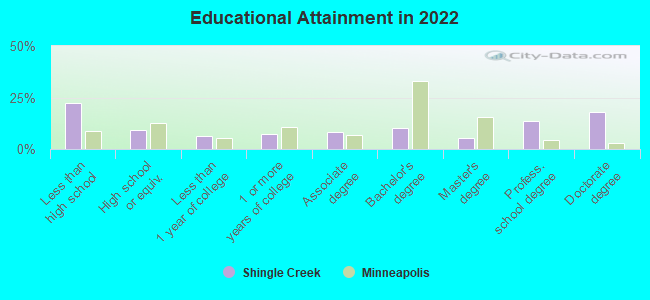
Education in this neighborhood (subdivision or community):
- Percentage of people 3 years and older in K-12 schools:
Shingle Creek: 30.1% Minneapolis: 14.0%
- Percentage of people 3 years and older in undergraduate colleges:
Shingle Creek: 12.1% Minneapolis: 8.6%
- Percentage of people 3 years and older in grad. or professional schools:
Shingle Creek: 8.8% Minneapolis: 2.9%
- Percentage of students K-12 enrolled in private schools:
Shingle Creek: 20.1% Minneapolis: 14.1%
Percentage of population below poverty level:
| Shingle Creek: | 12.3% |
| Minneapolis: | 17.2% |
Median year owner moved in (as recorded in 2022):
| Shingle Creek: | 2009 |
| Minneapolis: | 2012 |
Percentage of married-couple families with both working:
| Shingle Creek: | 128.0% |
| Minneapolis: | 73.9% |
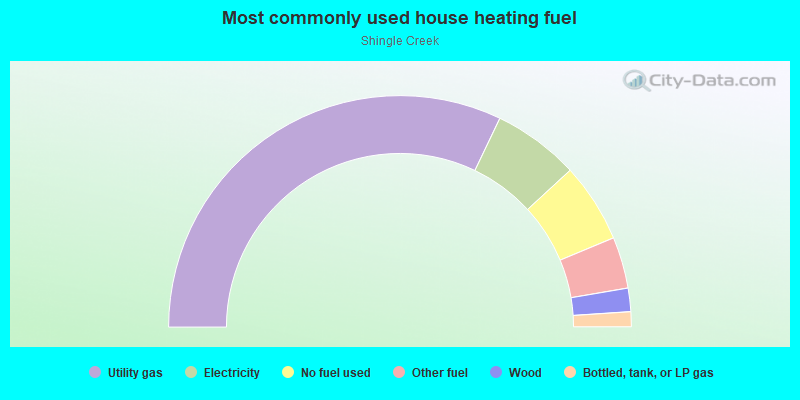
- 64.3%Utility gas
- 12.1%Electricity
- 11.1%No fuel used
- 7.2%Other fuel
- 3.3%Wood
- 2.1%Bottled, tank, or LP gas
Roads and streets:
51st Ave N
Length: 1.24 miles
Directions: E-W, SE-NW
Address range: 1501 to 2899
Directions: E-W, SE-NW
Address range: 1501 to 2899
52nd Ave N
Length: 1.15 miles
Directions: E-W, SE-NW
Address range: 1500 to 2899
Directions: E-W, SE-NW
Address range: 1500 to 2899
50th Ave N
Length: 1.14 miles
Direction: E-W
Address range: 1500 to 2899
Direction: E-W
Address range: 1500 to 2899
49th Ave N
Length: 0.88 miles
Direction: E-W
Address range: 1500 to 2899
Direction: E-W
Address range: 1500 to 2899
Queen Ave N
Length: 0.47 miles
Directions: E-W, N-S
Address range: 4906 to 5199
Directions: E-W, N-S
Address range: 4906 to 5199
Sheridan Ave N
Length: 0.43 miles
Directions: N-S, SW-NE
Address range: 4900 to 5299
Directions: N-S, SW-NE
Address range: 4900 to 5299
Russell Ave N
Length: 0.41 miles
Directions: N-S, SW-NE
Address range: 4900 to 5299
Directions: N-S, SW-NE
Address range: 4900 to 5299
Humboldt Ave N (Co Rd 57)
Length: 0.38 miles
Directions: N-S, SW-NE
Address range: 4900 to 5199
Directions: N-S, SW-NE
Address range: 4900 to 5199
Upton Ave N
Length: 0.38 miles
Directions: N-S, SW-NE
Address range: 4900 to 5199
Directions: N-S, SW-NE
Address range: 4900 to 5199
Penn Ave N
Length: 0.38 miles
Direction: N-S
Address range: 4900 to 5199
Direction: N-S
Address range: 4900 to 5199
Vincent Ave N
Length: 0.38 miles
Direction: N-S
Address range: 4900 to 5199
Direction: N-S
Address range: 4900 to 5199
Washburn Ave N
Length: 0.38 miles
Directions: N-S, SW-NE
Address range: 4900 to 5199
Directions: N-S, SW-NE
Address range: 4900 to 5199
Thomas Ave N
Length: 0.25 miles
Direction: N-S
Address range: 4900 to 5199
Direction: N-S
Address range: 4900 to 5199
Morgan Ave N
Length: 0.25 miles
Direction: N-S
Address range: 4900 to 5199
Direction: N-S
Address range: 4900 to 5199
Knox Ave N
Length: 0.25 miles
Direction: N-S
Address range: 4900 to 5199
Direction: N-S
Address range: 4900 to 5199
Logan Ave N
Length: 0.25 miles
Direction: N-S
Address range: 4900 to 5199
Direction: N-S
Address range: 4900 to 5199
Irving Ave N
Length: 0.25 miles
Directions: N-S, SW-NE
Address range: 5000 to 5199
Directions: N-S, SW-NE
Address range: 5000 to 5199
Oliver Ave N
Length: 0.24 miles
Direction: N-S
Address range: 4900 to 5099
Direction: N-S
Address range: 4900 to 5099
Newton Ave N
Length: 0.20 miles
Direction: N-S
Address range: 4900 to 5199
Direction: N-S
Address range: 4900 to 5199
James Ave N
Length: 0.15 miles
Direction: N-S
Address range: 4900 to 5199
Direction: N-S
Address range: 4900 to 5199
52nd Ave
Length: 0.09 miles
Direction: E-W
Direction: E-W
Other features:
Shingle Crk
Length: 1.08 miles
Directions: E-W, N-S, SE-NW
Directions: E-W, N-S, SE-NW
Ryan Crk
Length: 0.19 miles
Directions: E-W, N-S
Directions: E-W, N-S