Humboldt Industrial neighborhood in Minneapolis, Minnesota (MN), 55430 detailed profile
Settings
X

Business Search - 14 Million verified businesses
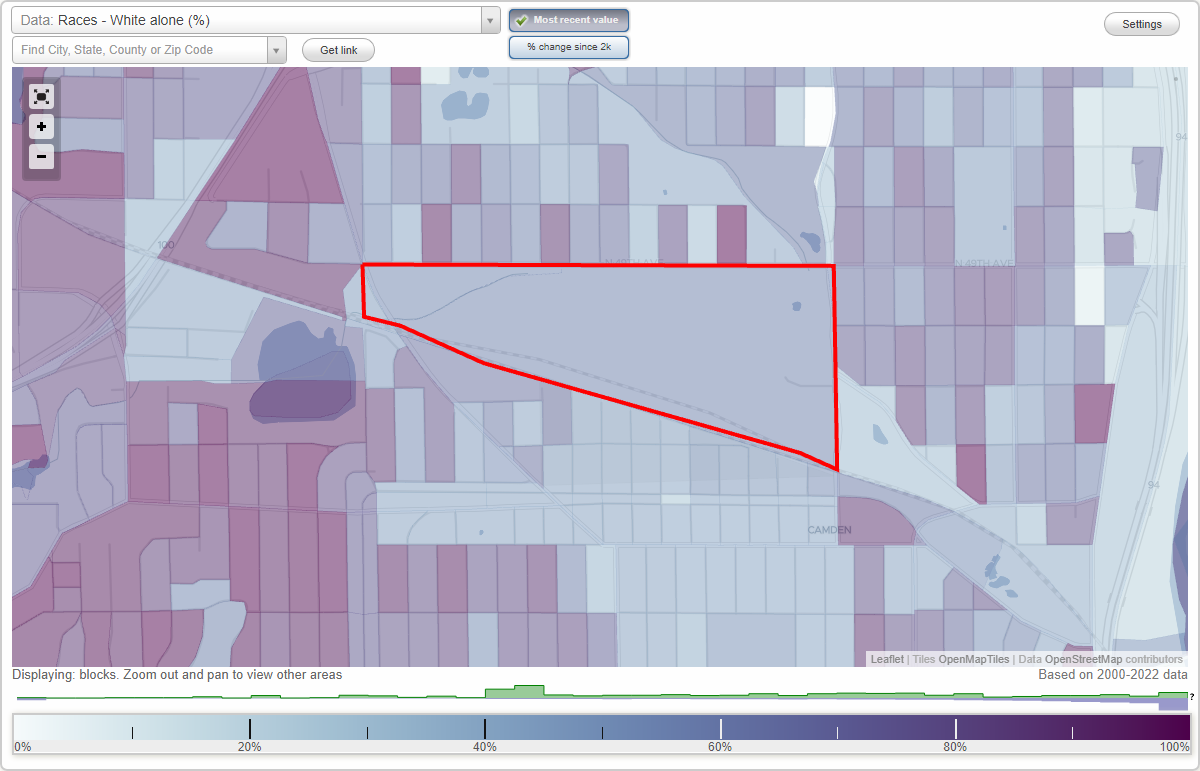
Area: 0.267 square miles
Population: 432
Population density:
| Humboldt Industrial: | 1,617 people per square mile |
| Minneapolis: | 7,744 people per square mile |

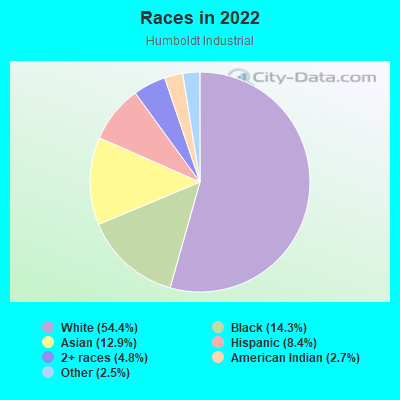
- 24054.4%White
- 6314.3%Black
- 5712.9%Asian
- 378.4%Hispanic or Latino
- 214.8%Two or more races
- 122.7%American Indian
- 112.5%Some other race
Median household income in 2022:
| Humboldt Industrial: | $71,538 |
| Minneapolis: | $74,473 |
Distribution of median household income
![Distribution of median household income]()
- 7Less than $10,000
- 100$10,000 to $19,999
- 72$20,000 to $29,999
- 95$30,000 to $39,999
- 70$40,000 to $49,999
- 15$50,000 to $59,999
- 46$60,000 to $74,999
- 44$75,000 to $99,999
- 5$100,000 to $124,999
- 17$125,000 to $149,999
- 10$150,000 to $199,999
- 31$200,000 or more

Distribution of owner-occupied house/condo value
![Distribution of owner-occupied house/condo value]()
- 44Less than $50,000
- 61$50,000 to $99,999
- 87$100,000 to $149,999
- 44$150,000 to $199,999
- 60$200,000 to $249,999
- 32$250,000 to $299,999
- 40$300,000 to $399,999
- 100$400,000 to $499,999
- 17$500,000 to $749,999

Distribution of rent paid by renters
![Distribution of rent paid by renters]()
- 122$200 to $299
- 40$300 to $399
- 40$400 to $499
- 51$500 to $599
- 82$600 to $699
- 31$700 to $799
- 52$800 to $899
- 24$900 to $999
- 33$1,000 to $1,249
- 34$1,250 to $1,499
- 15$1,500 to $1,999
- 18$2,000 or more

| Males: | 235 |
| Females: | 197 |
Males:
| This neighborhood: | 38.6 years |
| Whole city: | 33.3 years |
| This neighborhood: | 38.6 years |
| Whole city: | 33.2 years |
Average household size:
| Humboldt Industrial: | 2.7 people |
| Minneapolis: | 2.1 people |
Percentage of family households:
| Humboldt Industrial: | 68.6% |
| Minneapolis: | 34.1% |
| Here: | 60.1% |
| Minneapolis: | 29.8% |
Percentage of married-couple families with children (among all households):
| Humboldt Industrial: | 20.9% |
| Minneapolis: | 31.8% |
Percentage of single-mother households (among all households):
| Humboldt Industrial: | 12.9% |
| Minneapolis: | 10.5% |
Percentage of never married males 15 years old and over:
Percentage of never married females 15 years old and over:
| Humboldt Industrial: | 22.3% |
| Minneapolis: | 27.0% |
Percentage of never married females 15 years old and over:
| Humboldt Industrial: | 16.2% |
| city: | 25.4% |
Percentage of people that speak English not well or not at all:
| Humboldt Industrial: | 6.0% |
| Minneapolis: | 3.8% |
Percentage of people born in this state:
Percentage of people born in another U.S. state:
Percentage of native residents but born outside the U.S.:
Percentage of foreign born residents:
| Here: | 54.0% |
| Minneapolis: | 51.9% |
Percentage of people born in another U.S. state:
| Humboldt Industrial: | 22.6% |
| Minneapolis: | 31.8% |
Percentage of native residents but born outside the U.S.:
| Here: | 2.6% |
| city: | 1.5% |
Percentage of foreign born residents:
| Here: | 23.4% |
| Minneapolis: | 14.7% |
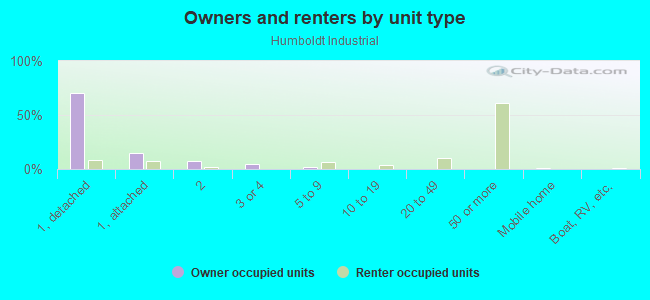
Owner-occupied
Renter-occupied

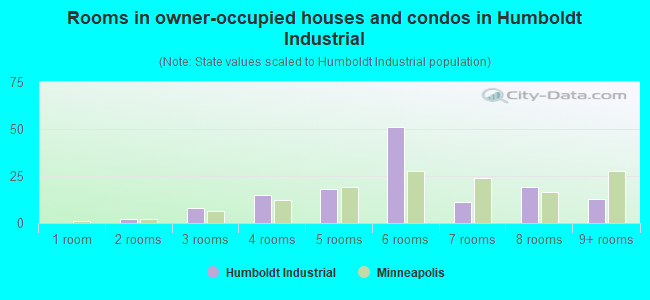
- Rooms in owner-occupied houses and condos in Humboldt Industrial
- 01 room
- 22 rooms
- 83 rooms
- 154 rooms
- 185 rooms
- 516 rooms
- 117 rooms
- 198 rooms
- 139+ rooms
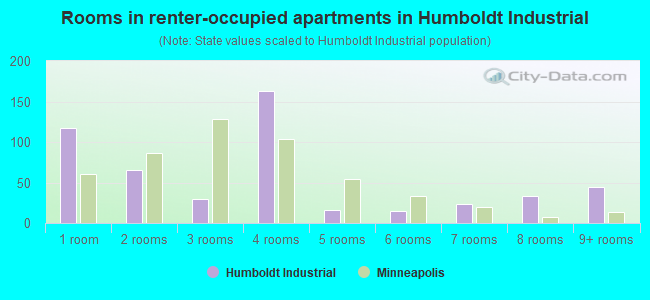
- Rooms in renter-occupied apartments in Humboldt Industrial
- 1171 room
- 662 rooms
- 303 rooms
- 1634 rooms
- 165 rooms
- 156 rooms
- 237 rooms
- 338 rooms
- 459+ rooms
Owner-occupied
Renter-occupied
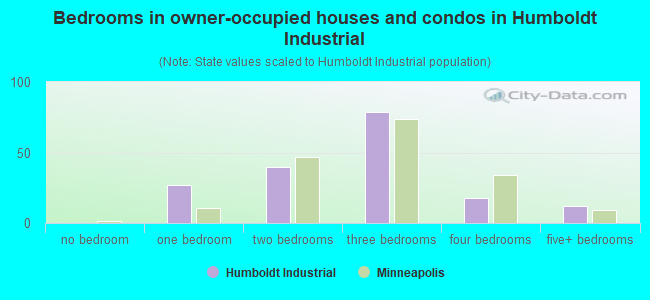
- Bedrooms in owner-occupied houses and condos in Humboldt Industrial
- 0no bedroom
- 271 bedroom
- 402 bedrooms
- 793 bedrooms
- 184 bedrooms
- 125+ bedrooms
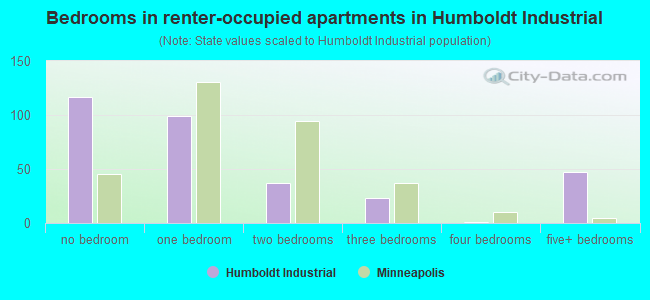
- Bedrooms in renter-occupied apartments in Humboldt Industrial
- 117no bedroom
- 991 bedroom
- 372 bedrooms
- 233 bedrooms
- 14 bedrooms
- 475+ bedrooms
Average number of cars or other vehicles available in houses/condos:
Average number of cars or other vehicles available in apartments:
| This neighborhood: | 3.3 |
| Minneapolis: | 1.6 |
Average number of cars or other vehicles available in apartments:
| Here: | 9.0 |
| city: | 1.1 |
Percentage of units with a mortgage:
| Humboldt Industrial: | 96.8% |
| Minneapolis: | 71.8% |
Average estimated value of detached houses in 2022 (99.4% of all units):
| Humboldt Industrial: | $207,131 |
| Minnesota: | $374,552 |
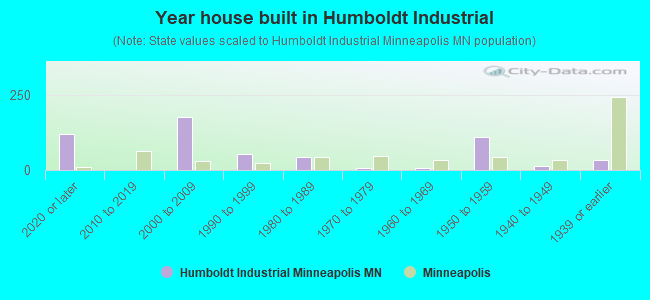
- Year house built in Humboldt Industrial
- 1222020 or later
- 02010 to 2019
- 1762000 to 2009
- 551990 to 1999
- 421980 to 1989
- 71970 to 1979
- 81960 to 1969
- 1121950 to 1959
- 131940 to 1949
- 341939 or earlier
City-data.com crime index for city in 2020 (higher means more crime):
| City: | 600.2 |
| U.S. average: | 219.5 |
Travel time to work (commute)
![Travel time to work (commute)]()
- 1Less than 5 minutes
- 75 to 9 minutes
- 2810 to 14 minutes
- 4215 to 19 minutes
- 3420 to 24 minutes
- 2325 to 29 minutes
- 6730 to 34 minutes
- 435 to 39 minutes
- 340 to 44 minutes
- 945 to 59 minutes
- 460 to 89 minutes
- 1190 or more minutes

Means of transportation to work
![Means of transportation to work]()
- 54.3%119Drove a car alone
- 2.3%5Carpooled
- 25.6%56Bus
- 0.9%2Light rail, streetcar or trolley
- 2.3%5Taxi
- 11.0%24Bicycle
- 57.5%126Walked
- 3.2%7Other means
- 16.9%37Worked at home

Time leaving home to go to work
![Time leaving home to go to work]()
- 3512:00 a.m. to 4:59 a.m.
- 115:00 a.m. to 5:29 a.m.
- 55:30 a.m. to 5:59 a.m.
- 36:00 a.m. to 6:29 a.m.
- 456:30 a.m. to 6:59 a.m.
- 197:00 a.m. to 7:29 a.m.
- 277:30 a.m. to 7:59 a.m.
- 218:00 a.m. to 8:29 a.m.
- 198:30 a.m. to 8:59 a.m.
- 79:00 a.m. to 9:59 a.m.
- 2410:00 a.m. to 10:59 a.m.
- 511:00 a.m. to 11:59 a.m.
- 3412:00 p.m. to 3:59 p.m.
- 164:00 p.m. to 11:59 p.m.

Occupations of males:
- Percentage of males in management occupations (except farmers):
Here: 13.0% city: 12.1%
- Percentage of males in business and financial operations occupations:
Here: 3.8% city: 9.1%
- Percentage of males in computer and mathematical occupations:
Here: 5.5% city: 8.4%
- Percentage of males in education, training, and library occupations:
Here: 4.4% city: 5.2%
- Percentage of males in service occupations:
Here: 16.8% city: 12.6%
- Percentage of males in sales and office occupations:
Here: 20.6% city: 15.3%
- Percentage of males in production occupations:
Here: 5.5% city: 5.8%
- Percentage of males in transportation occupations:
Here: 17.8% city: 4.1%
- Percentage of males in material moving occupations:
Here: 12.5% city: 3.6%
Occupations of females:
- Percentage of females in business and financial operations occupations:
Here: 5.0% city: 9.8%
- Percentage of females in life, physical, and social science occupations:
Here: 13.0% city: 2.3%
- Percentage of females in community and social services occupations:
Here: 17.5% city: 3.8%
- Percentage of females in education, training, and library occupations:
Here: 21.8% city: 10.6%
- Percentage of females in service occupations:
Here: 6.9% city: 17.8%
- Percentage of females in sales and office occupations:
Here: 38.6% city: 18.7%
- Percentage of females in production occupations:
Here: 10.0% city: 2.7%
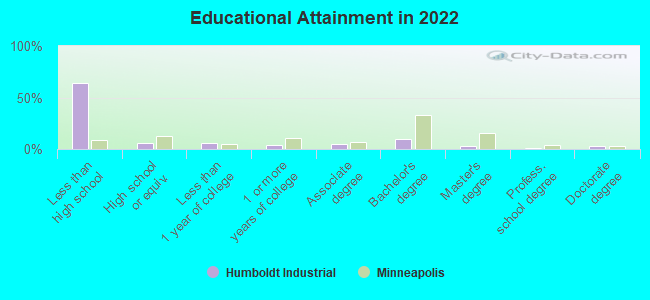
Education in this neighborhood (subdivision or community):
- Percentage of people 3 years and older in K-12 schools:
Humboldt Industrial: 40.6% Minneapolis: 14.0%
- Percentage of people 3 years and older in undergraduate colleges:
Humboldt Industrial: 10.3% Minneapolis: 8.6%
- Percentage of people 3 years and older in grad. or professional schools:
Humboldt Industrial: 2.3% Minneapolis: 2.9%
- Percentage of students K-12 enrolled in private schools:
Humboldt Industrial: 38.7% Minneapolis: 14.1%
Percentage of population below poverty level:
| Humboldt Industrial: | 12.3% |
| Minneapolis: | 17.2% |
Median year owner moved in (as recorded in 2022):
| Humboldt Industrial: | 2009 |
| Minneapolis: | 2012 |
Percentage of married-couple families with both working:
| Humboldt Industrial: | 46.0% |
| Minneapolis: | 73.9% |
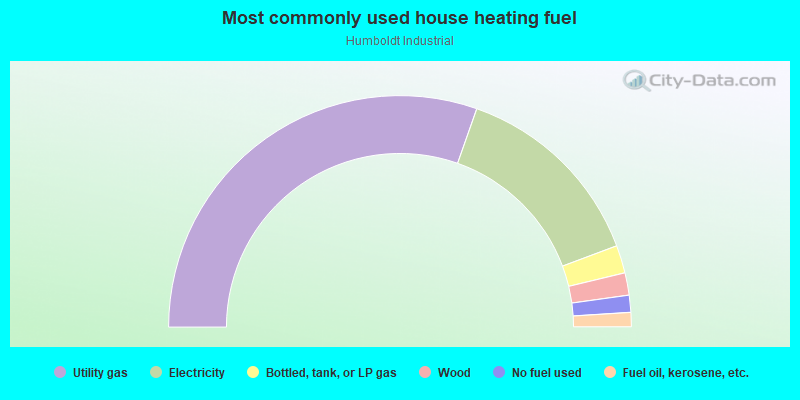
- 60.8%Utility gas
- 27.8%Electricity
- 3.9%Bottled, tank, or LP gas
- 3.1%Wood
- 2.4%No fuel used
- 2.0%Fuel oil, kerosene, etc.
Roads and streets:
Humboldt Ave N (Co Rd 57)
Length: 0.28 miles
Direction: N-S
Address range: 4540 to 4799
Direction: N-S
Address range: 4540 to 4799
Railroad features:
Canadian Pacific Rlwy
Length: 2.08 miles
Direction: E-W
Direction: E-W
Other features:
Ryan Crk
Length: 0.45 miles
Directions: E-W, SW-NE
Directions: E-W, SW-NE
Other features:
Shingle Crk
Length: 0.25 miles
Directions: N-S, SE-NW
Directions: N-S, SE-NW