Central neighborhood in Minneapolis, Minnesota (MN), 55407, 55408, 55409 detailed profile
Settings
X

Business Search - 14 Million verified businesses
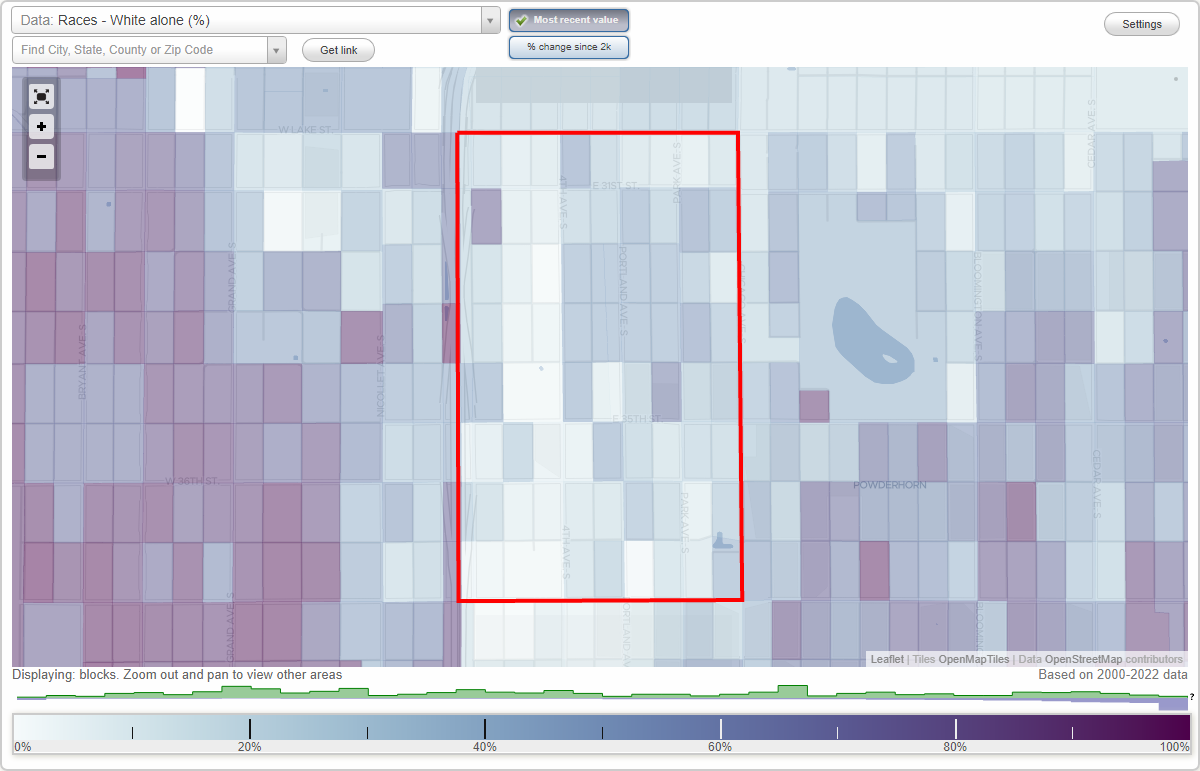
Area: 0.582 square miles
Population: 8,773
Population density:
| Central: | 15,071 people per square mile |
| Minneapolis: | 7,744 people per square mile |

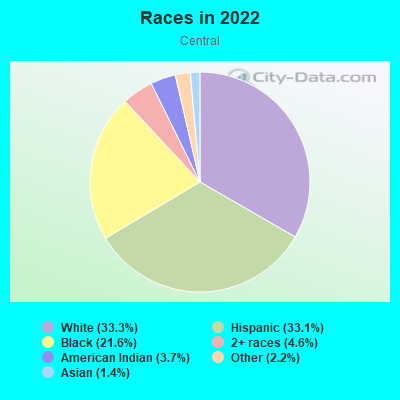
- 3,07733.3%White
- 3,06433.1%Hispanic or Latino
- 2,00021.6%Black
- 4234.6%Two or more races
- 3443.7%American Indian
- 2052.2%Some other race
- 1331.4%Asian
Median household income in 2022:
| Central: | $81,168 |
| Minneapolis: | $74,473 |
Distribution of median household income
![Distribution of median household income]()
- 154Less than $10,000
- 148$10,000 to $19,999
- 229$20,000 to $29,999
- 400$30,000 to $39,999
- 207$40,000 to $49,999
- 339$50,000 to $59,999
- 333$60,000 to $74,999
- 557$75,000 to $99,999
- 274$100,000 to $124,999
- 236$125,000 to $149,999
- 202$150,000 to $199,999
- 149$200,000 or more

Distribution of owner-occupied house/condo value
![Distribution of owner-occupied house/condo value]()
- 416Less than $50,000
- 135$50,000 to $99,999
- 602$100,000 to $149,999
- 443$150,000 to $199,999
- 345$200,000 to $249,999
- 258$250,000 to $299,999
- 407$300,000 to $399,999
- 132$400,000 to $499,999
- 119$500,000 to $749,999
- 60$750,000 to $999,999
- 7$1,000,000 or more

Distribution of rent paid by renters
![Distribution of rent paid by renters]()
- 98Less than $100
- 84$100 to $199
- 94$300 to $399
- 167$400 to $499
- 139$500 to $599
- 89$600 to $699
- 118$700 to $799
- 216$800 to $899
- 200$900 to $999
- 267$1,000 to $1,249
- 169$1,250 to $1,499
- 347$1,500 to $1,999
- 174$2,000 or more

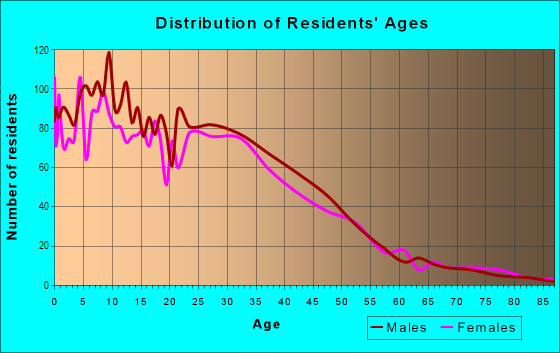
| Males: | 4,311 |
| Females: | 4,461 |
Males:
| This neighborhood: | 30.0 years |
| Whole city: | 33.3 years |
| This neighborhood: | 30.4 years |
| Whole city: | 33.2 years |
Average household size:
| Central: | 3.1 people |
| Minneapolis: | 2.1 people |
Percentage of family households:
| Central: | 49.3% |
| Minneapolis: | 34.1% |
| Here: | 31.4% |
| Minneapolis: | 29.8% |
Percentage of married-couple families with children (among all households):
| Central: | 17.7% |
| Minneapolis: | 31.8% |
Percentage of single-mother households (among all households):
| Central: | 11.6% |
| Minneapolis: | 10.5% |
Percentage of never married males 15 years old and over:
Percentage of never married females 15 years old and over:
| Central: | 28.8% |
| Minneapolis: | 27.0% |
Percentage of never married females 15 years old and over:
| Central: | 29.5% |
| city: | 25.4% |
Percentage of people that speak English not well or not at all:
| Central: | 7.6% |
| Minneapolis: | 3.8% |
Percentage of people born in this state:
Percentage of people born in another U.S. state:
Percentage of native residents but born outside the U.S.:
Percentage of foreign born residents:
| Here: | 49.9% |
| Minneapolis: | 51.9% |
Percentage of people born in another U.S. state:
| Central: | 25.8% |
| Minneapolis: | 31.8% |
Percentage of native residents but born outside the U.S.:
| Here: | 4.0% |
| city: | 1.5% |
Percentage of foreign born residents:
| Here: | 20.3% |
| Minneapolis: | 14.7% |
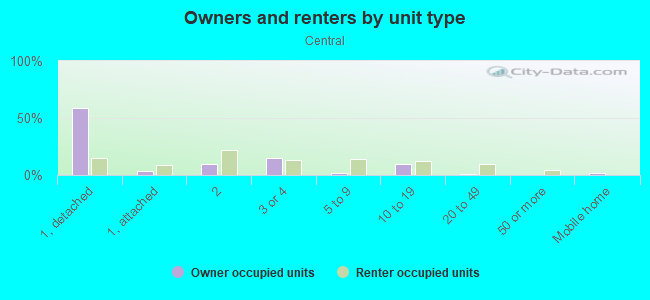
Owner-occupied
Renter-occupied

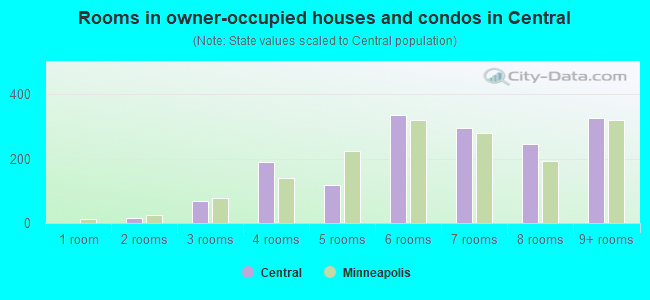
- Rooms in owner-occupied houses and condos in Central
- 01 room
- 162 rooms
- 673 rooms
- 1894 rooms
- 1195 rooms
- 3366 rooms
- 2967 rooms
- 2458 rooms
- 3269+ rooms
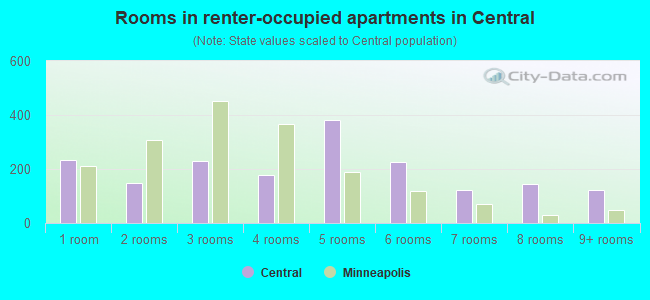
- Rooms in renter-occupied apartments in Central
- 2331 room
- 1502 rooms
- 2303 rooms
- 1794 rooms
- 3815 rooms
- 2256 rooms
- 1217 rooms
- 1468 rooms
- 1219+ rooms
Owner-occupied
Renter-occupied
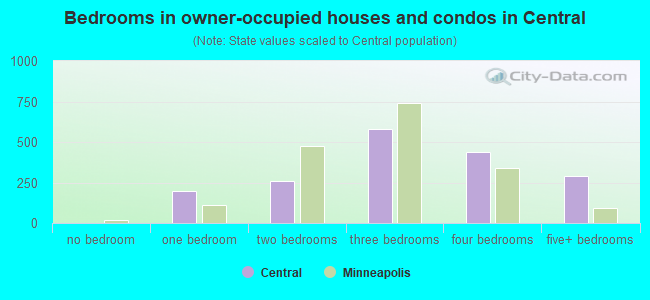
- Bedrooms in owner-occupied houses and condos in Central
- 0no bedroom
- 2001 bedroom
- 2602 bedrooms
- 5823 bedrooms
- 4384 bedrooms
- 2915+ bedrooms
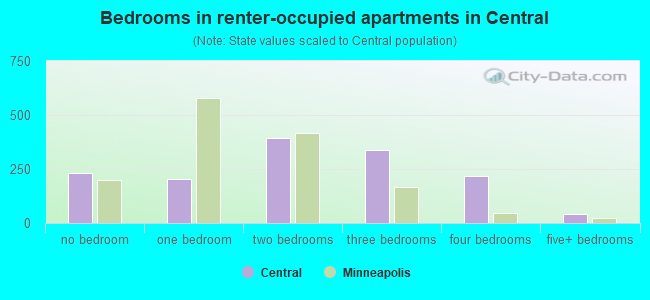
- Bedrooms in renter-occupied apartments in Central
- 233no bedroom
- 2051 bedroom
- 3952 bedrooms
- 3363 bedrooms
- 2184 bedrooms
- 435+ bedrooms
Average number of cars or other vehicles available in houses/condos:
Average number of cars or other vehicles available in apartments:
| This neighborhood: | 1.8 |
| Minneapolis: | 1.6 |
Average number of cars or other vehicles available in apartments:
| Here: | 1.5 |
| city: | 1.1 |
Percentage of units with a mortgage:
| Central: | 71.1% |
| Minneapolis: | 71.8% |
Average estimated value of detached houses in 2022 (55.1% of all units):
| Central: | $281,260 |
| Minnesota: | $374,552 |
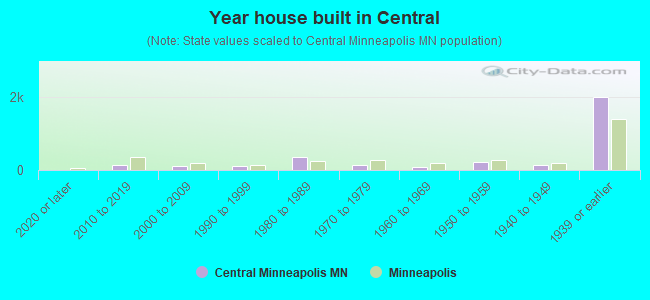
- Year house built in Central
- 02020 or later
- 1372010 to 2019
- 1142000 to 2009
- 1141990 to 1999
- 3431980 to 1989
- 1441970 to 1979
- 751960 to 1969
- 2211950 to 1959
- 1281940 to 1949
- 1,9831939 or earlier
City-data.com crime index for city in 2020 (higher means more crime):
| City: | 600.2 |
| U.S. average: | 219.5 |
Travel time to work (commute)
![Travel time to work (commute)]()
- 134Less than 5 minutes
- 3015 to 9 minutes
- 34610 to 14 minutes
- 47615 to 19 minutes
- 67620 to 24 minutes
- 37725 to 29 minutes
- 48930 to 34 minutes
- 5035 to 39 minutes
- 14340 to 44 minutes
- 22745 to 59 minutes
- 6760 to 89 minutes
- 12190 or more minutes

Means of transportation to work
![Means of transportation to work]()
- 54.1%2,268Drove a car alone
- 10.1%424Carpooled
- 8.6%360Bus
- 3.2%133Subway or elevated rail
- 5.1%215Taxi
- 3.1%132Motorcycle
- 3.5%147Bicycle
- 5.0%211Walked
- 2.8%117Other means
- 16.4%688Worked at home

Time leaving home to go to work
![Time leaving home to go to work]()
- 11812:00 a.m. to 4:59 a.m.
- 1255:00 a.m. to 5:29 a.m.
- 1145:30 a.m. to 5:59 a.m.
- 2826:00 a.m. to 6:29 a.m.
- 3166:30 a.m. to 6:59 a.m.
- 3367:00 a.m. to 7:29 a.m.
- 3557:30 a.m. to 7:59 a.m.
- 3718:00 a.m. to 8:29 a.m.
- 2718:30 a.m. to 8:59 a.m.
- 4139:00 a.m. to 9:59 a.m.
- 6910:00 a.m. to 10:59 a.m.
- 7011:00 a.m. to 11:59 a.m.
- 26012:00 p.m. to 3:59 p.m.
- 2464:00 p.m. to 11:59 p.m.

Occupations of males:
- Percentage of males in management occupations (except farmers):
Here: 6.3% city: 12.1%
- Percentage of males in business and financial operations occupations:
Here: 2.3% city: 9.1%
- Percentage of males in computer and mathematical occupations:
Here: 5.6% city: 8.4%
- Percentage of males in architecture and engineering occupations:
Here: 4.9% city: 4.6%
- Percentage of males in community and social services occupations:
Here: 5.8% city: 1.8%
- Percentage of males in education, training, and library occupations:
Here: 4.9% city: 5.2%
- Percentage of males in arts, design, entertainment, sports, and media occupations:
Here: 2.8% city: 4.0%
- Percentage of males in healthcare practitioners and technical occupations:
Here: 2.2% city: 3.6%
- Percentage of males in service occupations:
Here: 26.1% city: 12.6%
- Percentage of males in sales and office occupations:
Here: 10.6% city: 15.3%
- Percentage of males in farming, fishing, and forestry occupations:
Here: 1.1% city: 0.3%
- Percentage of males in construction, extraction, and maintenance occupations:
Here: 6.6% city: 3.3%
- Percentage of males in production occupations:
Here: 10.6% city: 5.8%
- Percentage of males in transportation occupations:
Here: 5.3% city: 4.1%
- Percentage of males in material moving occupations:
Here: 3.2% city: 3.6%
Occupations of females:
- Percentage of females in management occupations (except farmers):
Here: 7.7% city: 11.4%
- Percentage of females in business and financial operations occupations:
Here: 6.1% city: 9.8%
- Percentage of females in life, physical, and social science occupations:
Here: 5.6% city: 2.3%
- Percentage of females in community and social services occupations:
Here: 2.9% city: 3.8%
- Percentage of females in education, training, and library occupations:
Here: 14.7% city: 10.6%
- Percentage of females in arts, design, entertainment, sports, and media occupations:
Here: 3.6% city: 5.6%
- Percentage of females in healthcare practitioners and technical occupations:
Here: 5.8% city: 8.3%
- Percentage of females in service occupations:
Here: 29.2% city: 17.8%
- Percentage of females in sales and office occupations:
Here: 18.2% city: 18.7%
- Percentage of females in construction, extraction, and maintenance occupations:
Here: 1.9% city: 0.2%
Percentage of people 16-64 in Armed Forces:
| Central: | 0.0% |
| Minneapolis: | 0.1% |
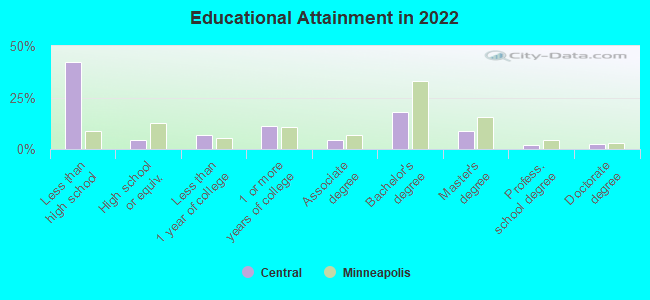
Education in this neighborhood (subdivision or community):
- Percentage of people 3 years and older in K-12 schools:
Central: 30.4% Minneapolis: 14.0%
- Percentage of people 3 years and older in undergraduate colleges:
Central: 6.0% Minneapolis: 8.6%
- Percentage of people 3 years and older in grad. or professional schools:
Central: 4.0% Minneapolis: 2.9%
- Percentage of students K-12 enrolled in private schools:
Central: 34.5% Minneapolis: 14.1%
Percentage of population below poverty level:
| Central: | 12.5% |
| Minneapolis: | 17.2% |
Median year owner moved in (as recorded in 2022):
| Central: | 2004 |
| Minneapolis: | 2012 |
Percentage of married-couple families with both working:
| Central: | 67.8% |
| Minneapolis: | 73.9% |
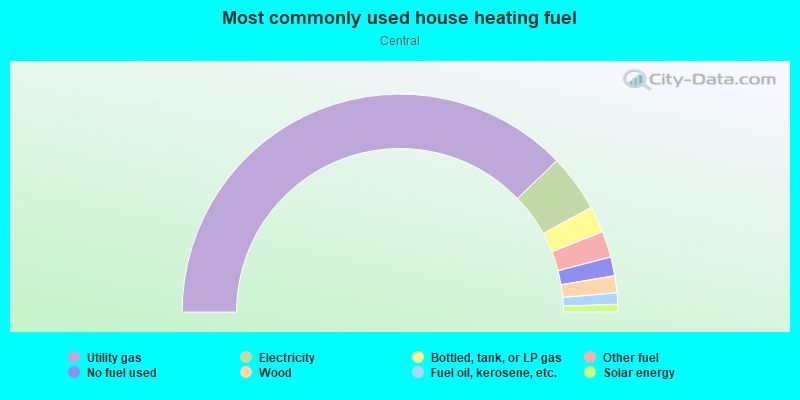
- 75.5%Utility gas
- 8.5%Electricity
- 3.9%Bottled, tank, or LP gas
- 3.9%Other fuel
- 2.8%No fuel used
- 2.5%Wood
- 1.7%Fuel oil, kerosene, etc.
- 1.1%Solar energy
Roads and streets:
Chicago Ave S
Length: 0.86 miles
Direction: N-S
Address range: 3100 to 3799
Direction: N-S
Address range: 3100 to 3799
2nd Ave S
Length: 0.86 miles
Directions: N-S, SE-NW, SW-NE
Address range: 3100 to 3799
Directions: N-S, SE-NW, SW-NE
Address range: 3100 to 3799
Columbus Ave S
Length: 0.86 miles
Directions: N-S, SW-NE
Address range: 3100 to 3799
Directions: N-S, SW-NE
Address range: 3100 to 3799
Park Ave S (Co Rd 33)
Length: 0.86 miles
Directions: N-S, SW-NE
Address range: 3100 to 3799
Directions: N-S, SW-NE
Address range: 3100 to 3799
Oakland Ave S
Length: 0.86 miles
Direction: N-S
Address range: 3100 to 3799
Direction: N-S
Address range: 3100 to 3799
3rd Ave S
Length: 0.86 miles
Directions: N-S, SE-NW, SW-NE
Address range: 3100 to 3799
Directions: N-S, SE-NW, SW-NE
Address range: 3100 to 3799
Portland Ave S (Co Rd 35)
Length: 0.86 miles
Direction: N-S
Address range: 3100 to 3799
Direction: N-S
Address range: 3100 to 3799
4th Ave S
Length: 0.86 miles
Directions: N-S, SE-NW
Address range: 3100 to 3799
Directions: N-S, SE-NW
Address range: 3100 to 3799
5th Ave S
Length: 0.86 miles
Directions: N-S, SW-NE
Address range: 3100 to 3799
Directions: N-S, SW-NE
Address range: 3100 to 3799
Co Rd 38 (E 38th St)
Length: 0.80 miles
Direction: E-W
Address range: 200 to 799
Direction: E-W
Address range: 200 to 799
E 37th St
Length: 0.79 miles
Direction: E-W
Address range: 200 to 799
Direction: E-W
Address range: 200 to 799
E 36th St
Length: 0.79 miles
Direction: E-W
Address range: 200 to 799
Direction: E-W
Address range: 200 to 799
E 35th St
Length: 0.79 miles
Direction: E-W
Address range: 200 to 799
Direction: E-W
Address range: 200 to 799
E 33rd St
Length: 0.79 miles
Direction: E-W
Address range: 200 to 799
Direction: E-W
Address range: 200 to 799
E 31st St
Length: 0.79 miles
Direction: E-W
Address range: 200 to 799
Direction: E-W
Address range: 200 to 799
E 32nd St
Length: 0.79 miles
Direction: E-W
Address range: 200 to 799
Direction: E-W
Address range: 200 to 799
E 34th St
Length: 0.79 miles
Direction: E-W
Address range: 200 to 799
Direction: E-W
Address range: 200 to 799
Clinton Ave S
Length: 0.61 miles
Directions: N-S, SW-NE
Address range: 3100 to 3699
Directions: N-S, SW-NE
Address range: 3100 to 3699