West Seneca: Fire Incidents, New York (NY)
Where are fire incidents reported in West Seneca, NY
Something went wrong! Please refresh the page.
| Fire incidents reported | |
|---|---|
| Sreet name | Count |
| HARLEM RD | 282 |
| SENECA ST | 218 |
| UNION RD | 176 |
| ORCHARD PARK RD | 172 |
| CLINTON ST | 162 |
| INDIAN CHURCH RD | 98 |
| SENECA ST | 86 |
| MINERAL SPRINGS RD | 82 |
| ORCHARD PARK RD | 80 |
| CENTER RD | 78 |
| UNION RD | 74 |
| UNION | 72 |
| INDIAN CHURCH | 68 |
| ORCHARD PARK | 68 |
| SENECA ST. | 58 |
| CLINTON ST | 50 |
| SLADE | 48 |
| CENTER RD | 44 |
| EAST AND WEST RD | 40 |
| SENECA | 40 |
| RIDGE ROAD | 38 |
| SLADE AVE | 38 |
| EMPIRE DR | 34 |
| I90 EAST | 34 |
| MINERAL SPRINGS | 32 |
| RIDGE RD | 32 |
| SLADE AVENUE | 32 |
| HARLEM ROAD | 30 |
| CLINTON | 28 |
| MAIN ST | 28 |
| Other | 227 |
2002 - 2018 National Fire Incident Reporting System (NFIRS) incidents
- Incident types reported to NFIRS in West Seneca, NY
- 15,46463.6%Rescue & EMS
- 2,54910.5%Fire
- 2,1158.7%Good Intent Call
- 1,9287.9%False Alarm
- 1,7827.3%Hazardous Condition
- 3151.3%Service Call
- 860.4%Severe Weather
- 690.3%Overpressure Rupture
- Fire incident types reported to NFIRS in West Seneca, NY
- 1,01239.7%Structure Fires
- 86233.8%Other
- 38915.3%Outside Fires
- 28611.2%Mobile Property/Vehicle Fires
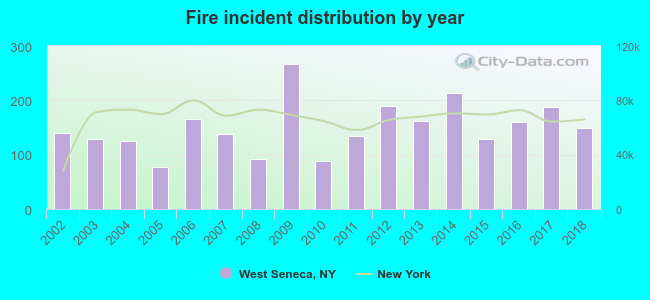 According to the data from the years 2002 - 2018 the average number of fires per year is 150. The highest number of fires - 266 took place in 2009, and the least - 78 in 2005. The data has a rising trend.
The average number of yearly fire incidents per 10k residents in West Seneca, NY compared to nearest cities:
(Note: Based on data for the last 3 years, including only cities with population 5,000 and above)
| West Seneca: | 37.2 |
| Lackawanna: | 37.7 |
| Cheektowaga: | 32.4 |
| Depew: | 28.7 |
| Lancaster: | 35.0 |
| Buffalo: | 16.1 |
| Elma: | 14.1 |
| Williamsville: | 100.3 |
| East Aurora: | 27.7 |
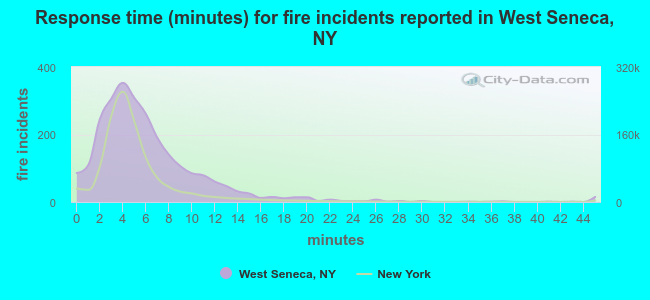 The median response time based on all reported fire incidents is 5 minutes. This is higher compared to the New York median value.
The median response time in West Seneca, NY compared to nearest cities:
(Note: Based on data for all years, including only cities with at least 500 fire incidents)
| West Seneca: | 5 minutes |
| Lackawanna: | 3 minutes |
| Blasdell: | 9 minutes |
| Cheektowaga: | 4 minutes |
| Orchard Park: | 5 minutes |
| Depew: | 3 minutes |
| Lancaster: | 0 minutes |
| Buffalo: | 3 minutes |
| Williamsville: | 4 minutes |
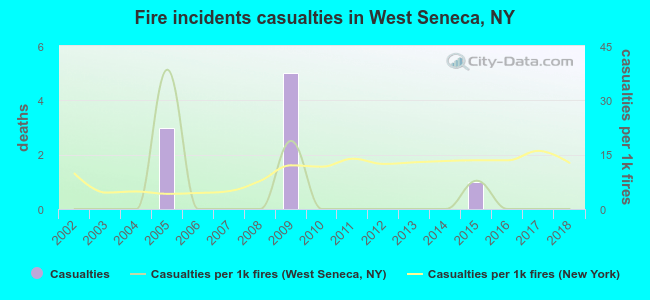 According to the reports from the years 2002 - 2018 the average number of fire-related casualties per year is 1. The highest number of reported casualties - 5 took place in 2009, and the lowest - 0 in 2002. The data has a constant trend.
The average number of injuries per 1,000 fires is 4. This indicator was the highest - 38 in 2005, and the lowest 0 in 2002. The trend for casualties per 1,000 fires is constant. Compared to the New York value the number of injuries per 1,000 fire incidents is much lower.
According to the reports from the years 2002 - 2018 the average number of fire-related casualties per year is 1. The highest number of reported casualties - 5 took place in 2009, and the lowest - 0 in 2002. The data has a constant trend.
The average number of injuries per 1,000 fires is 4. This indicator was the highest - 38 in 2005, and the lowest 0 in 2002. The trend for casualties per 1,000 fires is constant. Compared to the New York value the number of injuries per 1,000 fire incidents is much lower.Casualties per 1,000 incidents in West Seneca, NY compared to nearest cities:
(Note: Based on data for all years, including only cities with at least 500 fire incidents)
| West Seneca: | 3.5 |
| Lackawanna: | 18.9 |
| Blasdell: | 0.0 |
| Cheektowaga: | 9.8 |
| Orchard Park: | 2.0 |
| Depew: | 8.9 |
| Lancaster: | 14.3 |
| Buffalo: | 5.5 |
| Williamsville: | 3.3 |
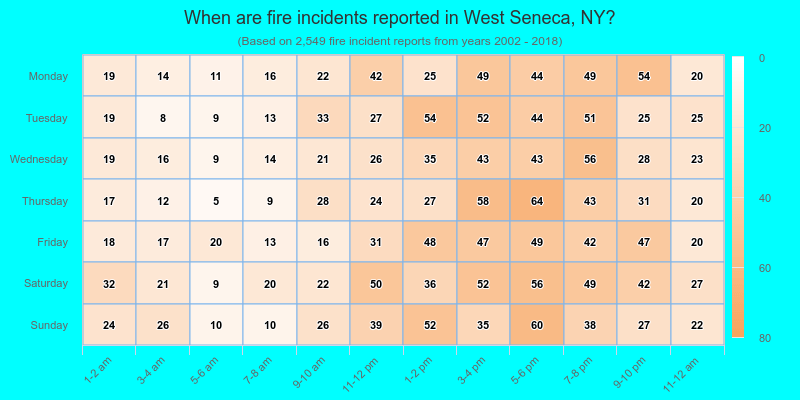
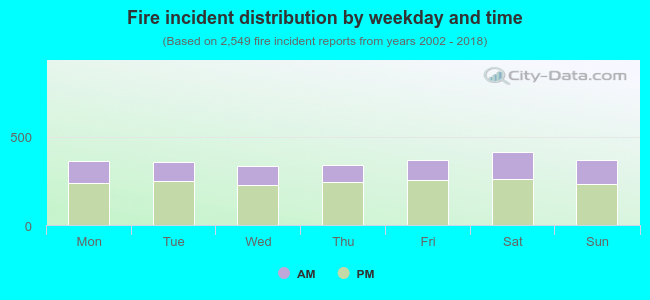 32.8% incidents where reported in the morning and 67.2% in the evening. The most fires (16.3%) took place on Saturday, and the least (13.1%) on Wednesday.
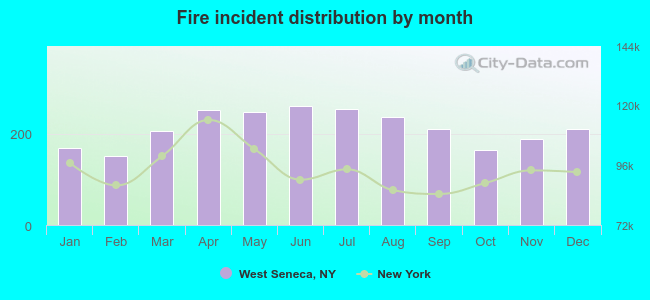 Based on the 2,549 fire incident reports from years 2002 - 2018 most fires (10.2%) took place during June, and the least (5.9%) in February.
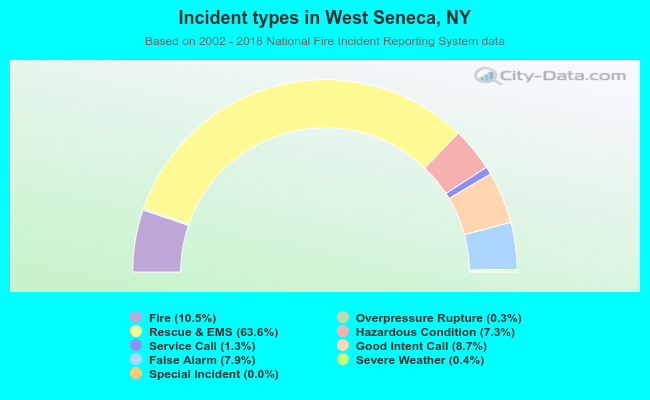 Out of all 24,316 cases reported during the years 2002 - 2018, the most belonged to the categories: Rescue & EMS (63.6%), Fire (10.5%), and Good Intent Call (8.7%).
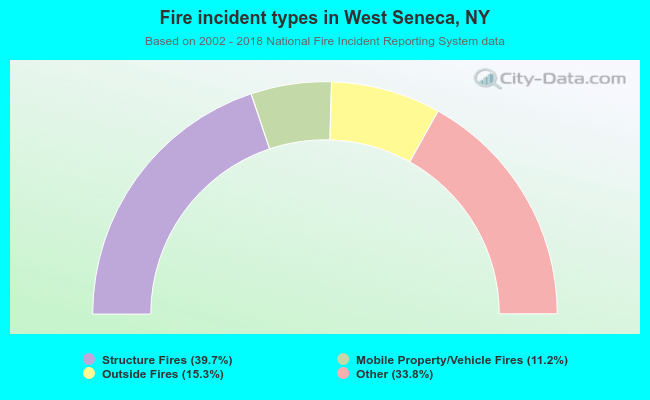 When looking into fire subcategories, the most incidents belonged to: Structure Fires (39.7%), and Other (33.8%).