Lackawanna: Fire Incidents, New York (NY)
Where are fire incidents reported in Lackawanna, NY
Something went wrong! Please refresh the page.
| Fire incidents reported | |
|---|---|
| Sreet name | Count |
| RIDGE RD | 188 |
| RIDGE | 156 |
| ABBOTT RD | 88 |
| ABBOTT | 60 |
| SOUTH PARK AVE | 56 |
| HAMBURG TPKE | 50 |
| SOUTH PARK | 50 |
| WASSON | 48 |
| MARTIN RD | 40 |
| INGHAM AVE | 32 |
| FRANKLIN | 30 |
| ODELL | 30 |
| FRANKLIN ST | 28 |
| MARTIN | 28 |
| CENTER | 24 |
| EAGAN DR | 24 |
| ELECTRIC | 24 |
| COMMERCE DR | 22 |
| MELROY | 22 |
| RIDGE RD | 20 |
| WASSON AVE | 20 |
| CENTER ST | 18 |
| COMMERCE | 18 |
| ELECTRIC AVE | 18 |
| HAMBURG TURNPIKE | 18 |
| OLCOTT | 18 |
| WARSAW | 18 |
| GATES AVE | 16 |
| LUDEL | 16 |
| PARKVIEW | 16 |
| Other | 19 |
2002 - 2018 National Fire Incident Reporting System (NFIRS) incidents
- Incident types reported to NFIRS in Lackawanna, NY
- 10,23965.0%Rescue & EMS
- 1,77311.3%False Alarm
- 1,2157.7%Fire
- 1,1667.4%Service Call
- 8325.3%Hazardous Condition
- 5053.2%Good Intent Call
- Fire incident types reported to NFIRS in Lackawanna, NY
- 55845.9%Structure Fires
- 41534.2%Outside Fires
- 12210.0%Other
- 1209.9%Mobile Property/Vehicle Fires
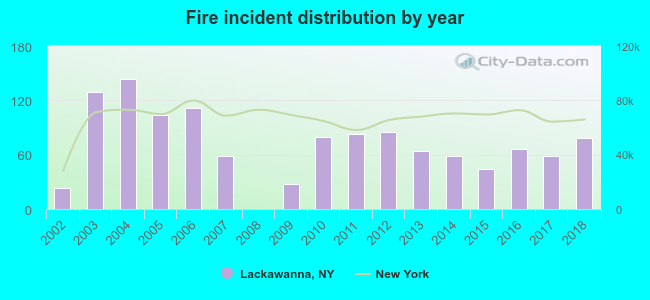 Based on the data from the years 2002 - 2018 the average number of fire incidents per year is 71. The highest number of fire incidents - 144 took place in 2004, and the least - 0 in 2008. The data has a rising trend.
The average number of yearly fire incidents per 10k residents in Lackawanna, NY compared to nearest cities:
(Note: Based on data for the last 3 years, including only cities with population 5,000 and above)
| Lackawanna: | 37.7 |
| West Seneca: | 37.2 |
| Buffalo: | 16.1 |
| Hamburg: | 177.0 |
| Cheektowaga: | 32.4 |
| Depew: | 28.7 |
| Lancaster: | 35.0 |
| Elma: | 14.1 |
| Eggertsville: | 1.0 |
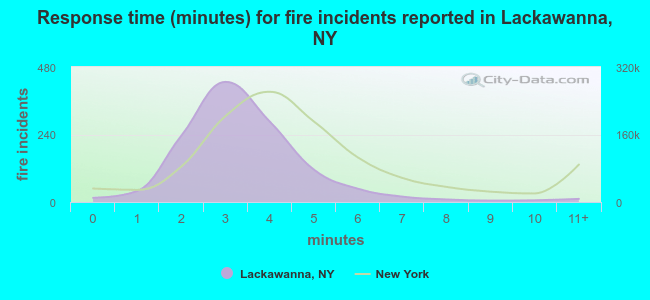 The median response time based on all reported fire incidents is 3 minutes. This is lower than the New York median value.
The median response time in Lackawanna, NY compared to nearest cities:
(Note: Based on data for all years, including only cities with at least 500 fire incidents)
| Lackawanna: | 3 minutes |
| Blasdell: | 9 minutes |
| West Seneca: | 5 minutes |
| Orchard Park: | 5 minutes |
| Buffalo: | 3 minutes |
| Hamburg: | 8 minutes |
| Cheektowaga: | 4 minutes |
| Depew: | 3 minutes |
| Lancaster: | 0 minutes |
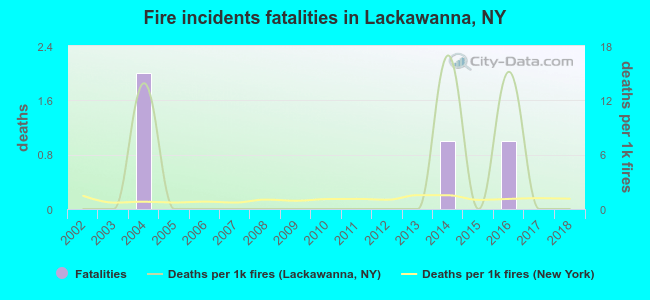 According to the reports from the years 2002 - 2018 the average number of fire-related fatalities per year is 0. The highest number of reported deaths - 2 took place in 2004, and the lowest - 0 in 2002. The data has a constant trend.
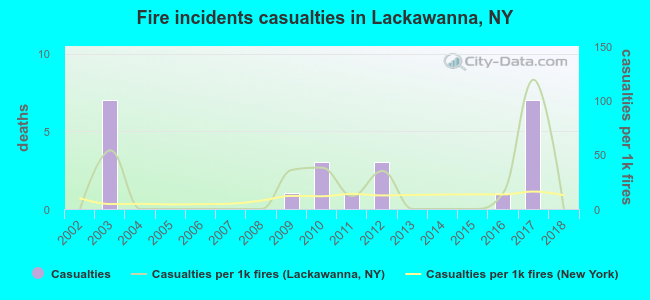 According to the data from the years 2002 - 2018 the average number of fire-related casualties per year is 1. The highest number of injuries - 7 took place in 2003, and the lowest - 0 in 2002. The data has a constant trend.
The average number of casualties per 1,000 fires is 18. This indicator was the highest - 119 in 2017, and the lowest 0 in 2002. The trend for casualties per 1,000 incidents is constant. Compared to the New York value the number of injuries per 1,000 fires is higher.
According to the data from the years 2002 - 2018 the average number of fire-related casualties per year is 1. The highest number of injuries - 7 took place in 2003, and the lowest - 0 in 2002. The data has a constant trend.
The average number of casualties per 1,000 fires is 18. This indicator was the highest - 119 in 2017, and the lowest 0 in 2002. The trend for casualties per 1,000 incidents is constant. Compared to the New York value the number of injuries per 1,000 fires is higher.Casualties per 1,000 incidents in Lackawanna, NY compared to nearest cities:
(Note: Based on data for all years, including only cities with at least 500 fire incidents)
| Lackawanna: | 18.9 |
| Blasdell: | 0.0 |
| West Seneca: | 3.5 |
| Orchard Park: | 2.0 |
| Buffalo: | 5.5 |
| Hamburg: | 0.8 |
| Cheektowaga: | 9.8 |
| Depew: | 8.9 |
| Lancaster: | 14.3 |
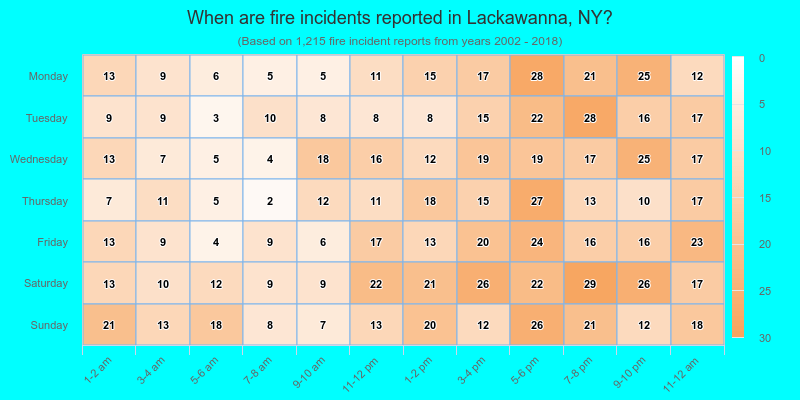
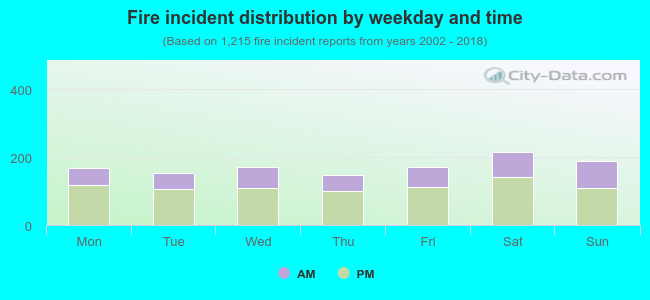 34.6% incidents where reported in the morning and 65.4% in the evening. The most fires (17.8%) took place on Saturday, and the least (12.2%) on Thursday.
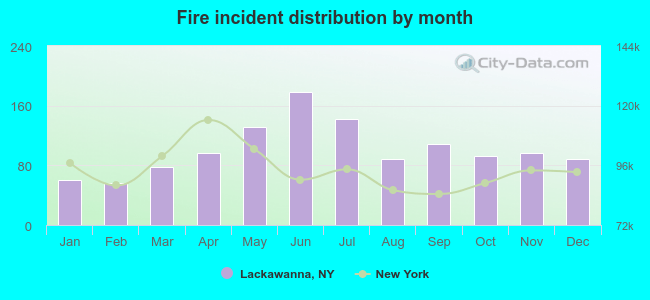 Based on the 1,215 fire incident reports from years 2002 - 2018 most fires (14.7%) took place during June, and the least (4.6%) in February.
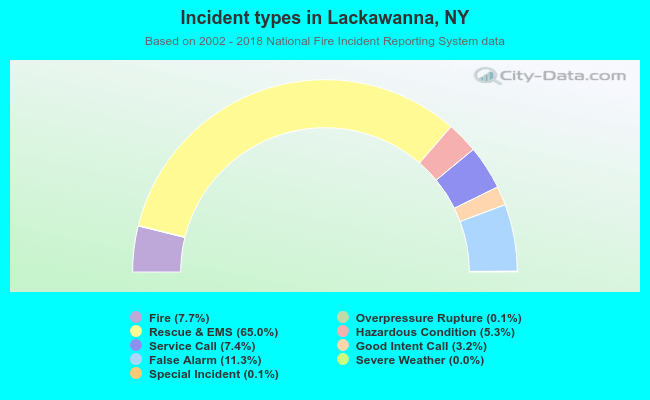 Out of all 15,755 cases reported during the years 2002 - 2018, the most belonged to the categories: Rescue & EMS (65.0%), False Alarm (11.3%), and Fire (7.7%).
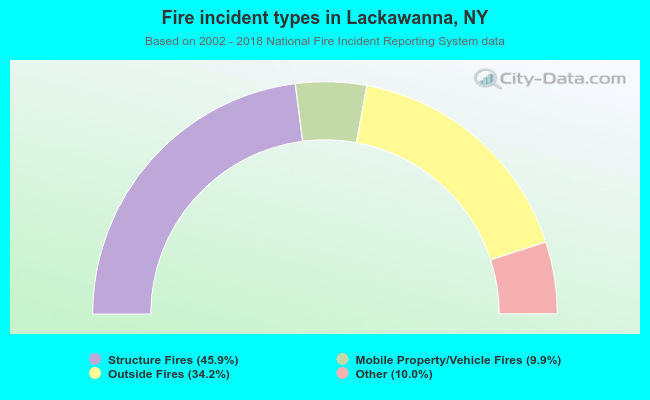 When looking into fire subcategories, the most reports belonged to: Structure Fires (45.9%), and Outside Fires (34.2%).