Buffalo: Fire Incidents, New York (NY)
Where are fire incidents reported in Buffalo, NY
Something went wrong! Please refresh the page.
| Fire incidents reported | |
|---|---|
| Sreet name | Count |
| BAILEY AVE | 550 |
| DELAWARE AVE | 502 |
| PERRY ST | 486 |
| HERTEL AVE | 392 |
| MAIN ST | 360 |
| NIAGARA ST | 314 |
| ELMWOOD AVE | 310 |
| CLINTON ST | 300 |
| DELAVAN AVE | 282 |
| FERRY ST | 270 |
| BROADWAY | 260 |
| FILLMORE AVE | 248 |
| AMHERST ST | 238 |
| GENESEE ST | 224 |
| GRANT ST | 170 |
| SOUTH PARK AVE | 170 |
| WALDEN AVE | 162 |
| FULTON ST | 156 |
| TONAWANDA ST | 156 |
| SENECA ST | 146 |
| ELLICOTT ST | 142 |
| DIVISION ST | 140 |
| WEST AVE | 140 |
| KENSINGTON AVE | 134 |
| SMITH ST | 122 |
| UTICA ST | 120 |
| MICHIGAN AVE | 116 |
| ONTARIO ST | 110 |
| ABBOTT RD | 106 |
| JEFFERSON AVE | 106 |
| Other | 7,317 |
2002 - 2018 National Fire Incident Reporting System (NFIRS) incidents
- Incident types reported to NFIRS in Buffalo, NY
- 82,64859.6%Rescue & EMS
- 16,67412.0%Hazardous Condition
- 14,24910.3%Fire
- 12,3818.9%False Alarm
- 8,4826.1%Good Intent Call
- 3,4052.5%Service Call
- 7150.5%Special Incident
- Fire incident types reported to NFIRS in Buffalo, NY
- 9,24664.9%Structure Fires
- 2,22615.6%Mobile Property/Vehicle Fires
- 1,68111.8%Outside Fires
- 1,0967.7%Other
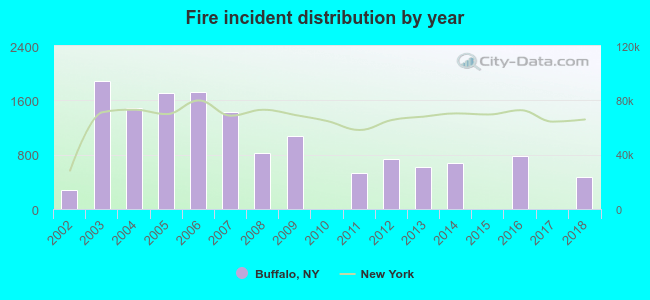 Based on the data from the years 2002 - 2018 the average number of fires per year is 838. The highest number of reported fires - 1,889 took place in 2003, and the least - 2 in 2010. The data has a growing trend.
The average number of yearly fire incidents per 10k residents in Buffalo, NY compared to nearest cities:
(Note: Based on data for the last 3 years, including only cities with population 5,000 and above)
| Buffalo: | 16.1 |
| Kenmore: | 21.9 |
| Cheektowaga: | 32.4 |
| Eggertsville: | 1.0 |
| Lackawanna: | 37.7 |
| West Seneca: | 37.2 |
| Williamsville: | 100.3 |
| Tonawanda: | 81.5 |
| Depew: | 28.7 |
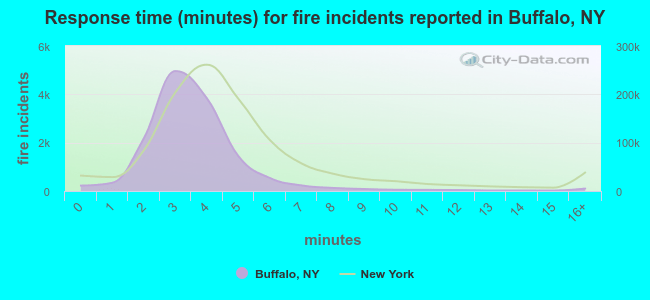 The median response time based on all reported fire incidents is 3 minutes. This is lower than the state median value.
The median response time in Buffalo, NY compared to nearest cities:
(Note: Based on data for all years, including only cities with at least 500 fire incidents)
| Buffalo: | 3 minutes |
| Kenmore: | 2 minutes |
| Cheektowaga: | 4 minutes |
| Lackawanna: | 3 minutes |
| West Seneca: | 5 minutes |
| Williamsville: | 4 minutes |
| Tonawanda: | 2 minutes |
| Depew: | 3 minutes |
| Amherst: | 4 minutes |
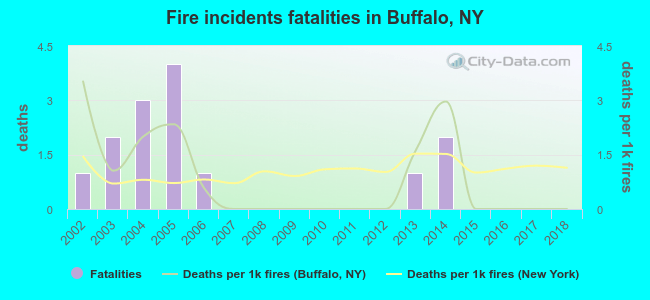 According to the data from the years 2002 - 2018 the average number of fire-related yearly deaths is 1. The highest number of deaths - 4 took place in 2005, and the lowest - 0 in 2007. The data has a decreasing trend.
The average number of deaths per 1,000 fires is 1. This indicator was the highest - 4 in 2002, and the lowest 0 in 2007. The trend for fatalities per 1,000 incidents is decreasing. Compared to the New York value the number of deaths per 1,000 fire incidents is similar.
According to the data from the years 2002 - 2018 the average number of fire-related yearly deaths is 1. The highest number of deaths - 4 took place in 2005, and the lowest - 0 in 2007. The data has a decreasing trend.
The average number of deaths per 1,000 fires is 1. This indicator was the highest - 4 in 2002, and the lowest 0 in 2007. The trend for fatalities per 1,000 incidents is decreasing. Compared to the New York value the number of deaths per 1,000 fire incidents is similar.Deaths per 1,000 incidents in Buffalo, NY compared to nearest cities:
(Note: Based on data for all years, including only cities with at least 2,500 fire incidents)
| Buffalo: | 1.0 |
| Cheektowaga: | 1.2 |
| West Seneca: | 0.8 |
| Niagara Falls: | 2.2 |
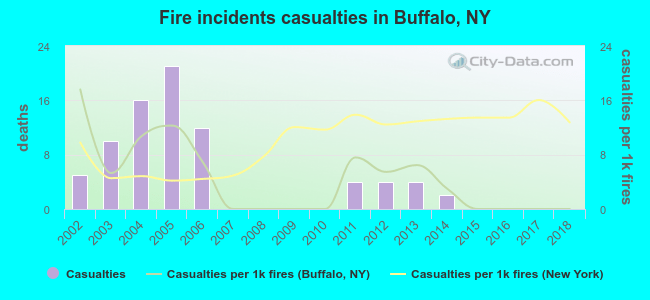 Based on the data from the years 2002 - 2018 the average number of fire-related yearly casualties is 5. The highest number of reported injuries - 21 took place in 2005, and the lowest - 0 in 2007. The data has a dropping trend.
The average number of casualties per 1,000 fire incidents is 4. This indicator was the highest - 18 in 2002, and the lowest 0 in 2007. The trend for casualties per 1,000 incidents is declining. Compared to the New York value the number of casualties per 1,000 incidents is lower.
Based on the data from the years 2002 - 2018 the average number of fire-related yearly casualties is 5. The highest number of reported injuries - 21 took place in 2005, and the lowest - 0 in 2007. The data has a dropping trend.
The average number of casualties per 1,000 fire incidents is 4. This indicator was the highest - 18 in 2002, and the lowest 0 in 2007. The trend for casualties per 1,000 incidents is declining. Compared to the New York value the number of casualties per 1,000 incidents is lower.Casualties per 1,000 incidents in Buffalo, NY compared to nearest cities:
(Note: Based on data for all years, including only cities with at least 500 fire incidents)
| Buffalo: | 5.5 |
| Kenmore: | 35.6 |
| Cheektowaga: | 9.8 |
| Lackawanna: | 18.9 |
| West Seneca: | 3.5 |
| Williamsville: | 3.3 |
| Tonawanda: | 20.9 |
| Depew: | 8.9 |
| Amherst: | 6.6 |
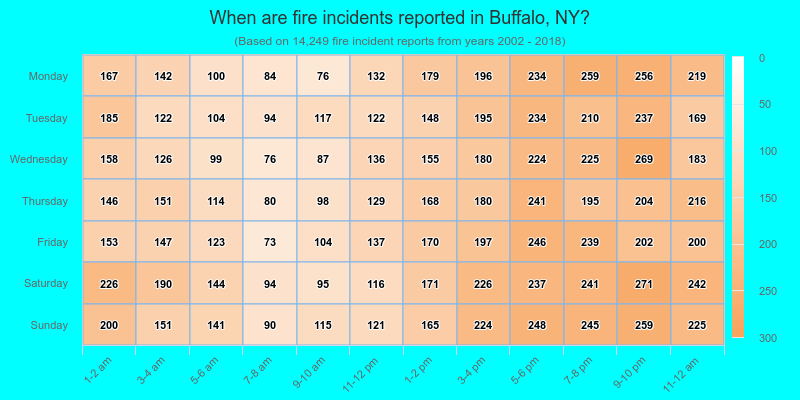
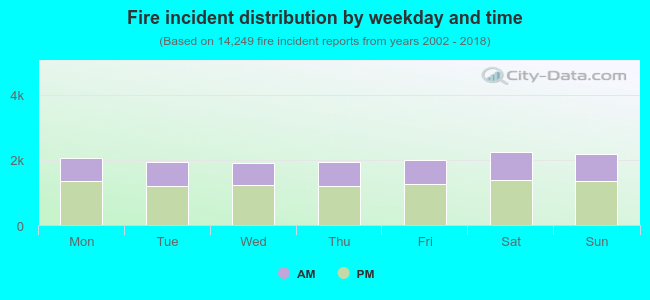 36.9% incidents where reported in the morning and 63.1% in the evening. The most fires (15.8%) took place on Saturday, and the least (13.5%) on Wednesday.
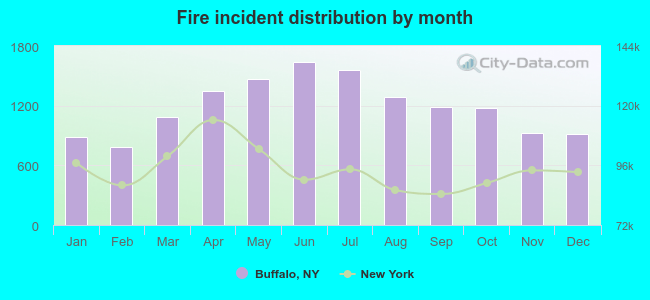 According to the 14,249 incident reports from years 2002 - 2018 most fires (11.5%) took place during June, and the least (5.5%) in February.
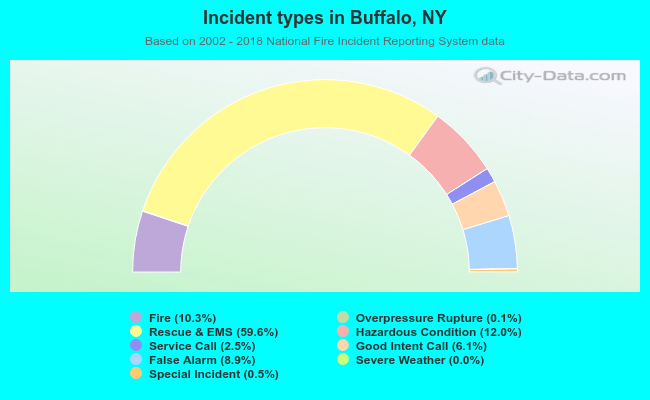 Out of all 138,721 cases reported during the years 2002 - 2018, the most belonged to the categories: Rescue & EMS (59.6%), Hazardous Condition (12.0%), and Fire (10.3%).
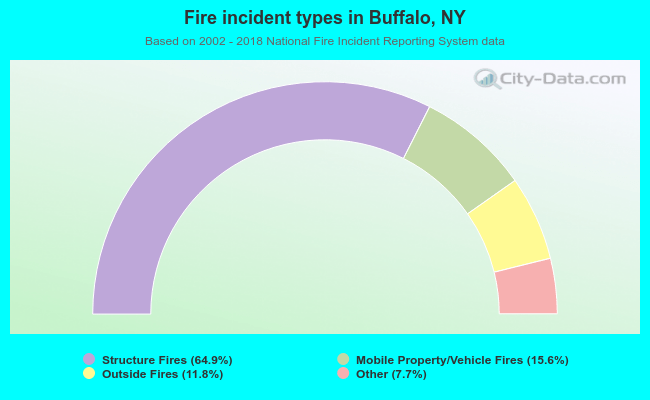 When looking into fire subcategories, the most incidents belonged to: Structure Fires (64.9%), and Mobile Property/Vehicle Fires (15.6%).