Orchard Park: Fire Incidents, New York (NY)
Where are fire incidents reported in Orchard Park, NY
Something went wrong! Please refresh the page.
| Fire incidents reported | |
|---|---|
| Sreet name | Count |
| BILLS DR | 168 |
| SOUTHWESTERN BLVD | 158 |
| CALIFORNIA RD | 64 |
| ABBOTT RD | 58 |
| CHESTNUT RIDGE RD | 52 |
| CALIFORNIA RD | 40 |
| CHESTNUT RIDGE RD | 36 |
| NORTH BUFFALO RD | 34 |
| BILLS DR | 32 |
| SOUTHWESTERN BLVD | 30 |
| MILESTRIP RD | 22 |
| ROUTE 219 EXPY | 22 |
| BIG TREE RD | 20 |
| ELLICOTT RD | 20 |
| JEWETT HOLMWOOD RD | 20 |
| MILESTRIP RD | 20 |
| S ABBOTT RD | 20 |
| SHELDON RD | 18 |
| LAKE AVE | 16 |
| POWERS RD | 16 |
| LAKEVIEW AVE | 14 |
| ORCHARD PARK RD | 14 |
| SOUTH ABBOTT RD | 14 |
| ABBOTT RD | 12 |
| ARMOR DUELLS CORNERS RD | 12 |
| BAKER RD | 12 |
| CARRIAGE DR | 12 |
| EAST QUAKER ST | 12 |
| MICHAEL RD | 12 |
| NEWTON RD | 12 |
2002 - 2018 National Fire Incident Reporting System (NFIRS) incidents
- Incident types reported to NFIRS in Orchard Park, NY
- 15,16978.4%Rescue & EMS
- 1,3607.0%False Alarm
- 1,0935.7%Hazardous Condition
- 9835.1%Fire
- 4812.5%Good Intent Call
- 2041.1%Service Call
- 310.2%Overpressure Rupture
- Fire incident types reported to NFIRS in Orchard Park, NY
- 33834.4%Structure Fires
- 31031.5%Outside Fires
- 20120.4%Other
- 13413.6%Mobile Property/Vehicle Fires
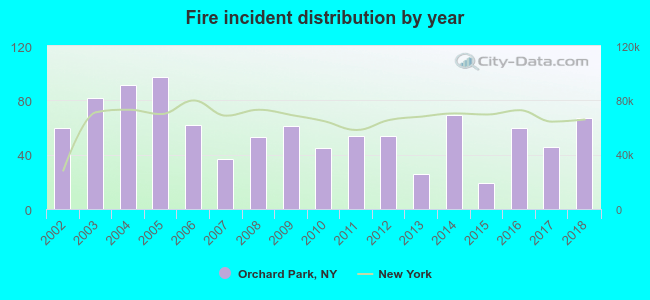 According to the data from the years 2002 - 2018 the average number of fires per year is 58. The highest number of reported fires - 97 took place in 2005, and the least - 19 in 2015. The data has a rising trend.
 The median response time based on all reported fire incidents is 5 minutes. This is higher compared to the New York median value.
The median response time in Orchard Park, NY compared to nearest cities:
(Note: Based on data for all years, including only cities with at least 500 fire incidents)
| Orchard Park: | 5 minutes |
| Blasdell: | 9 minutes |
| West Seneca: | 5 minutes |
| Hamburg: | 8 minutes |
| Lackawanna: | 3 minutes |
| Lancaster: | 0 minutes |
| Cheektowaga: | 4 minutes |
| Depew: | 3 minutes |
| Buffalo: | 3 minutes |
 29.5% incidents where reported in the morning and 70.5% in the evening. The most fires (18.7%) took place on Sunday, and the least (9.9%) on Friday.
 According to the 983 fires from years 2002 - 2018 most fires (12.1%) took place during November, and the least (5.7%) in March.
 Out of all 19,341 cases reported during the years 2002 - 2018, the most belonged to the categories: Rescue & EMS (78.4%), False Alarm (7.0%), and Hazardous Condition (5.7%).
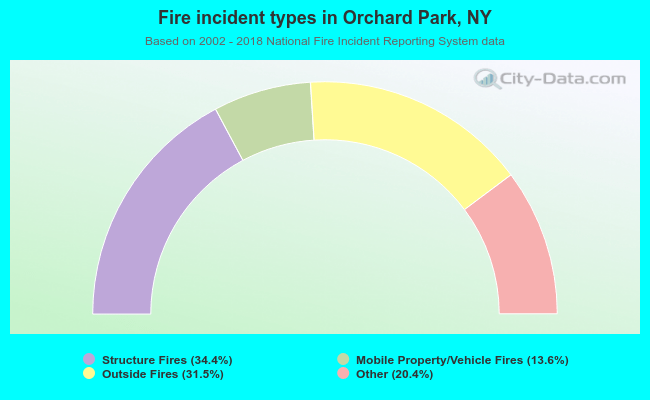 When looking into fire subcategories, the most incidents belonged to: Structure Fires (34.4%), and Outside Fires (31.5%).