East Aurora: Fire Incidents, New York (NY)
Where are fire incidents reported in East Aurora, NY
Something went wrong! Please refresh the page.
|
| |||||||||||||||||||||||||||||||||||||||||||||||||||||||||||||||||||||||||||||||||||||||||||||||||||||||||||||
2002 - 2018 National Fire Incident Reporting System (NFIRS) incidents
- Incident types reported to NFIRS in East Aurora, NY
- 80430.7%False Alarm
- 76129.0%Hazardous Condition
- 36113.8%Rescue & EMS
- 28710.9%Good Intent Call
- 2559.7%Fire
- 1104.2%Service Call
- 331.3%Severe Weather
- 70.3%Overpressure Rupture
- 50.2%Special Incident
- Fire incident types reported to NFIRS in East Aurora, NY
- 14356.1%Structure Fires
- 7529.4%Outside Fires
- 228.6%Other
- 155.9%Mobile Property/Vehicle Fires
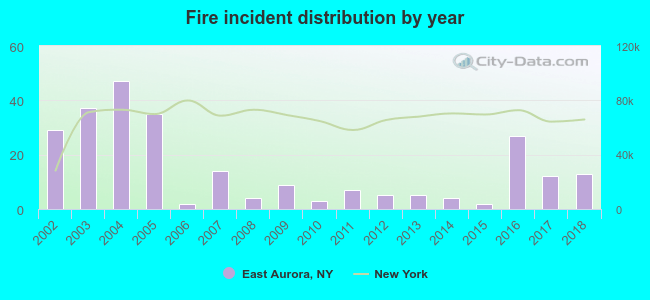 According to the data from the years 2002 - 2018 the average number of fires per year is 15. The highest number of reported fires - 47 took place in 2004, and the least - 2 in 2006. The data has a declining trend.
The average number of yearly fire incidents per 10k residents in East Aurora, NY compared to nearest cities:
(Note: Based on data for the last 3 years, including only cities with population 5,000 and above)
| East Aurora: | 27.7 |
| Elma: | 14.1 |
| Marilla: | 10.6 |
| West Seneca: | 37.2 |
| Lancaster: | 35.0 |
| Boston: | 30.7 |
| Depew: | 28.7 |
| Lackawanna: | 37.7 |
| Hamburg: | 177.0 |
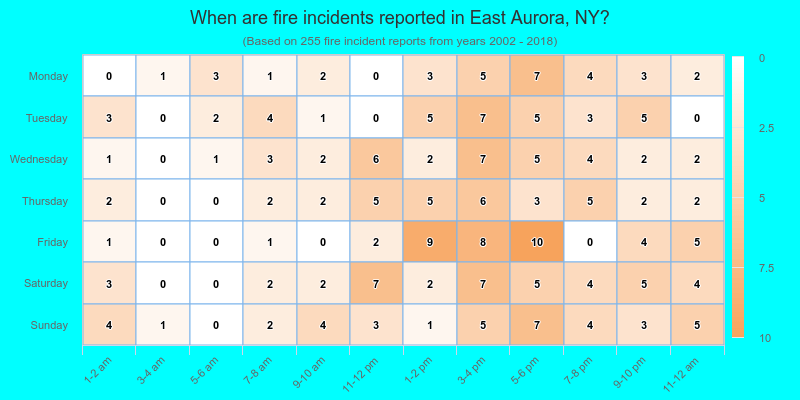
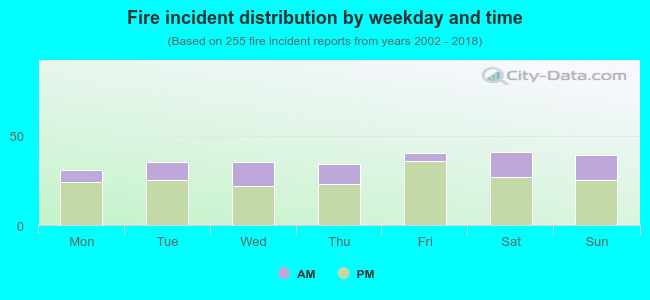 28.6% incidents where reported in the morning and 71.4% in the evening. The most fires (16.1%) took place on Saturday, and the least (12.2%) on Monday.
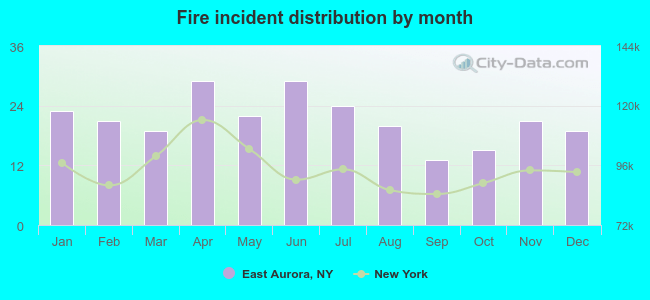 According to the 255 incident reports from years 2002 - 2018 most fires (11.4%) took place during April, and the least (5.1%) in September.
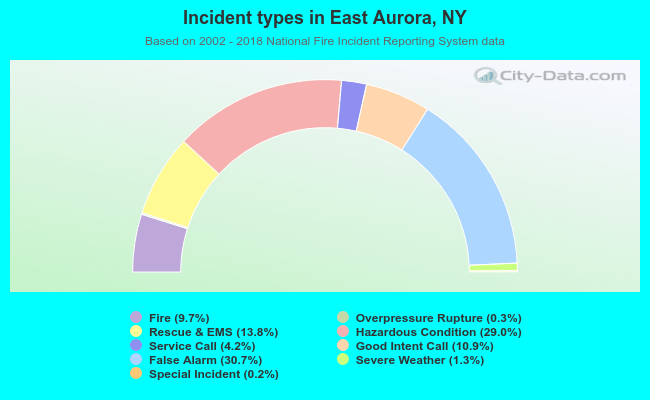 Out of all 2,623 cases reported during the years 2002 - 2018, the most belonged to the categories: False Alarm (30.7%), Hazardous Condition (29.0%), and Rescue & EMS (13.8%).
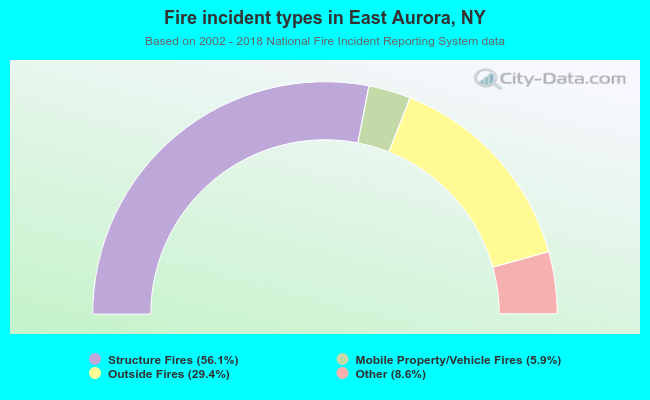 When looking into fire subcategories, the most incidents belonged to: Structure Fires (56.1%), and Outside Fires (29.4%).