Waterboro: Fire Incidents, Maine (ME)
Where are fire incidents reported in Waterboro, ME
Something went wrong! Please refresh the page.
|
| |||||||||||||||||||||||||||||||||||||||||||||||||||||||||||||||||||||||||||||||||||||||||||||||||||||||||||||
2003 - 2018 National Fire Incident Reporting System (NFIRS) incidents
- Incident types reported to NFIRS in Waterboro, ME
- 1,96958.6%Rescue & EMS
- 40712.1%Service Call
- 2918.7%Fire
- 2718.1%Hazardous Condition
- 1705.1%Good Intent Call
- 1243.7%False Alarm
- 1133.4%Severe Weather
- 90.3%Special Incident
- 70.2%Overpressure Rupture
- Fire incident types reported to NFIRS in Waterboro, ME
- 16255.7%Structure Fires
- 8328.5%Outside Fires
- 4214.4%Mobile Property/Vehicle Fires
- 41.4%Other
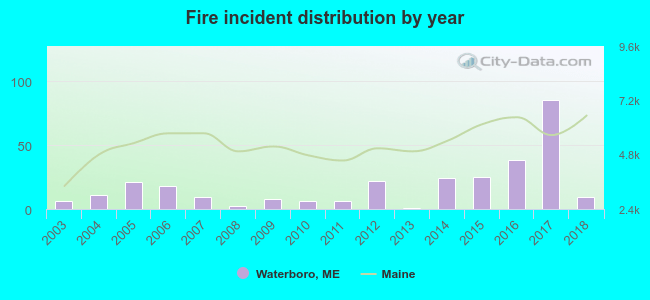 Based on the data from the years 2003 - 2018 the average number of fire incidents per year is 18. The highest number of reported fires - 85 took place in 2017, and the least - 1 in 2013. The data has an increasing trend.
The average number of yearly fire incidents per 10k residents in Waterboro, ME compared to nearest cities:
(Note: Based on data for the last 3 years, including only cities with population 5,000 and above)
| Waterboro: | 57.2 |
| Buxton: | 31.5 |
| Sanford: | 16.6 |
| Standish: | 22.3 |
| Gorham: | 90.1 |
| Saco: | 41.2 |
| Biddeford: | 59.5 |
| Lebanon: | 48.1 |
| Kennebunk: | 88.9 |
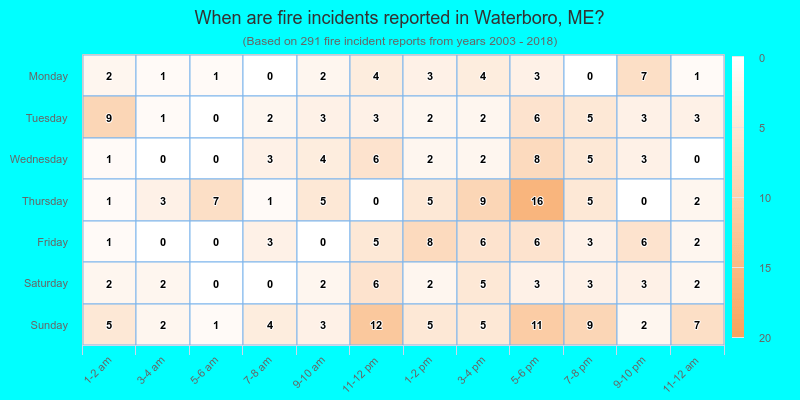
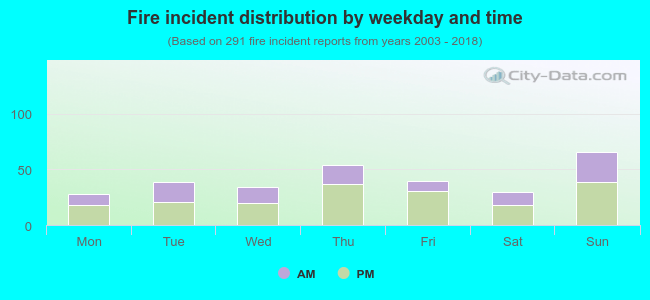 36.8% incidents where reported in the morning and 63.2% in the evening. The most fires (22.7%) took place on Sunday, and the least (9.6%) on Monday.
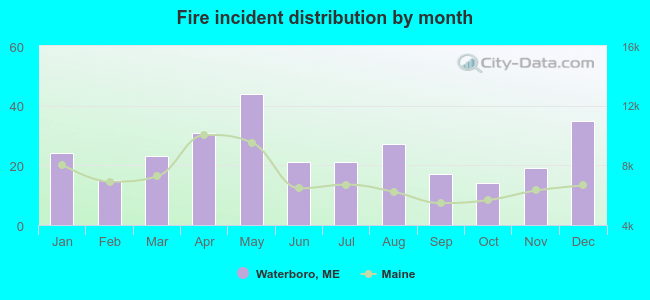 Based on the 291 fire incidents from years 2003 - 2018 most fires (15.1%) took place during May, and the least (4.8%) in October.
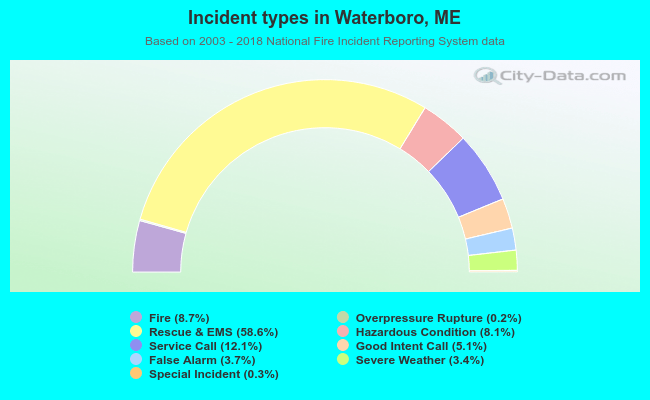 Out of all 3,361 cases reported during the years 2003 - 2018, the most belonged to the categories: Rescue & EMS (58.6%), Service Call (12.1%), and Fire (8.7%).
 When looking into fire subcategories, the most incidents belonged to: Structure Fires (55.7%), and Outside Fires (28.5%).