Lebanon: Fire Incidents, Maine (ME)
Where are fire incidents reported in Lebanon, ME
Something went wrong! Please refresh the page.
|
| |||||||||||||||||||||||||||||||||||||||||||||||||||||||||||||||||||||||||||||||||||||||||||||||||||||||||||||
2003 - 2018 National Fire Incident Reporting System (NFIRS) incidents
- Incident types reported to NFIRS in Lebanon, ME
- 71033.9%Rescue & EMS
- 69533.2%Hazardous Condition
- 28513.6%Fire
- 26012.4%Service Call
- 703.3%Good Intent Call
- 673.2%False Alarm
- 40.2%Severe Weather
- 40.2%Special Incident
- Fire incident types reported to NFIRS in Lebanon, ME
- 17661.8%Structure Fires
- 6723.5%Outside Fires
- 3311.6%Mobile Property/Vehicle Fires
- 93.2%Other
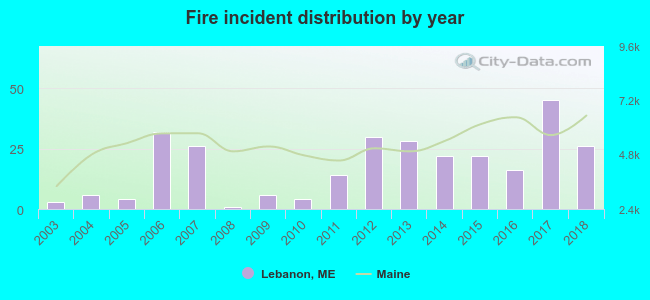 Based on the data from the years 2003 - 2018 the average number of fire incidents per year is 18. The highest number of reported fires - 45 took place in 2017, and the least - 1 in 2008. The data has an increasing trend.
The average number of yearly fire incidents per 10k residents in Lebanon, ME compared to nearest cities:
(Note: Based on data for the last 3 years, including only cities with population 5,000 and above)
| Lebanon: | 48.1 |
| Sanford: | 16.6 |
| South Berwick: | 30.9 |
| Wells: | 48.3 |
| Waterboro: | 57.2 |
| Kennebunk: | 88.9 |
| Eliot: | 18.8 |
| York: | 39.1 |
| Biddeford: | 59.5 |
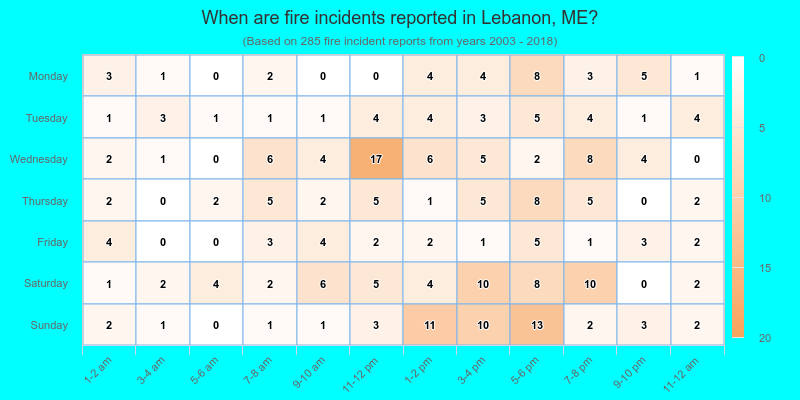
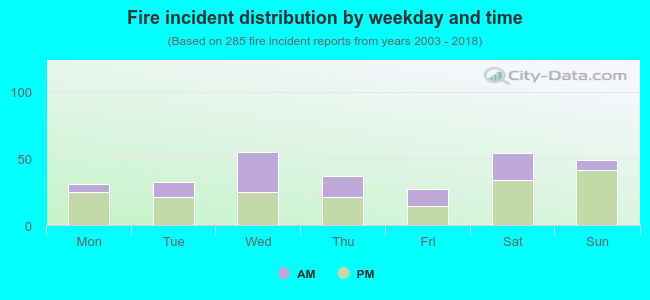 36.5% incidents where reported in the morning and 63.5% in the evening. The most fires (19.3%) took place on Wednesday, and the least (9.5%) on Friday.
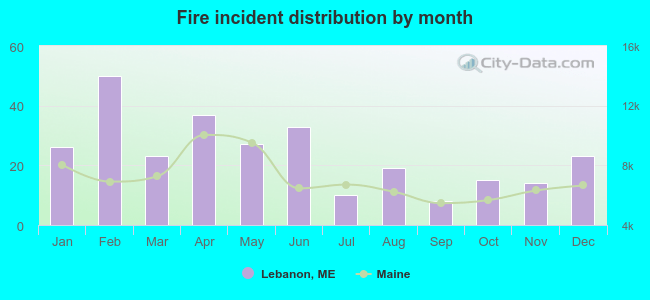 According to the 285 fire incident reports from years 2003 - 2018 most fires (17.5%) took place during February, and the least (2.8%) in September.
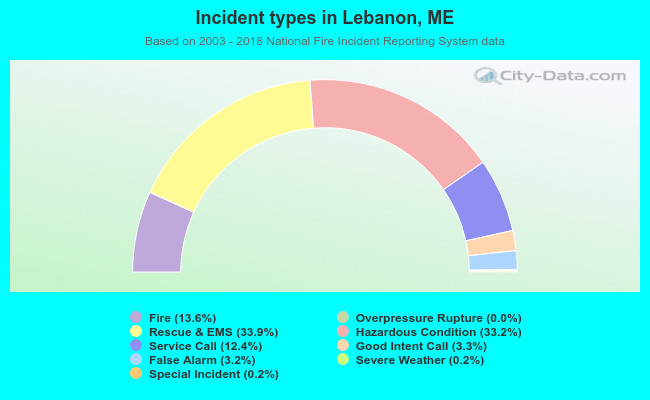 Out of all 2,096 cases reported during the years 2003 - 2018, the most belonged to the categories: Rescue & EMS (33.9%), Hazardous Condition (33.2%), and Fire (13.6%).
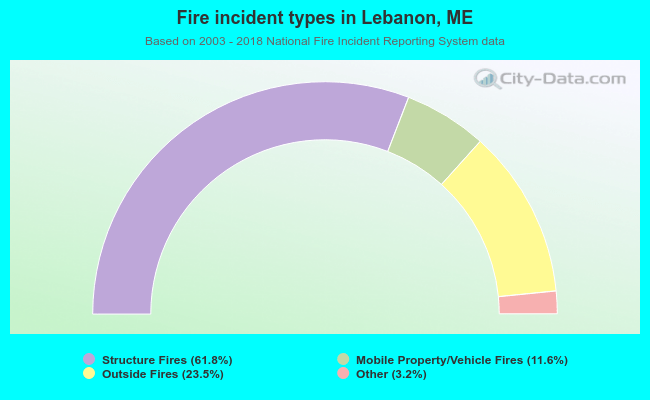 When looking into fire subcategories, the most reports belonged to: Structure Fires (61.8%), and Outside Fires (23.5%).