Sanford: Fire Incidents, Maine (ME)
Where are fire incidents reported in Sanford, ME
Something went wrong! Please refresh the page.
| Fire incidents reported | |
|---|---|
| Sreet name | Count |
| MAIN ST | 570 |
| NEW DAM RD | 66 |
| RIVER ST | 60 |
| SCHOOL ST | 52 |
| HIGH ST | 50 |
| LEBANON ST | 48 |
| TWOMBLEY RD | 42 |
| EMERY ST | 40 |
| WASHINGTON ST | 38 |
| COUNTRY CLUB RD | 32 |
| JUNE ST | 32 |
| NORTH AVE | 30 |
| ALFRED RD | 26 |
| BROOK ST | 26 |
| PIONEER AVE | 24 |
| AIRPORT RD | 22 |
| OXFORD ST | 22 |
| WINTER ST | 22 |
| JULY ST | 20 |
| ISLAND AVE | 18 |
| KIMBALL ST | 18 |
| MANOR CIR | 18 |
| RUSHTON ST | 18 |
| SAM ALLEN RD | 18 |
| WM OSCAR EMERY DR | 18 |
| RIVERSIDE AVE | 16 |
| COTTAGE ST | 14 |
| GRAMMAR RD | 14 |
| MAIN ST | 14 |
| MILTON AVE | 14 |
2003 - 2018 National Fire Incident Reporting System (NFIRS) incidents
- Incident types reported to NFIRS in Sanford, ME
- 3,58140.0%Rescue & EMS
- 2,31025.8%Hazardous Condition
- 1,38615.5%Fire
- 7518.4%Service Call
- 5596.2%Good Intent Call
- 3533.9%False Alarm
- 110.1%Overpressure Rupture
- Fire incident types reported to NFIRS in Sanford, ME
- 63445.7%Structure Fires
- 51136.9%Outside Fires
- 15311.0%Mobile Property/Vehicle Fires
- 886.3%Other
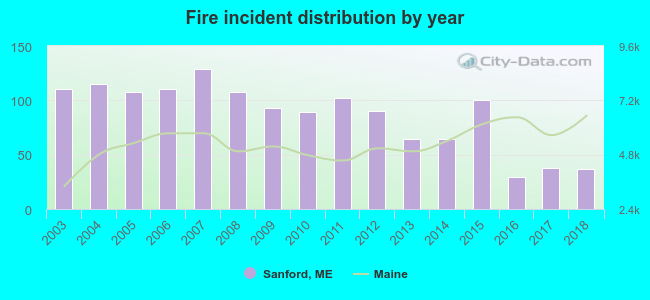 Based on the data from the years 2003 - 2018 the average number of fire incidents per year is 87. The highest number of reported fire incidents - 129 took place in 2007, and the least - 29 in 2016. The data has a dropping trend.
The average number of yearly fire incidents per 10k residents in Sanford, ME compared to nearest cities:
(Note: Based on data for the last 3 years, including only cities with population 5,000 and above)
| Sanford: | 16.6 |
| Lebanon: | 48.1 |
| Wells: | 48.3 |
| Waterboro: | 57.2 |
| Kennebunk: | 88.9 |
| South Berwick: | 30.9 |
| Biddeford: | 59.5 |
| Saco: | 41.2 |
| Buxton: | 31.5 |
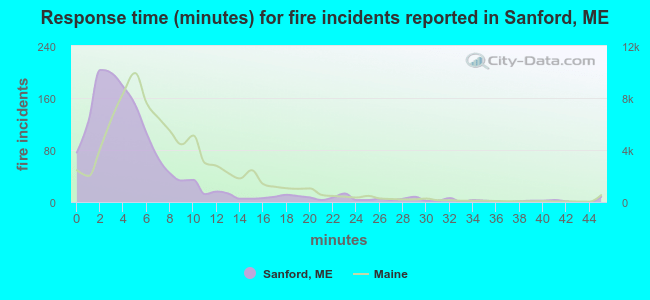 The median response time based on all reported fire incidents is 4 minutes. This is lower than the state median value.
The median response time in Sanford, ME compared to nearest cities:
(Note: Based on data for all years, including only cities with at least 500 fire incidents)
| Sanford: | 4 minutes |
| Wells: | 7 minutes |
| Kennebunk: | 6 minutes |
| Biddeford: | 7 minutes |
| Saco: | 7 minutes |
| Gorham: | 7 minutes |
| Scarborough: | 7 minutes |
| Westbrook: | 5 minutes |
| South Portland: | 6 minutes |
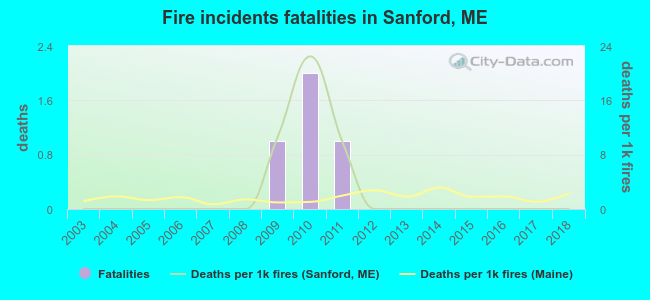 Based on the reports from the years 2003 - 2018 the average number of fire-related fatalities per year is 0. The highest number of reported deaths - 2 took place in 2010, and the lowest - 0 in 2003. The data has a constant trend.
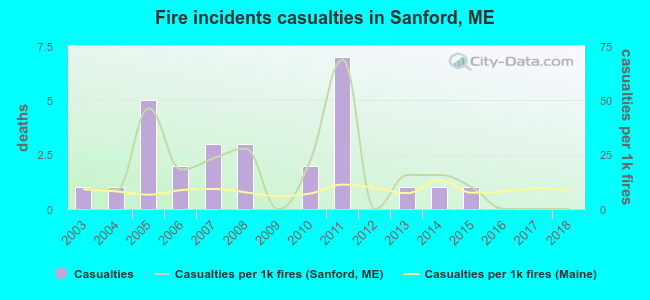 Based on the data from the years 2003 - 2018 the average number of fire-related yearly casualties is 2. The highest number of injuries - 7 took place in 2011, and the lowest - 0 in 2009. The data has a dropping trend.
The average number of injuries per 1,000 fire incidents is 17. This indicator was the highest - 69 in 2011, and the lowest 0 in 2009. The trend for injuries per 1,000 fires is declining. Compared to the state value the number of injuries per 1,000 fires is much higher.
Based on the data from the years 2003 - 2018 the average number of fire-related yearly casualties is 2. The highest number of injuries - 7 took place in 2011, and the lowest - 0 in 2009. The data has a dropping trend.
The average number of injuries per 1,000 fire incidents is 17. This indicator was the highest - 69 in 2011, and the lowest 0 in 2009. The trend for injuries per 1,000 fires is declining. Compared to the state value the number of injuries per 1,000 fires is much higher.Casualties per 1,000 incidents in Sanford, ME compared to nearest cities:
(Note: Based on data for all years, including only cities with at least 500 fire incidents)
| Sanford: | 19.5 |
| Wells: | 14.2 |
| Kennebunk: | 8.6 |
| Biddeford: | 23.1 |
| Saco: | 17.0 |
| Gorham: | 10.8 |
| Scarborough: | 6.5 |
| Westbrook: | 35.2 |
| South Portland: | 2.3 |
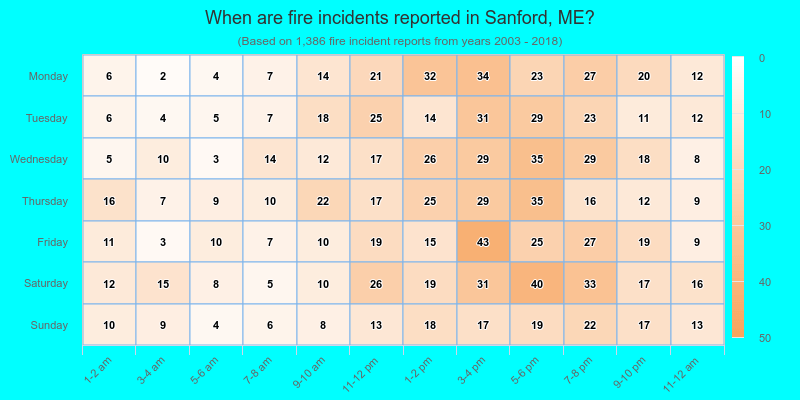
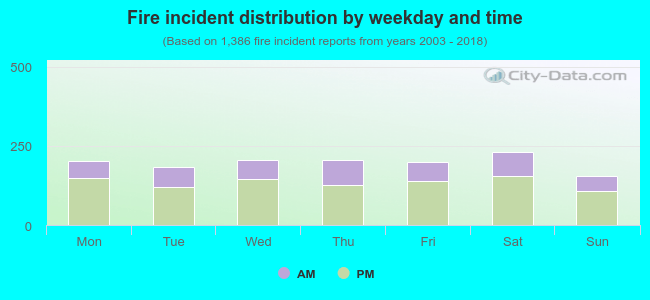 32.3% incidents where reported in the morning and 67.7% in the evening. The most fires (16.7%) took place on Saturday, and the least (11.3%) on Sunday.
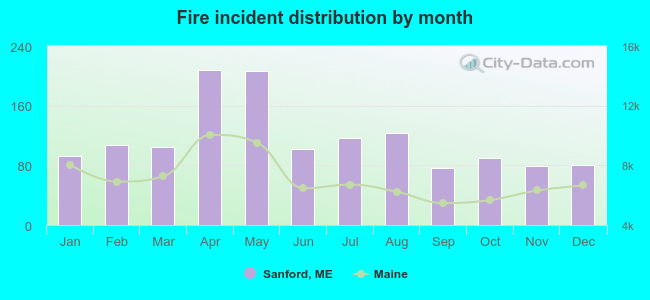 Based on the 1,386 reports from years 2003 - 2018 most fires (15.0%) took place during April, and the least (5.5%) in September.
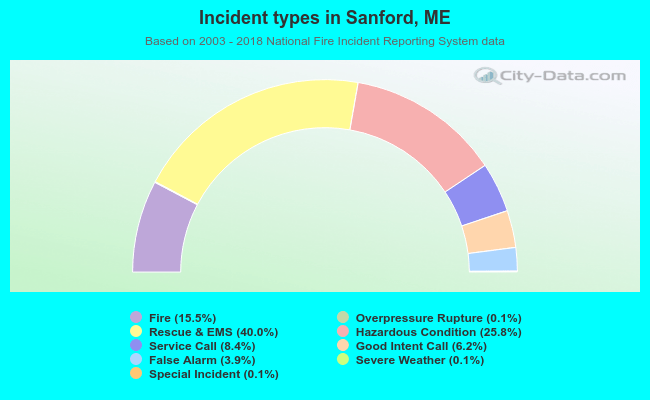 Out of all 8,963 cases reported during the years 2003 - 2018, the most belonged to the categories: Rescue & EMS (40.0%), Hazardous Condition (25.8%), and Fire (15.5%).
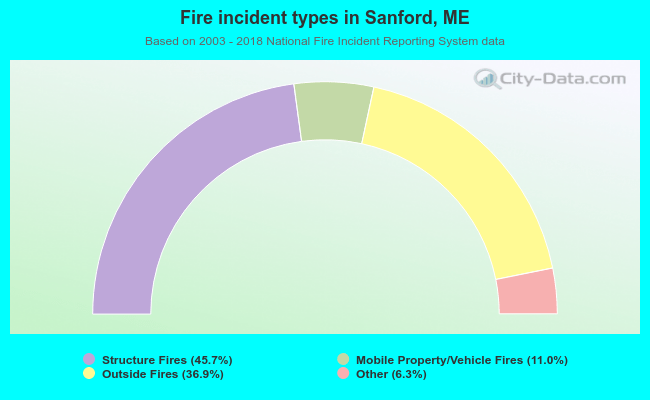 When looking into fire subcategories, the most reports belonged to: Structure Fires (45.7%), and Outside Fires (36.9%).