Westbrook: Fire Incidents, Maine (ME)
Where are fire incidents reported in Westbrook, ME
Something went wrong! Please refresh the page.
| Fire incidents reported | |
|---|---|
| Sreet name | Count |
| MAIN ST | 450 |
| LONGFELLOW ST | 128 |
| LIZA HARMON DR | 100 |
| BRIDGTON RD | 94 |
| BRIDGE ST | 90 |
| CUMBERLAND ST | 86 |
| SACO ST | 86 |
| BROWN ST | 72 |
| WAYSIDE DR | 60 |
| SPRING ST | 50 |
| STROUDWATER ST | 38 |
| EAST BRIDGE ST | 36 |
| LINCOLN ST | 34 |
| COUNTY RD | 32 |
| NORTH ST | 28 |
| WALKER ST | 28 |
| BRACKETT ST | 26 |
| CENTRAL ST | 24 |
| FOREST ST | 24 |
| LARRABEE RD | 24 |
| PRIDE ST | 24 |
| HANNAFORD DR | 22 |
| ROCHESTER ST | 22 |
| KNIGHT ST | 20 |
| MECHANIC ST | 20 |
| METHODIST RD | 20 |
| SEAVEY ST | 20 |
| TERI CIR | 20 |
| BROOK ST | 18 |
| THOMAS DR | 18 |
2003 - 2018 National Fire Incident Reporting System (NFIRS) incidents
- Incident types reported to NFIRS in Westbrook, ME
- 12,95666.7%Rescue & EMS
- 1,8249.4%Hazardous Condition
- 1,3517.0%Service Call
- 1,2516.4%Fire
- 1,2486.4%False Alarm
- 7653.9%Good Intent Call
- 290.1%Special Incident
- Fire incident types reported to NFIRS in Westbrook, ME
- 71557.2%Structure Fires
- 37329.8%Outside Fires
- 1149.1%Mobile Property/Vehicle Fires
- 493.9%Other
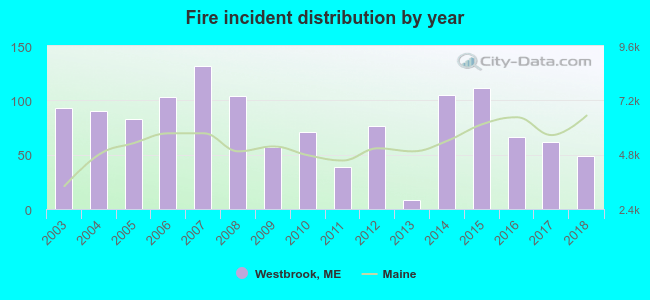 Based on the data from the years 2003 - 2018 the average number of fires per year is 78. The highest number of fire incidents - 132 took place in 2007, and the least - 8 in 2013. The data has a declining trend.
The average number of yearly fire incidents per 10k residents in Westbrook, ME compared to nearest cities:
(Note: Based on data for the last 3 years, including only cities with population 5,000 and above)
| Westbrook: | 33.0 |
| Gorham: | 90.1 |
| Portland: | 31.0 |
| South Portland: | 37.0 |
| Falmouth: | 24.7 |
| Cape Elizabeth: | 25.5 |
| Windham: | 44.1 |
| Cumberland: | 43.0 |
| Buxton: | 31.5 |
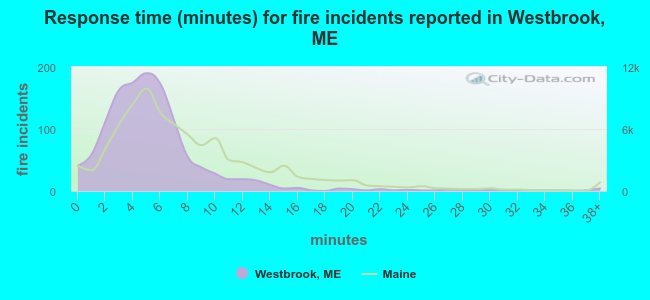 The median response time based on all reported fire incidents is 5 minutes. This is lower compared to the state median value.
The median response time in Westbrook, ME compared to nearest cities:
(Note: Based on data for all years, including only cities with at least 500 fire incidents)
| Westbrook: | 5 minutes |
| Gorham: | 7 minutes |
| Portland: | 4 minutes |
| South Portland: | 6 minutes |
| Scarborough: | 7 minutes |
| Windham: | 6 minutes |
| Saco: | 7 minutes |
| Biddeford: | 7 minutes |
| Freeport: | 8 minutes |
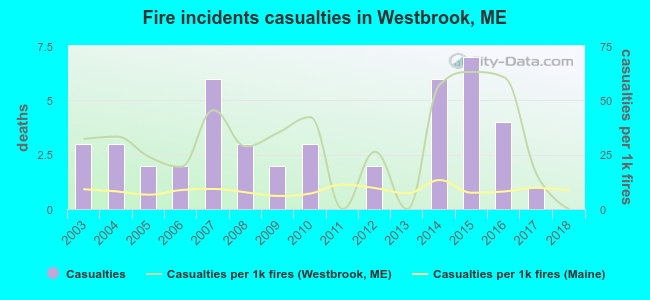 According to the data from the years 2003 - 2018 the average number of fire-related yearly casualties is 3. The highest number of casualties - 7 took place in 2015, and the lowest - 0 in 2011. The data has a declining trend.
The average number of casualties per 1,000 fire incidents is 30. This indicator was the highest - 63 in 2015, and the lowest 0 in 2011. The trend for injuries per 1,000 incidents is decreasing. Compared to the Maine value the number of casualties per 1,000 incidents is much higher.
According to the data from the years 2003 - 2018 the average number of fire-related yearly casualties is 3. The highest number of casualties - 7 took place in 2015, and the lowest - 0 in 2011. The data has a declining trend.
The average number of casualties per 1,000 fire incidents is 30. This indicator was the highest - 63 in 2015, and the lowest 0 in 2011. The trend for injuries per 1,000 incidents is decreasing. Compared to the Maine value the number of casualties per 1,000 incidents is much higher.Casualties per 1,000 incidents in Westbrook, ME compared to nearest cities:
(Note: Based on data for all years, including only cities with at least 500 fire incidents)
| Westbrook: | 35.2 |
| Gorham: | 10.8 |
| Portland: | 5.2 |
| South Portland: | 2.3 |
| Scarborough: | 6.5 |
| Windham: | 21.2 |
| Saco: | 17.0 |
| Biddeford: | 23.1 |
| Freeport: | 4.7 |
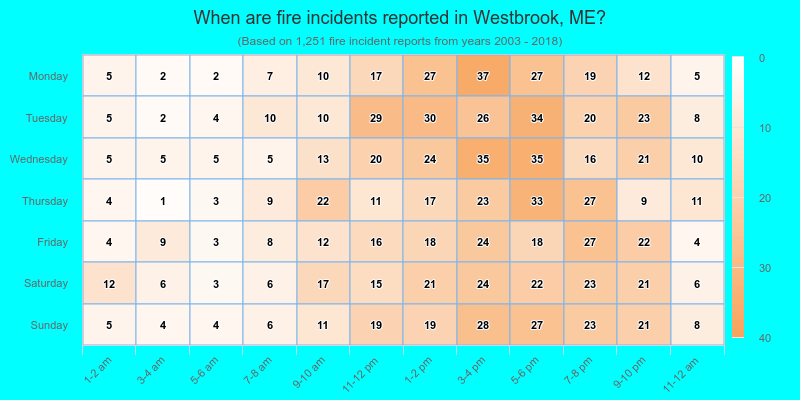
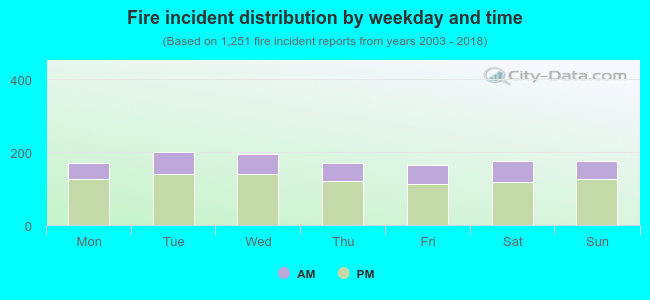 29.3% incidents where reported in the morning and 70.7% in the evening. The most fires (16.1%) took place on Tuesday, and the least (13.2%) on Friday.
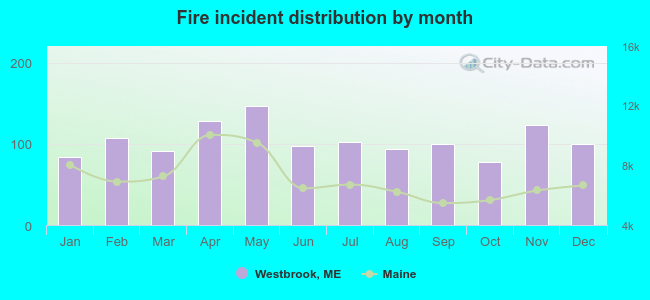 According to the 1,251 reports from years 2003 - 2018 most fires (11.8%) took place during May, and the least (6.2%) in October.
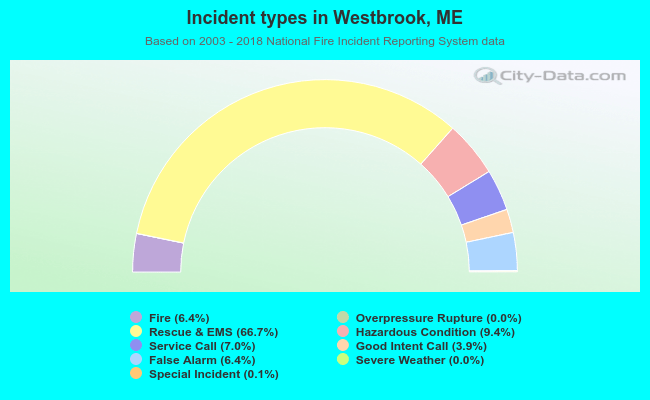 Out of all 19,432 cases reported during the years 2003 - 2018, the most belonged to the categories: Rescue & EMS (66.7%), Hazardous Condition (9.4%), and Service Call (7.0%).
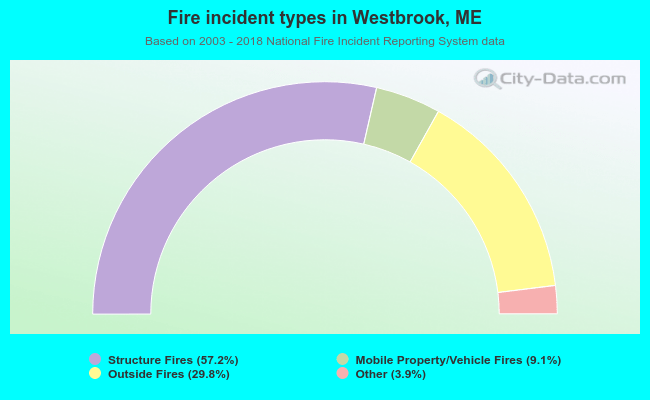 When looking into fire subcategories, the most incidents belonged to: Structure Fires (57.2%), and Outside Fires (29.8%).