Cape Elizabeth: Fire Incidents, Maine (ME)
Where are fire incidents reported in Cape Elizabeth, ME
Something went wrong! Please refresh the page.
|
| |||||||||||||||||||||||||||||||||||||||||||||||||||||||||||||||||||||||||||||||||||||||||||||||||||||||||||||
2005 - 2018 National Fire Incident Reporting System (NFIRS) incidents
- Incident types reported to NFIRS in Cape Elizabeth, ME
- 1,96663.2%Rescue & EMS
- 3039.7%Hazardous Condition
- 2869.2%False Alarm
- 2568.2%Service Call
- 1705.5%Good Intent Call
- 1254.0%Fire
- 40.1%Special Incident
- Fire incident types reported to NFIRS in Cape Elizabeth, ME
- 8366.4%Structure Fires
- 2923.2%Outside Fires
- 108.0%Mobile Property/Vehicle Fires
- 32.4%Other
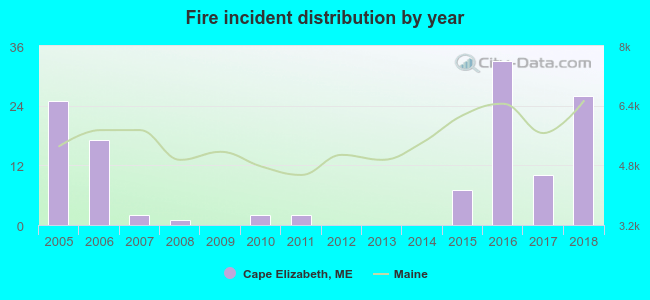 Based on the data from the years 2005 - 2018 the average number of fire incidents per year is 9. The highest number of reported fire incidents - 33 took place in 2016, and the least - 0 in 2009. The data has a rising trend.
The average number of yearly fire incidents per 10k residents in Cape Elizabeth, ME compared to nearest cities:
(Note: Based on data for the last 3 years, including only cities with population 5,000 and above)
| Cape Elizabeth: | 25.5 |
| South Portland: | 37.0 |
| Portland: | 31.0 |
| Westbrook: | 33.0 |
| Falmouth: | 24.7 |
| Old Orchard Beach: | 26.7 |
| Gorham: | 90.1 |
| Cumberland: | 43.0 |
| Saco: | 41.2 |
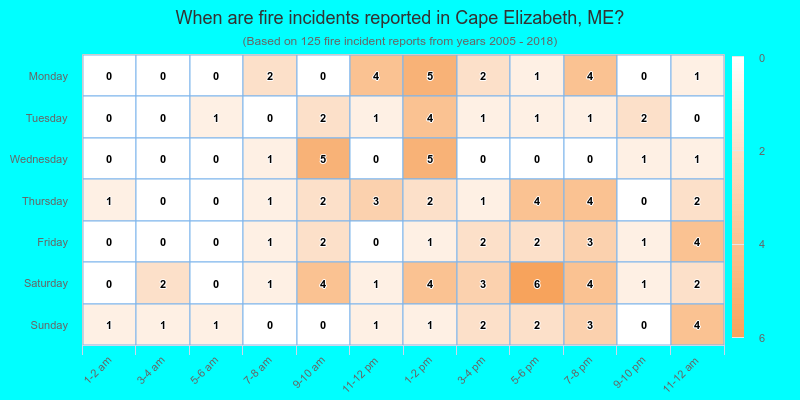
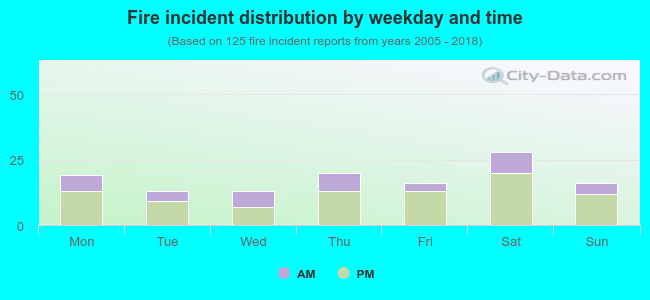 30.4% incidents where reported in the morning and 69.6% in the evening. The most fires (22.4%) took place on Saturday, and the least (10.4%) on Tuesday.
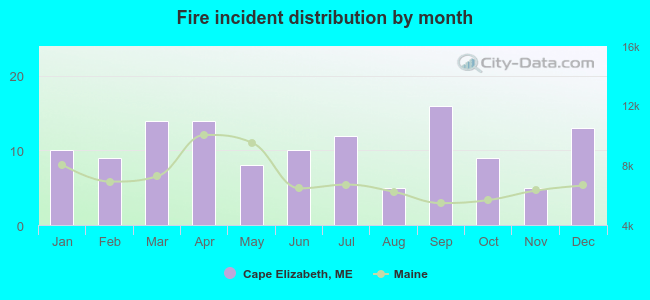 According to the 125 fires from years 2005 - 2018 most fires (12.8%) took place during September, and the least (4.0%) in August.
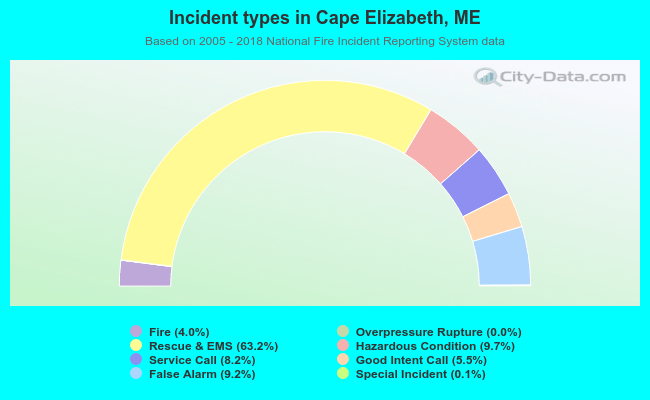 Out of all 3,111 cases reported during the years 2005 - 2018, the most belonged to the categories: Rescue & EMS (63.2%), Hazardous Condition (9.7%), and False Alarm (9.2%).
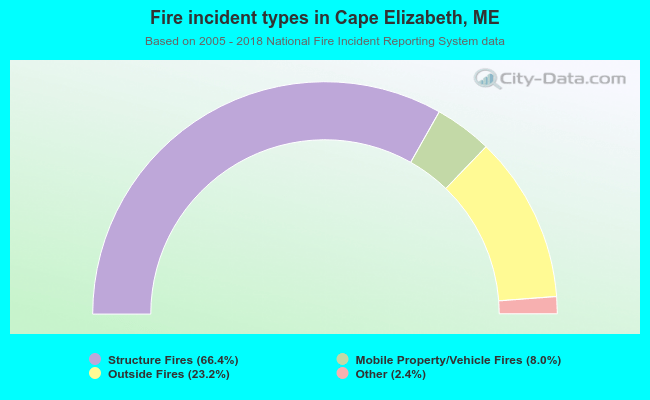 When looking into fire subcategories, the most incidents belonged to: Structure Fires (66.4%), and Outside Fires (23.2%).