Portland: Fire Incidents, Maine (ME)
Where are fire incidents reported in Portland, ME
Something went wrong! Please refresh the page.
| Fire incidents reported | |
|---|---|
| Sreet name | Count |
| CONGRESS ST | 932 |
| FOREST AVE | 588 |
| CUMBERLAND AVE | 534 |
| BRIGHTON AVE | 394 |
| STATE ST | 324 |
| GRANT ST | 262 |
| DANFORTH ST | 250 |
| ALLEN AVE | 248 |
| WASHINGTON AVE | 244 |
| PARK AVE | 208 |
| MARGINAL WAY | 196 |
| CHESTNUT ST | 188 |
| COMMERCIAL ST | 184 |
| ST JOHN ST | 184 |
| HIGH ST | 180 |
| BRAMHALL ST | 176 |
| RIVERSIDE ST | 164 |
| AUBURN ST | 154 |
| OCEAN AVE | 128 |
| BRACKETT ST | 116 |
| STEVENS AVE | 116 |
| FORE ST | 96 |
| WEST COMMERCIAL ST | 92 |
| FREDERIC ST | 90 |
| NORTH ST | 88 |
| WESTBROOK ST | 88 |
| WARREN AVE | 86 |
| DEERING AVE | 84 |
| INTERSTATE 295 | 84 |
| SHERMAN ST | 84 |
2004 - 2018 National Fire Incident Reporting System (NFIRS) incidents
- Incident types reported to NFIRS in Portland, ME
- 35,76160.2%Rescue & EMS
- 7,63612.9%Hazardous Condition
- 5,94510.0%Fire
- 5,0108.4%False Alarm
- 2,4964.2%Good Intent Call
- 2,1793.7%Service Call
- 2300.4%Overpressure Rupture
- 620.1%Special Incident
- Fire incident types reported to NFIRS in Portland, ME
- 3,02450.9%Structure Fires
- 2,35339.6%Outside Fires
- 4187.0%Mobile Property/Vehicle Fires
- 1502.5%Other
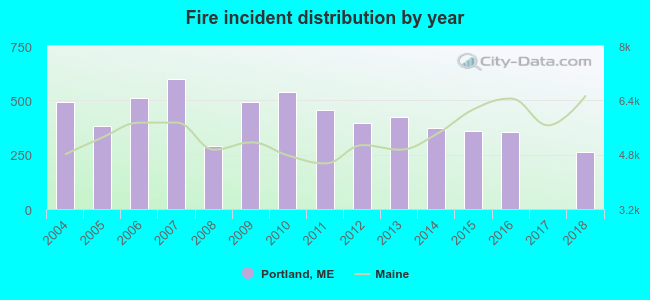 According to the data from the years 2004 - 2018 the average number of fire incidents per year is 396. The highest number of fires - 599 took place in 2007, and the least - 2 in 2017. The data has a decreasing trend.
The average number of yearly fire incidents per 10k residents in Portland, ME compared to nearest cities:
(Note: Based on data for the last 3 years, including only cities with population 5,000 and above)
| Portland: | 31.0 |
| South Portland: | 37.0 |
| Westbrook: | 33.0 |
| Cape Elizabeth: | 25.5 |
| Falmouth: | 24.7 |
| Cumberland: | 43.0 |
| Gorham: | 90.1 |
| Yarmouth: | 36.3 |
| Old Orchard Beach: | 26.7 |
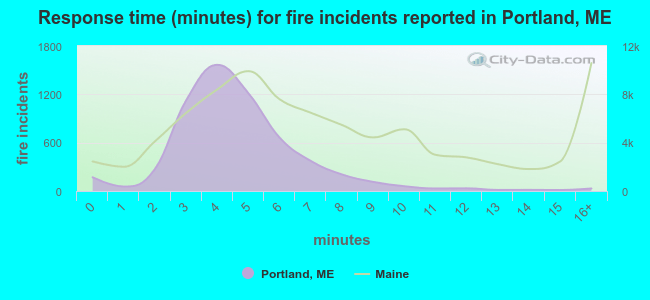 The median response time based on all reported fire incidents is 4 minutes. This is lower than the state median value.
The median response time in Portland, ME compared to nearest cities:
(Note: Based on data for all years, including only cities with at least 500 fire incidents)
| Portland: | 4 minutes |
| South Portland: | 6 minutes |
| Westbrook: | 5 minutes |
| Scarborough: | 7 minutes |
| Gorham: | 7 minutes |
| Windham: | 6 minutes |
| Saco: | 7 minutes |
| Freeport: | 8 minutes |
| Biddeford: | 7 minutes |
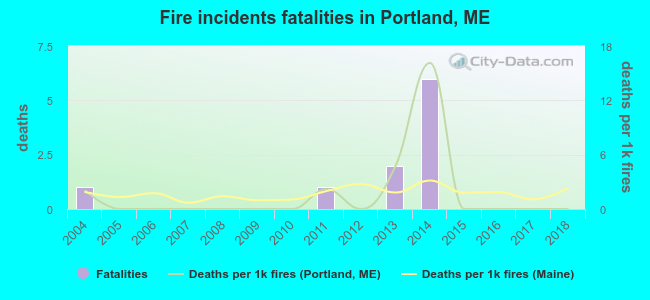 According to the reports from the years 2004 - 2018 the average number of fire-related yearly deaths is 1. The highest number of reported deaths - 6 took place in 2014, and the lowest - 0 in 2005. The data has a dropping trend.
The average number of fatalities per 1,000 fires is 2. This indicator was the highest - 16 in 2014, and the lowest 0 in 2005. The trend for fatalities per 1,000 fire incidents is declining. Compared to the state value the number of deaths per 1,000 fires is similar.
According to the reports from the years 2004 - 2018 the average number of fire-related yearly deaths is 1. The highest number of reported deaths - 6 took place in 2014, and the lowest - 0 in 2005. The data has a dropping trend.
The average number of fatalities per 1,000 fires is 2. This indicator was the highest - 16 in 2014, and the lowest 0 in 2005. The trend for fatalities per 1,000 fire incidents is declining. Compared to the state value the number of deaths per 1,000 fires is similar.Deaths per 1,000 incidents in Portland, ME compared to nearest cities:
(Note: Based on data for all years, including only cities with at least 2,500 fire incidents)
| Portland: | 1.7 |
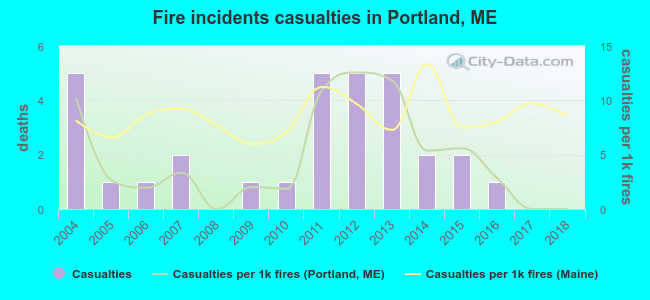 According to the reports from the years 2004 - 2018 the average number of fire-related yearly casualties is 2. The highest number of reported casualties - 5 took place in 2004, and the lowest - 0 in 2008. The data has a decreasing trend.
The average number of injuries per 1,000 fire incidents is 5. This indicator was the highest - 13 in 2012, and the lowest 0 in 2008. The trend for casualties per 1,000 fire incidents is dropping. Compared to the Maine value the number of injuries per 1,000 fire incidents is lower.
According to the reports from the years 2004 - 2018 the average number of fire-related yearly casualties is 2. The highest number of reported casualties - 5 took place in 2004, and the lowest - 0 in 2008. The data has a decreasing trend.
The average number of injuries per 1,000 fire incidents is 5. This indicator was the highest - 13 in 2012, and the lowest 0 in 2008. The trend for casualties per 1,000 fire incidents is dropping. Compared to the Maine value the number of injuries per 1,000 fire incidents is lower.Casualties per 1,000 incidents in Portland, ME compared to nearest cities:
(Note: Based on data for all years, including only cities with at least 500 fire incidents)
| Portland: | 5.2 |
| South Portland: | 2.3 |
| Westbrook: | 35.2 |
| Scarborough: | 6.5 |
| Gorham: | 10.8 |
| Windham: | 21.2 |
| Saco: | 17.0 |
| Freeport: | 4.7 |
| Biddeford: | 23.1 |
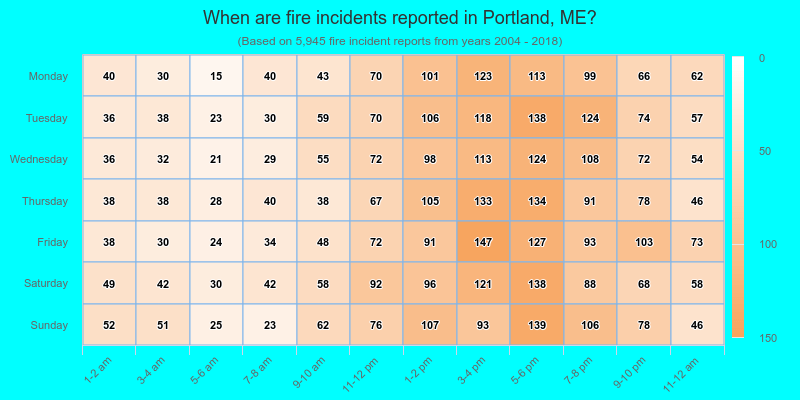
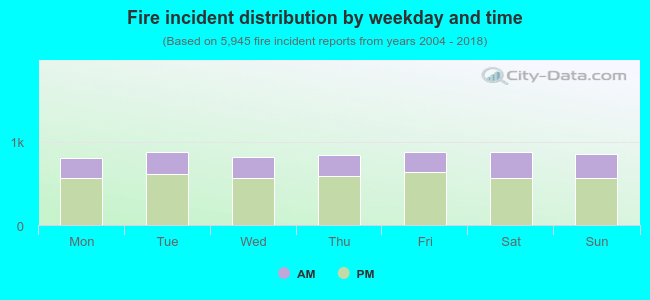 30.9% incidents where reported in the morning and 69.1% in the evening. The most fires (14.8%) took place on Saturday, and the least (13.5%) on Monday.
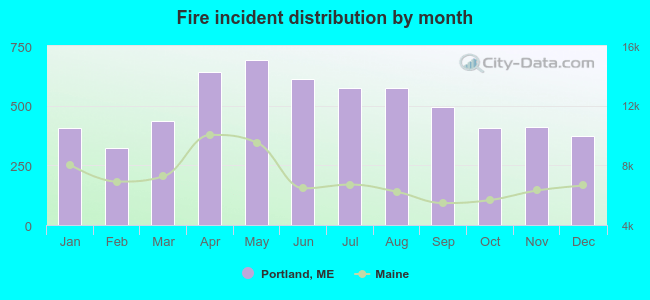 Based on the 5,945 fire incidents from years 2004 - 2018 most fires (11.6%) took place during May, and the least (5.4%) in February.
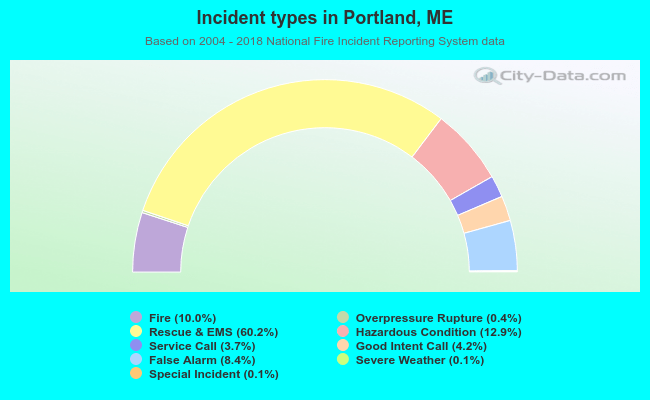 Out of all 59,364 cases reported during the years 2004 - 2018, the most belonged to the categories: Rescue & EMS (60.2%), Hazardous Condition (12.9%), and Fire (10.0%).
 When looking into fire subcategories, the most reports belonged to: Structure Fires (50.9%), and Outside Fires (39.6%).