Yarmouth: Fire Incidents, Maine (ME)
Where are fire incidents reported in Yarmouth, ME
Something went wrong! Please refresh the page.
|
| |||||||||||||||||||||||||||||||||||||||||||||||||||||||||||||||||||||||||||||||||||||||||||||||||||||||||||||
2003 - 2018 National Fire Incident Reporting System (NFIRS) incidents
- Incident types reported to NFIRS in Yarmouth, ME
- 4,57669.1%Rescue & EMS
- 5368.1%Service Call
- 4847.3%False Alarm
- 4216.4%Hazardous Condition
- 3976.0%Good Intent Call
- 1842.8%Fire
- 140.2%Special Incident
- 90.1%Severe Weather
- Fire incident types reported to NFIRS in Yarmouth, ME
- 9853.3%Structure Fires
- 5328.8%Outside Fires
- 2614.1%Mobile Property/Vehicle Fires
- 73.8%Other
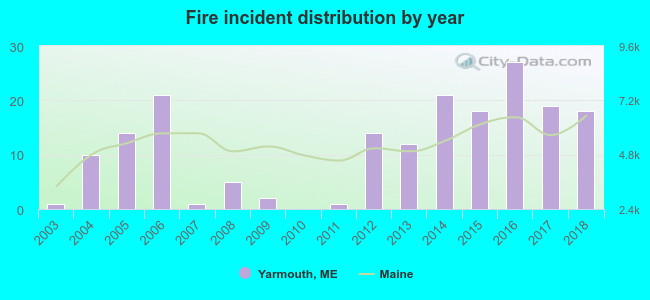 According to the data from the years 2003 - 2018 the average number of fire incidents per year is 12. The highest number of fire incidents - 27 took place in 2016, and the least - 0 in 2010. The data has a growing trend.
The average number of yearly fire incidents per 10k residents in Yarmouth, ME compared to nearest cities:
(Note: Based on data for the last 3 years, including only cities with population 5,000 and above)
| Yarmouth: | 36.3 |
| Cumberland: | 43.0 |
| Falmouth: | 24.7 |
| Gray: | 54.5 |
| Portland: | 31.0 |
| Windham: | 44.1 |
| Westbrook: | 33.0 |
| New Gloucester: | 31.9 |
| South Portland: | 37.0 |
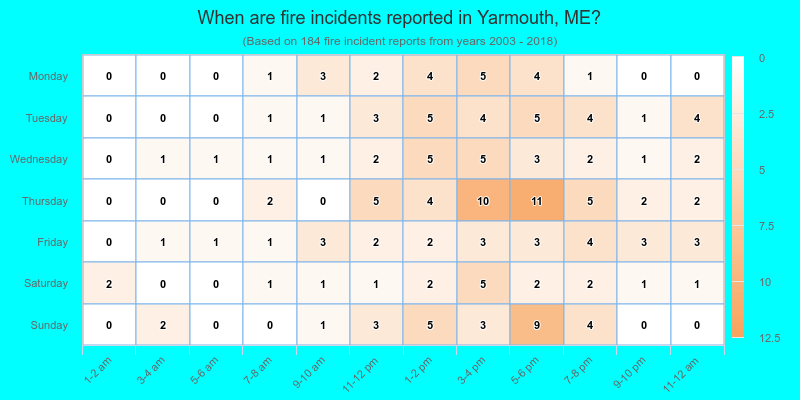
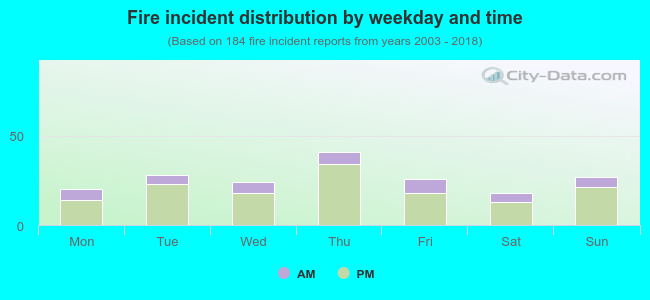 23.4% incidents where reported in the morning and 76.6% in the evening. The most fires (22.3%) took place on Thursday, and the least (9.8%) on Saturday.
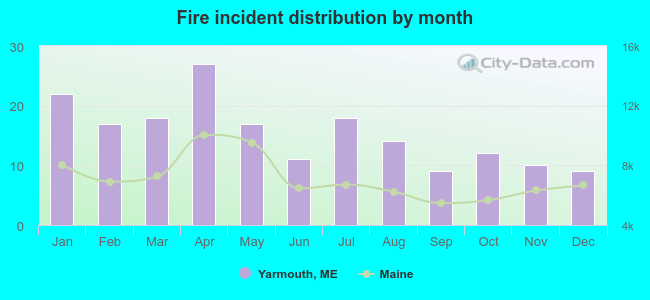 Based on the 184 reports from years 2003 - 2018 most fires (14.7%) took place during April, and the least (4.9%) in September.
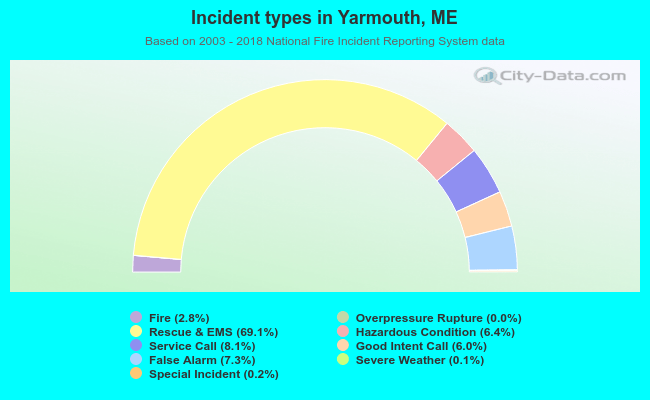 Out of all 6,622 cases reported during the years 2003 - 2018, the most belonged to the categories: Rescue & EMS (69.1%), Service Call (8.1%), and False Alarm (7.3%).
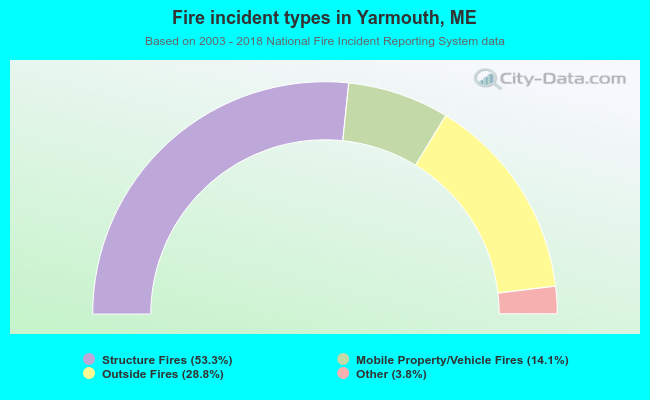 When looking into fire subcategories, the most incidents belonged to: Structure Fires (53.3%), and Outside Fires (28.8%).