Biddeford: Fire Incidents, Maine (ME)
Where are fire incidents reported in Biddeford, ME
Something went wrong! Please refresh the page.
| Fire incidents reported | |
|---|---|
| Sreet name | Count |
| ALFRED ST | 420 |
| ELM ST | 234 |
| MAIN ST | 218 |
| HILLS BEACH RD | 144 |
| SOUTH ST | 108 |
| MARINER WAY | 104 |
| POOL ST | 86 |
| HILL ST | 80 |
| MAINE TPKE | 72 |
| SHOPS WAY | 70 |
| ADAMS ST | 58 |
| BOULDER WAY | 58 |
| MORIN ST | 56 |
| WEST ST | 54 |
| GRAHAM ST | 52 |
| GRANITE ST | 52 |
| SUMMER ST | 50 |
| BACON ST | 48 |
| SULLIVAN ST | 48 |
| LINCOLN ST | 46 |
| BIRCH ST | 44 |
| GUINEA RD | 40 |
| HIGH ST | 40 |
| CUTTS ST | 36 |
| GREEN ST | 36 |
| BRADBURY ST | 34 |
| WATER ST | 34 |
| CENTER ST | 32 |
| FOSS ST | 32 |
| PROSPECT ST | 32 |
2003 - 2018 National Fire Incident Reporting System (NFIRS) incidents
- Incident types reported to NFIRS in Biddeford, ME
- 16,19467.2%Rescue & EMS
- 2,50410.4%Hazardous Condition
- 1,9448.1%Fire
- 1,6526.9%False Alarm
- 9984.1%Service Call
- 7893.3%Good Intent Call
- Fire incident types reported to NFIRS in Biddeford, ME
- 1,12657.9%Structure Fires
- 53927.7%Outside Fires
- 1718.8%Mobile Property/Vehicle Fires
- 1085.6%Other
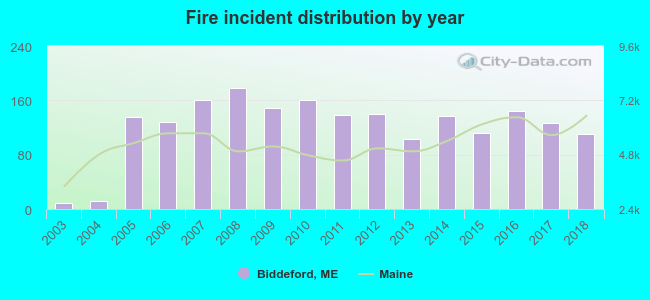 According to the data from the years 2003 - 2018 the average number of fire incidents per year is 122. The highest number of fires - 178 took place in 2008, and the least - 9 in 2003. The data has a growing trend.
The average number of yearly fire incidents per 10k residents in Biddeford, ME compared to nearest cities:
(Note: Based on data for the last 3 years, including only cities with population 5,000 and above)
| Biddeford: | 59.5 |
| Saco: | 41.2 |
| Old Orchard Beach: | 26.7 |
| Kennebunk: | 88.9 |
| Buxton: | 31.5 |
| Wells: | 48.3 |
| South Portland: | 37.0 |
| Cape Elizabeth: | 25.5 |
| Gorham: | 90.1 |
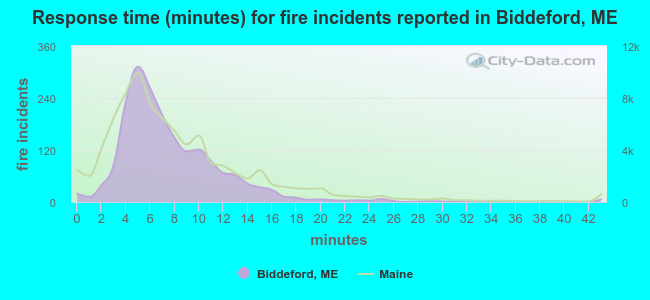 The median response time based on all reported fire incidents is 7 minutes. This is close to the Maine median value.
The median response time in Biddeford, ME compared to nearest cities:
(Note: Based on data for all years, including only cities with at least 500 fire incidents)
| Biddeford: | 7 minutes |
| Saco: | 7 minutes |
| Kennebunk: | 6 minutes |
| Scarborough: | 7 minutes |
| Wells: | 7 minutes |
| South Portland: | 6 minutes |
| Gorham: | 7 minutes |
| Westbrook: | 5 minutes |
| Portland: | 4 minutes |
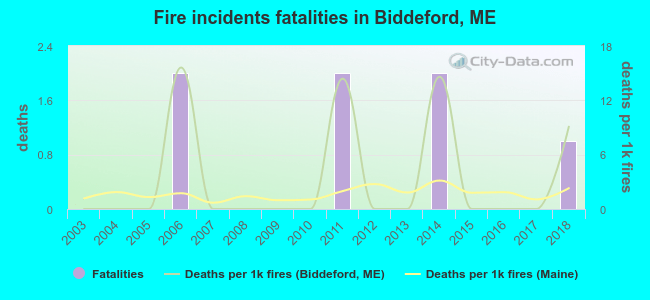 According to the reports from the years 2003 - 2018 the average number of fire-related fatalities per year is 0. The highest number of reported deaths - 2 took place in 2006, and the lowest - 0 in 2003. The data has a rising trend.
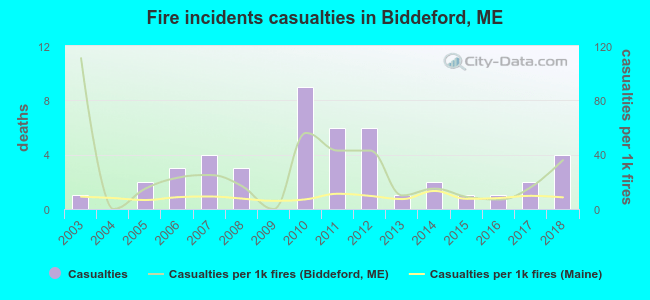 According to the data from the years 2003 - 2018 the average number of fire-related yearly casualties is 3. The highest number of reported injuries - 9 took place in 2010, and the lowest - 0 in 2004. The data has an increasing trend.
The average number of casualties per 1,000 fires is 27. This indicator was the highest - 111 in 2003, and the lowest 0 in 2004. The trend for casualties per 1,000 incidents is decreasing. Compared to the Maine value the number of casualties per 1,000 fire incidents is much higher.
According to the data from the years 2003 - 2018 the average number of fire-related yearly casualties is 3. The highest number of reported injuries - 9 took place in 2010, and the lowest - 0 in 2004. The data has an increasing trend.
The average number of casualties per 1,000 fires is 27. This indicator was the highest - 111 in 2003, and the lowest 0 in 2004. The trend for casualties per 1,000 incidents is decreasing. Compared to the Maine value the number of casualties per 1,000 fire incidents is much higher.Casualties per 1,000 incidents in Biddeford, ME compared to nearest cities:
(Note: Based on data for all years, including only cities with at least 500 fire incidents)
| Biddeford: | 23.1 |
| Saco: | 17.0 |
| Kennebunk: | 8.6 |
| Scarborough: | 6.5 |
| Wells: | 14.2 |
| South Portland: | 2.3 |
| Gorham: | 10.8 |
| Westbrook: | 35.2 |
| Portland: | 5.2 |
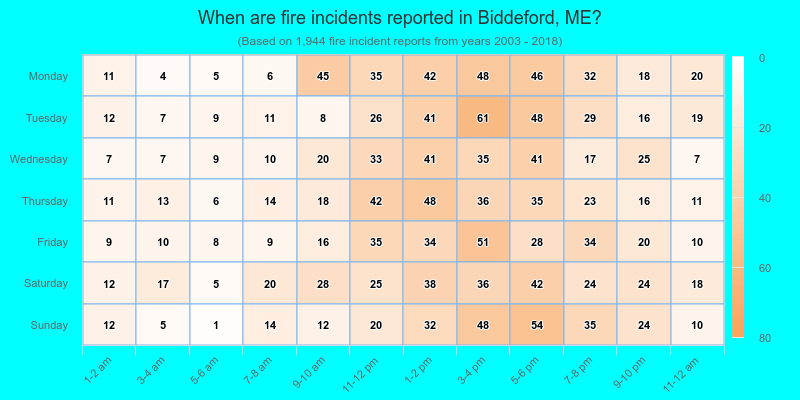
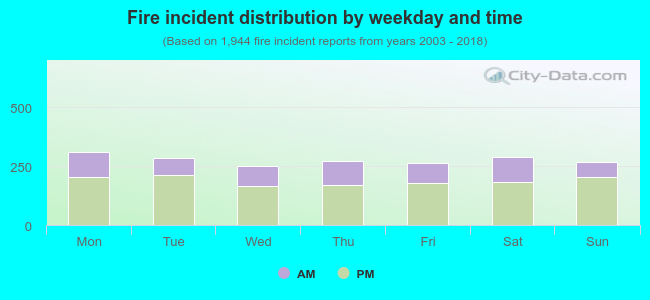 32.3% incidents where reported in the morning and 67.7% in the evening. The most fires (16.0%) took place on Monday, and the least (13.0%) on Wednesday.
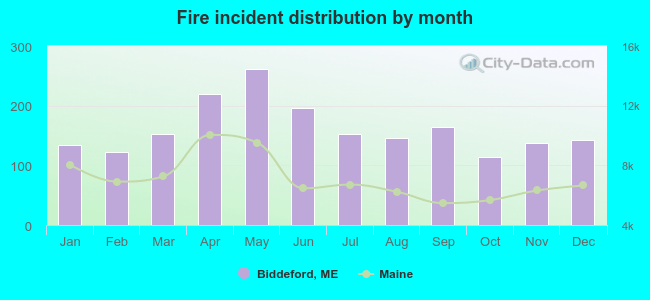 Based on the 1,944 fire incidents from years 2003 - 2018 most fires (13.5%) took place during May, and the least (5.9%) in October.
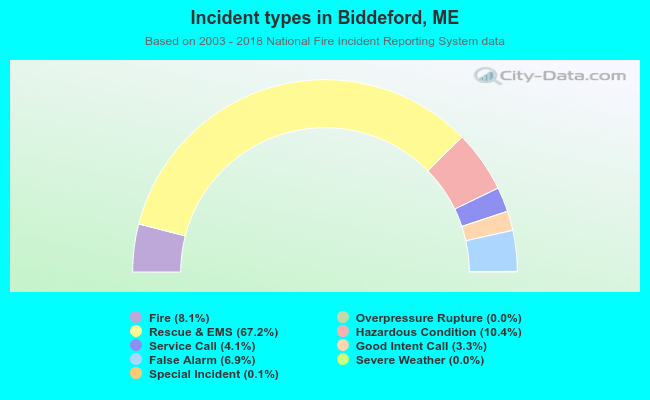 Out of all 24,101 cases reported during the years 2003 - 2018, the most belonged to the categories: Rescue & EMS (67.2%), Hazardous Condition (10.4%), and Fire (8.1%).
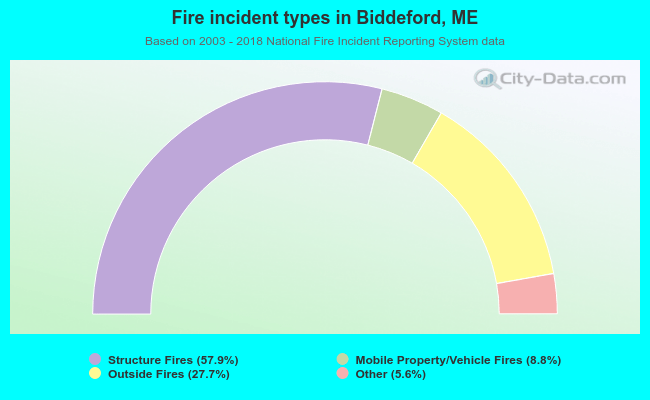 When looking into fire subcategories, the most incidents belonged to: Structure Fires (57.9%), and Outside Fires (27.7%).