Tempe: Fire Incidents, Arizona (AZ)
Where are fire incidents reported in Tempe, AZ
Something went wrong! Please refresh the page.
| Fire incidents reported | |
|---|---|
| Sreet name | Count |
| BASELINE RD | 668 |
| BROADWAY RD | 602 |
| UNIVERSITY DR | 482 |
| APACHE BL | 432 |
| HARDY DR | 358 |
| RURAL RD | 352 |
| MILL AV | 316 |
| MCCLINTOCK DR | 302 |
| PRIEST DR | 300 |
| SOUTHERN AV | 238 |
| A202 RED MTN | 194 |
| LEMON ST | 194 |
| ELLIOT RD | 192 |
| SCOTTSDALE RD | 190 |
| US60 | 186 |
| PRICE RD | 178 |
| A101 | 168 |
| GROVE PW | 166 |
| 5TH ST | 164 |
| A202 | 156 |
| GUADALUPE RD | 150 |
| CURRY RD | 136 |
| COLLEGE AV | 130 |
| ORANGE ST | 128 |
| DORSEY LN | 122 |
| I10 | 120 |
| RIO SALADO PW | 120 |
| HERMOSA DR | 116 |
| 1ST ST | 112 |
| 6TH ST | 104 |
| Other | 487 |
2005 - 2018 National Fire Incident Reporting System (NFIRS) incidents
- Incident types reported to NFIRS in Tempe, AZ
- 76,27870.3%Rescue & EMS
- 8,9038.2%Service Call
- 7,5637.0%Fire
- 6,8736.3%Good Intent Call
- 3,5013.2%False Alarm
- 2,8132.6%Hazardous Condition
- 2,5682.4%Special Incident
- Fire incident types reported to NFIRS in Tempe, AZ
- 3,68248.7%Outside Fires
- 2,21429.3%Structure Fires
- 1,27016.8%Mobile Property/Vehicle Fires
- 3975.2%Other
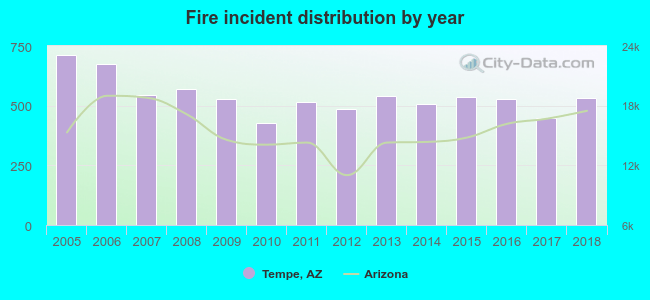 Based on the data from the years 2005 - 2018 the average number of fires per year is 540. The highest number of reported fires - 714 took place in 2005, and the least - 428 in 2010. The data has a dropping trend.
The average number of yearly fire incidents per 10k residents in Tempe, AZ compared to nearest cities:
(Note: Based on data for the last 3 years, including only cities with population 5,000 and above)
| Tempe: | 29.2 |
| Guadalupe: | 9.3 |
| Chandler: | 16.6 |
| Gilbert: | 12.8 |
| Mesa: | 21.6 |
| Paradise Valley: | 5.9 |
| Salt River: | 1.1 |
| Sun Lakes: | 19.1 |
| Phoenix: | 36.2 |
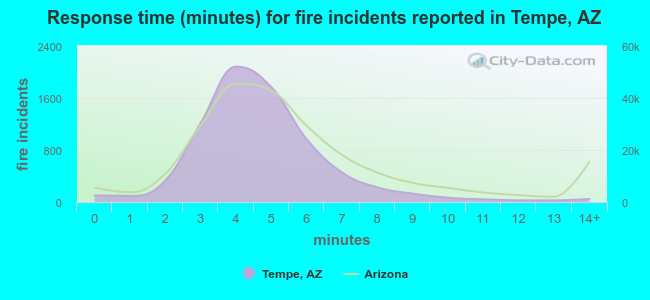 The median response time based on all reported fire incidents is 4 minutes. This is lower than the Arizona median value.
The median response time in Tempe, AZ compared to nearest cities:
(Note: Based on data for all years, including only cities with at least 500 fire incidents)
| Tempe: | 4 minutes |
| Chandler: | 5 minutes |
| Gilbert: | 5 minutes |
| Mesa: | 5 minutes |
| Phoenix: | 4 minutes |
| Scottsdale: | 5 minutes |
| Queen Creek: | 6 minutes |
| Glendale: | 4 minutes |
| Apache Junction: | 6 minutes |
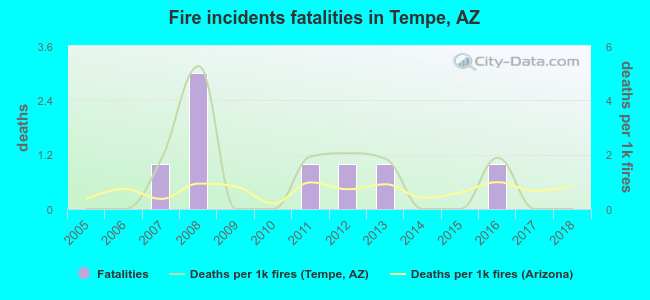 Based on the reports from the years 2005 - 2018 the average number of fire-related yearly deaths is 1. The highest number of reported deaths - 3 took place in 2008, and the lowest - 0 in 2005. The data has a constant trend.
The average number of deaths per 1,000 fires is 1. This indicator was the highest - 5 in 2008, and the lowest 0 in 2005. The trend for fatalities per 1,000 incidents is constant. Compared to the state value the number of deaths per 1,000 fires is higher.
Based on the reports from the years 2005 - 2018 the average number of fire-related yearly deaths is 1. The highest number of reported deaths - 3 took place in 2008, and the lowest - 0 in 2005. The data has a constant trend.
The average number of deaths per 1,000 fires is 1. This indicator was the highest - 5 in 2008, and the lowest 0 in 2005. The trend for fatalities per 1,000 incidents is constant. Compared to the state value the number of deaths per 1,000 fires is higher.
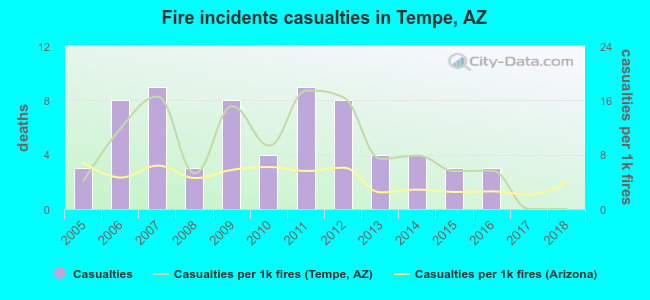 Based on the reports from the years 2005 - 2018 the average number of fire-related yearly casualties is 5. The highest number of reported casualties - 9 took place in 2007, and the lowest - 0 in 2017. The data has a decreasing trend.
The average number of casualties per 1,000 fires is 9. This indicator was the highest - 17 in 2011, and the lowest 0 in 2017. The trend for casualties per 1,000 fire incidents is decreasing. Compared to the Arizona value the number of casualties per 1,000 incidents is higher.
Based on the reports from the years 2005 - 2018 the average number of fire-related yearly casualties is 5. The highest number of reported casualties - 9 took place in 2007, and the lowest - 0 in 2017. The data has a decreasing trend.
The average number of casualties per 1,000 fires is 9. This indicator was the highest - 17 in 2011, and the lowest 0 in 2017. The trend for casualties per 1,000 fire incidents is decreasing. Compared to the Arizona value the number of casualties per 1,000 incidents is higher.Casualties per 1,000 incidents in Tempe, AZ compared to nearest cities:
(Note: Based on data for all years, including only cities with at least 500 fire incidents)
| Tempe: | 8.7 |
| Chandler: | 1.8 |
| Gilbert: | 5.0 |
| Mesa: | 15.7 |
| Phoenix: | 0.0 |
| Scottsdale: | 2.6 |
| Queen Creek: | 1.5 |
| Glendale: | 1.9 |
| Apache Junction: | 25.6 |
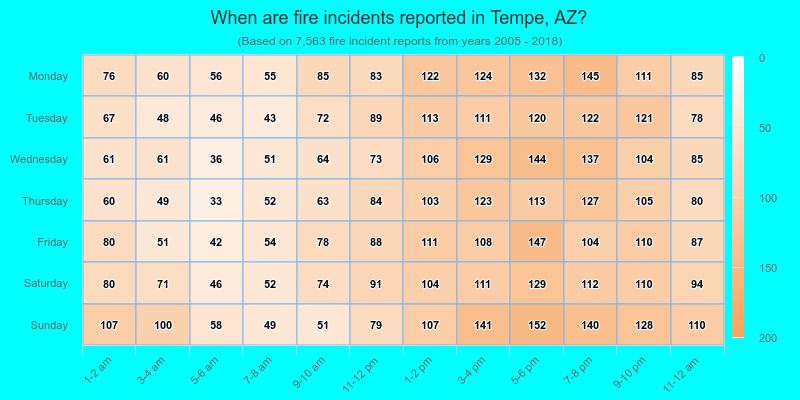
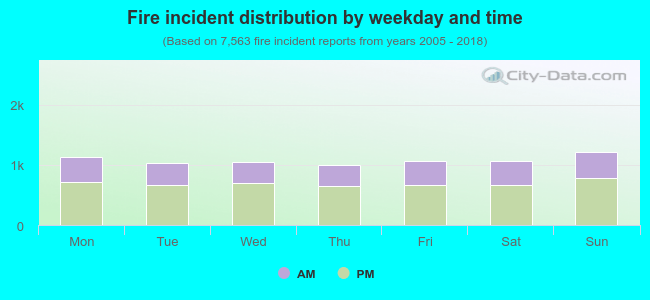 35.9% incidents where reported in the morning and 64.1% in the evening. The most fires (16.2%) took place on Sunday, and the least (13.1%) on Thursday.
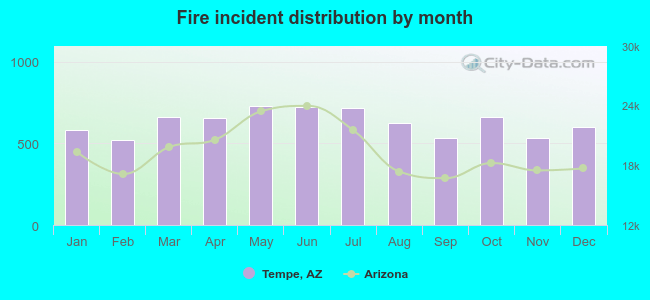 Based on the 7,563 fires from years 2005 - 2018 most fires (9.7%) took place during May, and the least (6.9%) in February.
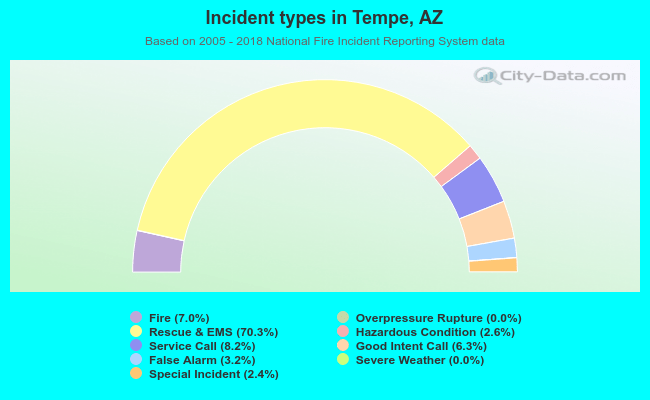 Out of all 108,548 cases reported during the years 2005 - 2018, the most belonged to the categories: Rescue & EMS (70.3%), Service Call (8.2%), and Fire (7.0%).
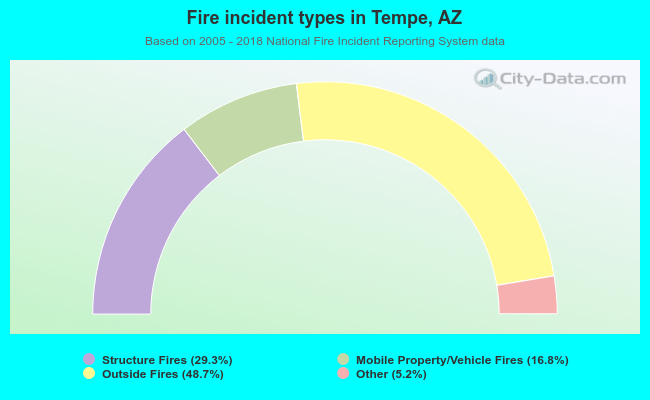 When looking into fire subcategories, the most incidents belonged to: Outside Fires (48.7%), and Structure Fires (29.3%).