Sun Lakes: Fire Incidents, Arizona (AZ)
Where are fire incidents reported in Sun Lakes, AZ
Something went wrong! Please refresh the page.
|
| |||||||||||||||||||||||||||||||||||||||||||||||||||||||||||||||||||||||||||||||||||||||||||||||||||||||||||||
2005 - 2018 National Fire Incident Reporting System (NFIRS) incidents
- Incident types reported to NFIRS in Sun Lakes, AZ
- 11,50684.7%Rescue & EMS
- 7985.9%Service Call
- 5213.8%Good Intent Call
- 4133.0%False Alarm
- 2051.5%Fire
- 1321.0%Hazardous Condition
- Fire incident types reported to NFIRS in Sun Lakes, AZ
- 10651.7%Structure Fires
- 4622.4%Other
- 2713.2%Mobile Property/Vehicle Fires
- 2612.7%Outside Fires
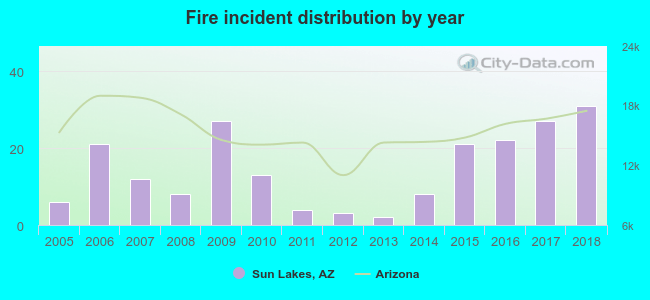 Based on the data from the years 2005 - 2018 the average number of fires per year is 15. The highest number of reported fires - 31 took place in 2018, and the least - 2 in 2013. The data has a growing trend.
The average number of yearly fire incidents per 10k residents in Sun Lakes, AZ compared to nearest cities:
(Note: Based on data for the last 3 years, including only cities with population 5,000 and above)
| Sun Lakes: | 19.1 |
| Chandler: | 16.6 |
| Gila River: | 1.4 |
| Gilbert: | 12.8 |
| Guadalupe: | 9.3 |
| Tempe: | 29.2 |
| Queen Creek: | 21.4 |
| Maricopa: | 8.4 |
| Mesa: | 21.6 |
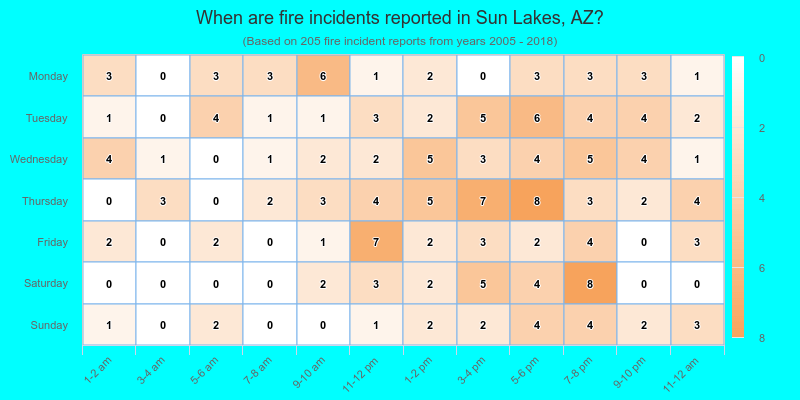
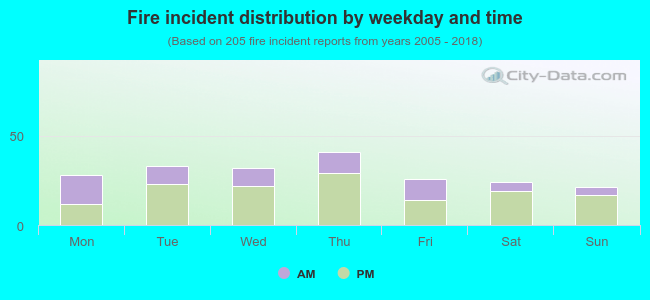 33.7% incidents where reported in the morning and 66.3% in the evening. The most fires (20.0%) took place on Thursday, and the least (10.2%) on Sunday.
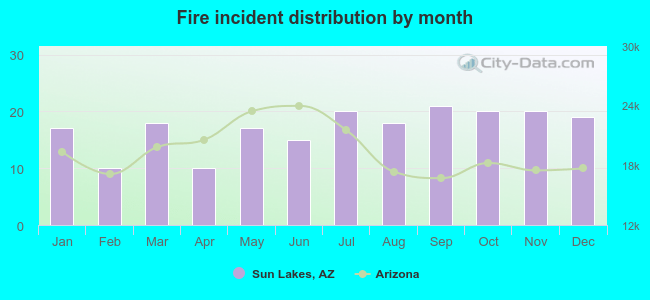 According to the 205 fire incidents from years 2005 - 2018 most fires (10.2%) took place during September, and the least (4.9%) in February.
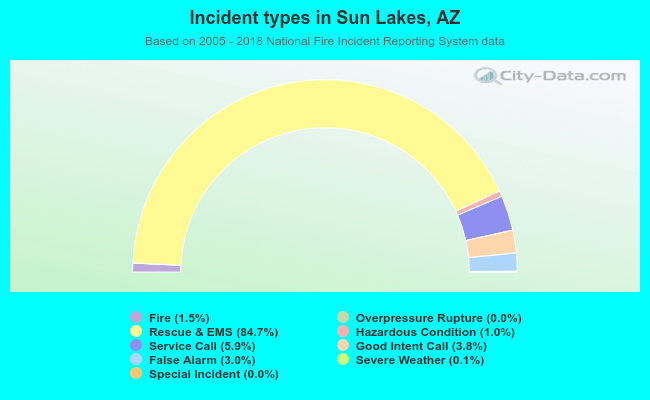 Out of all 13,591 cases reported during the years 2005 - 2018, the most belonged to the categories: Rescue & EMS (84.7%), Service Call (5.9%), and Good Intent Call (3.8%).
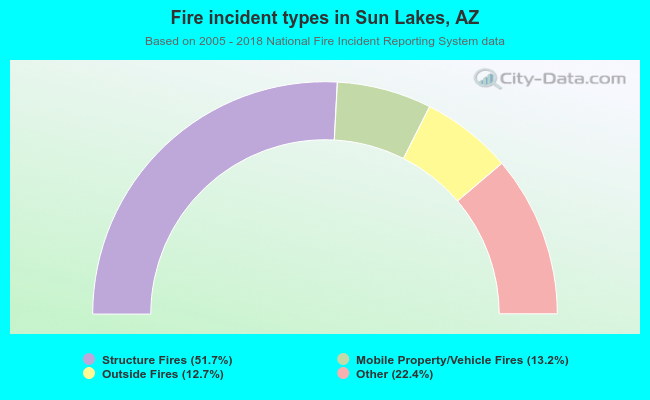 When looking into fire subcategories, the most incidents belonged to: Structure Fires (51.7%), and Other (22.4%).