Queen Creek: Fire Incidents, Arizona (AZ)
Where are fire incidents reported in Queen Creek, AZ
Something went wrong! Please refresh the page.
|
| |||||||||||||||||||||||||||||||||||||||||||||||||||||||||||||||||||||||||||||||||||||||||||||||||||||||||||||
2007 - 2018 National Fire Incident Reporting System (NFIRS) incidents
- Incident types reported to NFIRS in Queen Creek, AZ
- 6,65858.3%Rescue & EMS
- 1,77515.5%Service Call
- 1,1269.9%Good Intent Call
- 7186.3%False Alarm
- 6735.9%Fire
- 4303.8%Hazardous Condition
- 180.2%Special Incident
- 140.1%Overpressure Rupture
- Fire incident types reported to NFIRS in Queen Creek, AZ
- 35753.0%Outside Fires
- 18126.9%Structure Fires
- 9313.8%Mobile Property/Vehicle Fires
- 426.2%Other
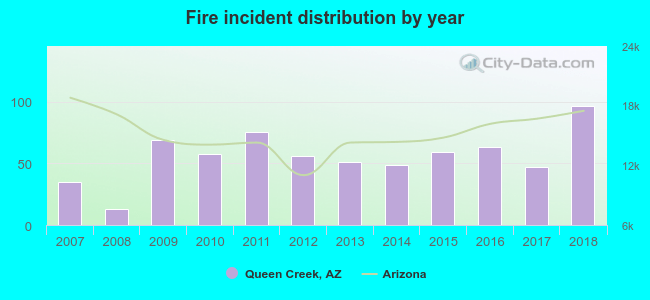 According to the data from the years 2007 - 2018 the average number of fire incidents per year is 56. The highest number of reported fires - 97 took place in 2018, and the least - 13 in 2008. The data has an increasing trend.
The average number of yearly fire incidents per 10k residents in Queen Creek, AZ compared to nearest cities:
(Note: Based on data for the last 3 years, including only cities with population 5,000 and above)
| Queen Creek: | 21.4 |
| San Tan Valley: | 0.3 |
| Gilbert: | 12.8 |
| Gila River: | 1.4 |
| Apache Junction: | 8.3 |
| Mesa: | 21.6 |
| Sun Lakes: | 19.1 |
| Chandler: | 16.6 |
| Tempe: | 29.2 |
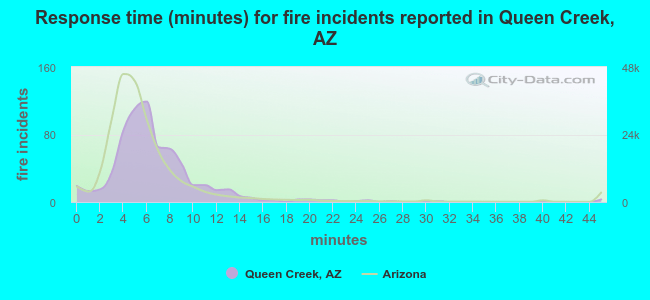 The median response time based on all reported fire incidents is 6 minutes. This is close to the Arizona median value.
The median response time in Queen Creek, AZ compared to nearest cities:
(Note: Based on data for all years, including only cities with at least 500 fire incidents)
| Queen Creek: | 6 minutes |
| Gilbert: | 5 minutes |
| Apache Junction: | 6 minutes |
| Mesa: | 5 minutes |
| Chandler: | 5 minutes |
| Tempe: | 4 minutes |
| Coolidge: | 6 minutes |
| Florence: | 7 minutes |
| Casa Grande: | 6 minutes |
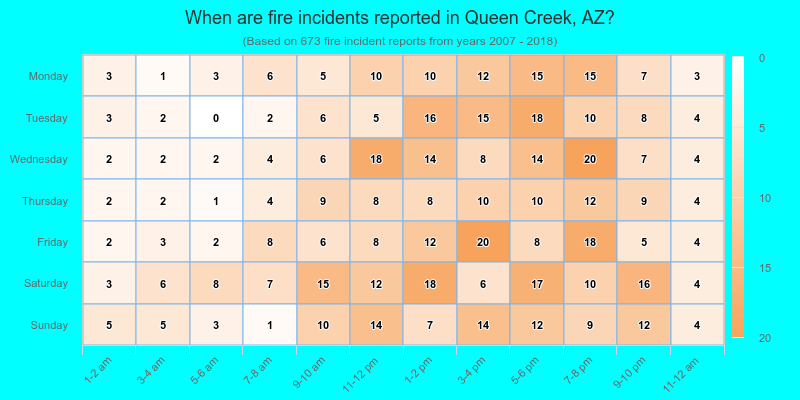
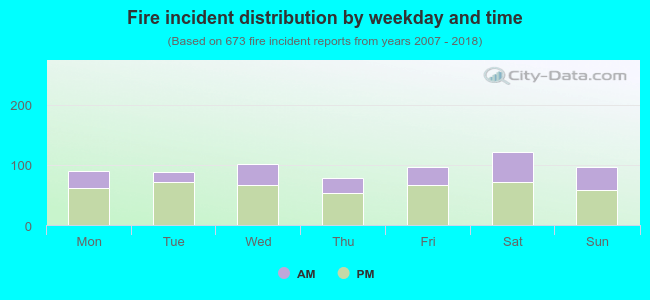 33.3% incidents where reported in the morning and 66.7% in the evening. The most fires (18.1%) took place on Saturday, and the least (11.7%) on Thursday.
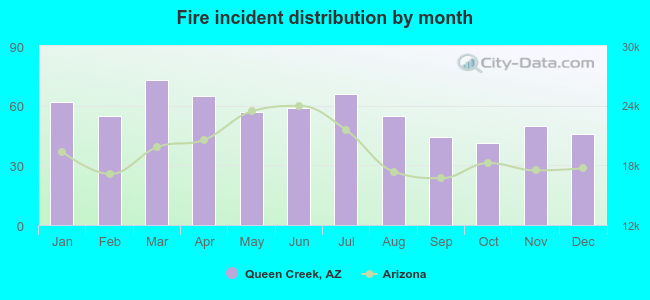 According to the 673 fires from years 2007 - 2018 most fires (10.8%) took place during March, and the least (6.1%) in October.
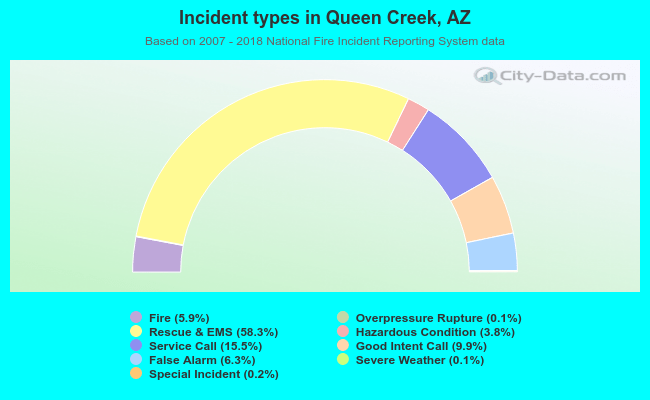 Out of all 11,419 cases reported during the years 2007 - 2018, the most belonged to the categories: Rescue & EMS (58.3%), Service Call (15.5%), and Good Intent Call (9.9%).
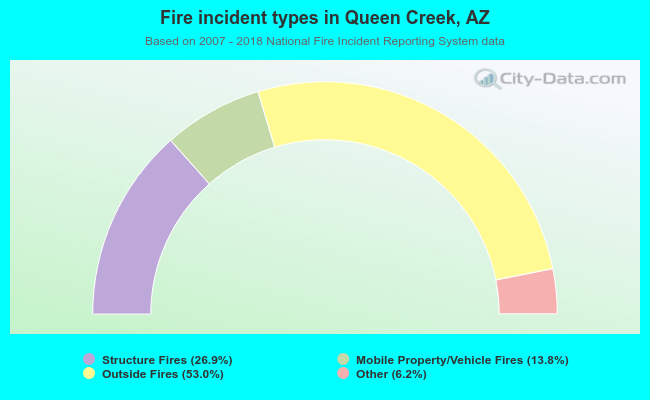 When looking into fire subcategories, the most incidents belonged to: Outside Fires (53.0%), and Structure Fires (26.9%).