Paradise Valley: Fire Incidents, Arizona (AZ)
Where are fire incidents reported in Paradise Valley, AZ
Something went wrong! Please refresh the page.
|
| |||||||||||||||||||||||||||||||||||||||||||||||||||||||||||||||||||||||||||||||||||||||||||||||||||||||||||||
2005 - 2018 National Fire Incident Reporting System (NFIRS) incidents
- Incident types reported to NFIRS in Paradise Valley, AZ
- 56143.8%Rescue & EMS
- 19014.8%Good Intent Call
- 15311.9%False Alarm
- 13910.9%Hazardous Condition
- 1269.8%Service Call
- 1088.4%Fire
- 40.3%Special Incident
- Fire incident types reported to NFIRS in Paradise Valley, AZ
- 7771.3%Structure Fires
- 1715.7%Other
- 98.3%Outside Fires
- 54.6%Mobile Property/Vehicle Fires
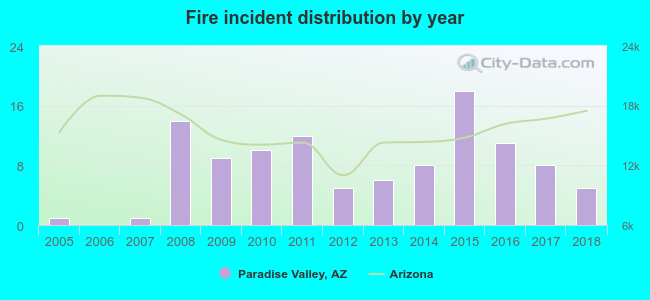 Based on the data from the years 2005 - 2018 the average number of fire incidents per year is 8. The highest number of fires - 18 took place in 2015, and the least - 0 in 2006. The data has a rising trend.
The average number of yearly fire incidents per 10k residents in Paradise Valley, AZ compared to nearest cities:
(Note: Based on data for the last 3 years, including only cities with population 5,000 and above)
| Paradise Valley: | 5.9 |
| Scottsdale: | 14.2 |
| Phoenix: | 36.2 |
| Salt River: | 1.1 |
| Tempe: | 29.2 |
| Guadalupe: | 9.3 |
| Glendale: | 0.8 |
| Mesa: | 21.6 |
| Gilbert: | 12.8 |
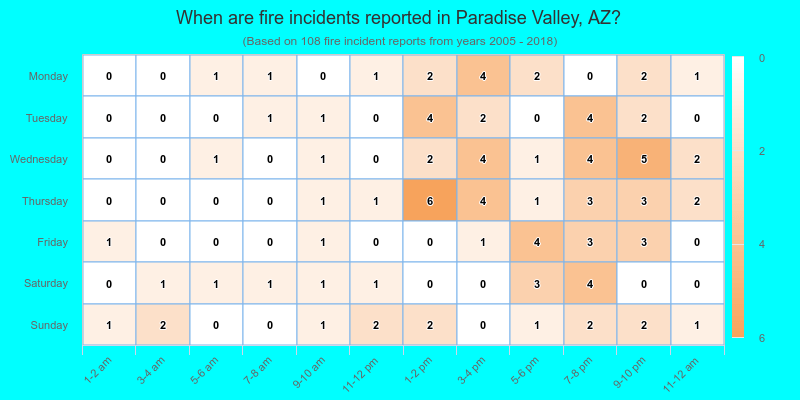
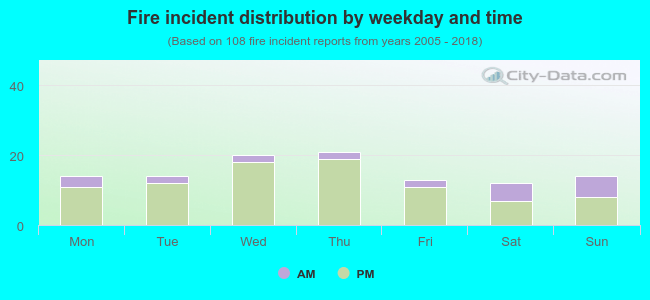 20.4% incidents where reported in the morning and 79.6% in the evening. The most fires (19.4%) took place on Thursday, and the least (11.1%) on Saturday.
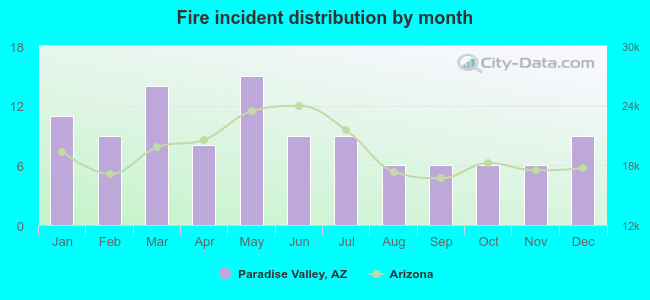 Based on the 108 reports from years 2005 - 2018 most fires (13.9%) took place during May, and the least (5.6%) in August.
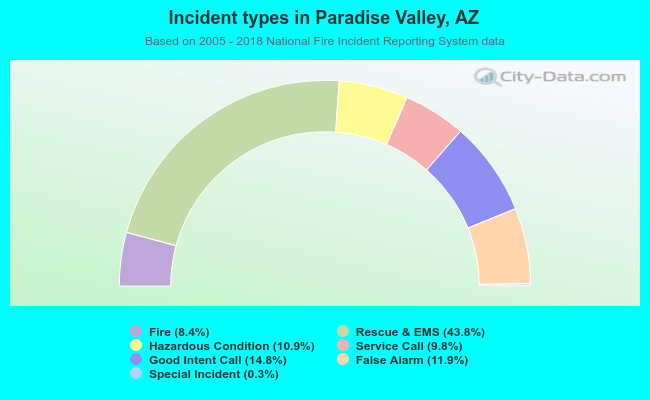 Out of all 1,281 cases reported during the years 2005 - 2018, the most belonged to the categories: Overpressure Rupture (43.8%), Service Call (14.8%), and Good Intent Call (11.9%).
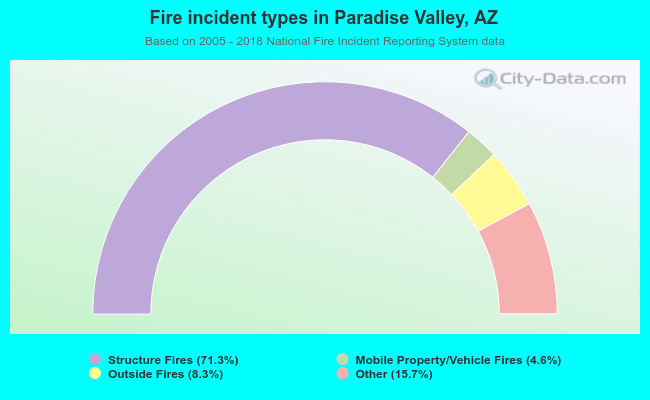 When looking into fire subcategories, the most reports belonged to: Structure Fires (71.3%), and Other (15.7%).