Surprise: Fire Incidents, Arizona (AZ)
Where are fire incidents reported in Surprise, AZ
Something went wrong! Please refresh the page.
| Fire incidents reported | |
|---|---|
| Sreet name | Count |
| BELL RD | 442 |
| A303 | 138 |
| GREENWAY RD | 96 |
| DEER VALLEY RD | 92 |
| GRAND AV | 68 |
| LITCHFIELD RD | 64 |
| PARKVIEW PL | 64 |
| GRAND | 60 |
| 219TH AV | 58 |
| CARIBBEAN LN | 50 |
| PORT ROYALE LN | 50 |
| CACTUS RD | 48 |
| BELL RD | 46 |
| 163RD AV | 42 |
| COTTON LN | 42 |
| COTTONWOOD ST | 42 |
| BANFF LN | 38 |
| 219TH | 36 |
| DYSART RD | 36 |
| LUNDBERG ST | 36 |
| MAUNA LOA LN | 36 |
| DESERT LN | 34 |
| EL MIRAGE RD | 34 |
| GELDING DR | 34 |
| GRAND AVE | 34 |
| PARADISE LN | 34 |
| PORT AU PRINCE LN | 34 |
| REEMS RD | 34 |
| TARA LN | 34 |
| TASHA DR | 34 |
| Other | 849 |
2005 - 2018 National Fire Incident Reporting System (NFIRS) incidents
- Incident types reported to NFIRS in Surprise, AZ
- 43,77577.2%Rescue & EMS
- 3,3175.9%Good Intent Call
- 3,0275.3%Service Call
- 2,7894.9%False Alarm
- 2,7394.8%Fire
- 9511.7%Hazardous Condition
- Fire incident types reported to NFIRS in Surprise, AZ
- 1,13041.3%Outside Fires
- 82029.9%Structure Fires
- 42815.6%Mobile Property/Vehicle Fires
- 36113.2%Other
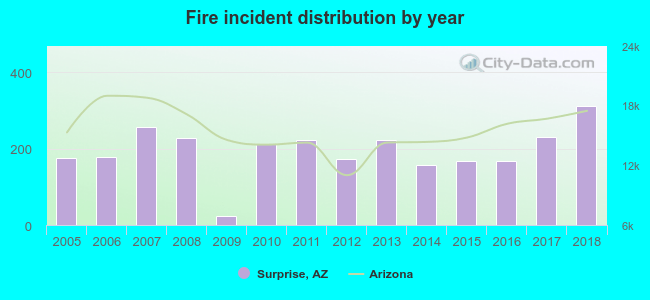 Based on the data from the years 2005 - 2018 the average number of fires per year is 195. The highest number of reported fires - 313 took place in 2018, and the least - 23 in 2009. The data has a growing trend.
The average number of yearly fire incidents per 10k residents in Surprise, AZ compared to nearest cities:
(Note: Based on data for the last 3 years, including only cities with population 5,000 and above)
| Surprise: | 18.8 |
| Sun City West: | 17.7 |
| El Mirage: | 32.0 |
| Youngtown: | 53.5 |
| Sun City: | 22.6 |
| Peoria: | 6.5 |
| Litchfield Park: | 17.9 |
| Glendale: | 0.8 |
| Avondale: | 34.3 |
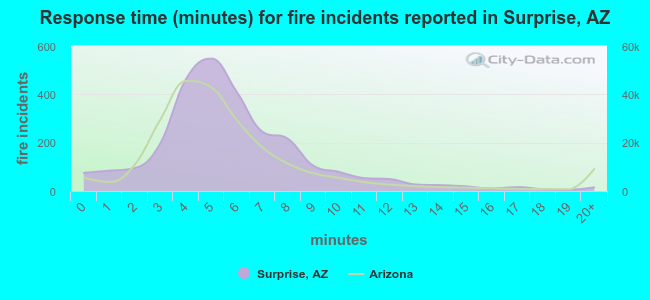 The median response time based on all reported fire incidents is 5 minutes. This is similar to the Arizona median value.
The median response time in Surprise, AZ compared to nearest cities:
(Note: Based on data for all years, including only cities with at least 500 fire incidents)
| Surprise: | 5 minutes |
| El Mirage: | 5 minutes |
| Sun City: | 4 minutes |
| Peoria: | 5 minutes |
| Glendale: | 4 minutes |
| Avondale: | 5 minutes |
| Goodyear: | 6 minutes |
| Buckeye: | 6 minutes |
| Phoenix: | 4 minutes |
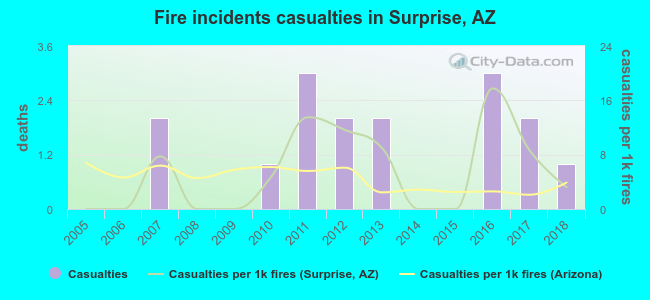 Based on the reports from the years 2005 - 2018 the average number of fire-related yearly casualties is 1. The highest number of reported casualties - 3 took place in 2011, and the lowest - 0 in 2005. The data has a growing trend.
The average number of casualties per 1,000 fires is 5. This indicator was the highest - 18 in 2016, and the lowest 0 in 2005. The trend for injuries per 1,000 incidents is increasing. Compared to the Arizona value the number of casualties per 1,000 fire incidents is about the same.
Based on the reports from the years 2005 - 2018 the average number of fire-related yearly casualties is 1. The highest number of reported casualties - 3 took place in 2011, and the lowest - 0 in 2005. The data has a growing trend.
The average number of casualties per 1,000 fires is 5. This indicator was the highest - 18 in 2016, and the lowest 0 in 2005. The trend for injuries per 1,000 incidents is increasing. Compared to the Arizona value the number of casualties per 1,000 fire incidents is about the same.
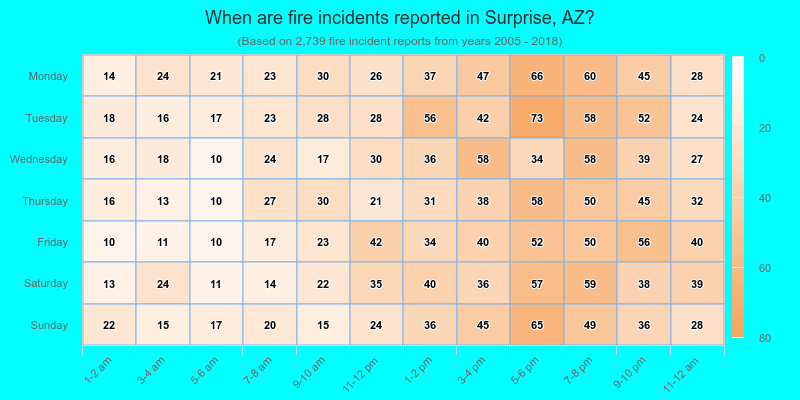
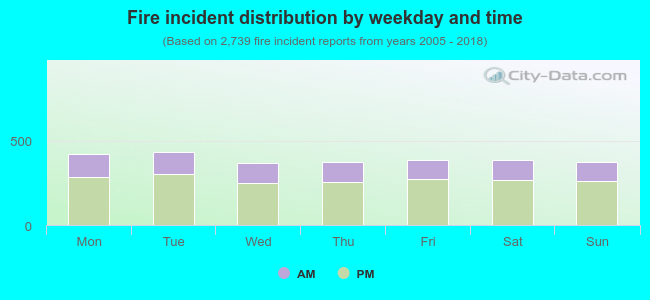 30.9% incidents where reported in the morning and 69.1% in the evening. The most fires (15.9%) took place on Tuesday, and the least (13.4%) on Wednesday.
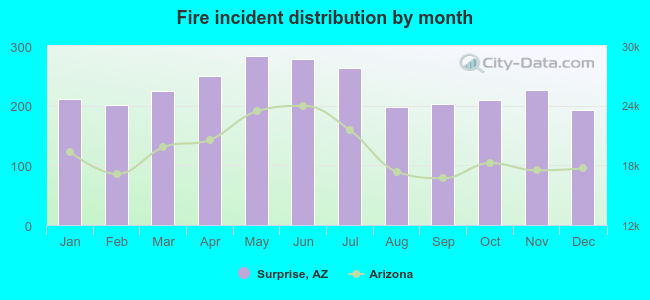 According to the 2,739 fires from years 2005 - 2018 most fires (10.4%) took place during May, and the least (7.0%) in December.
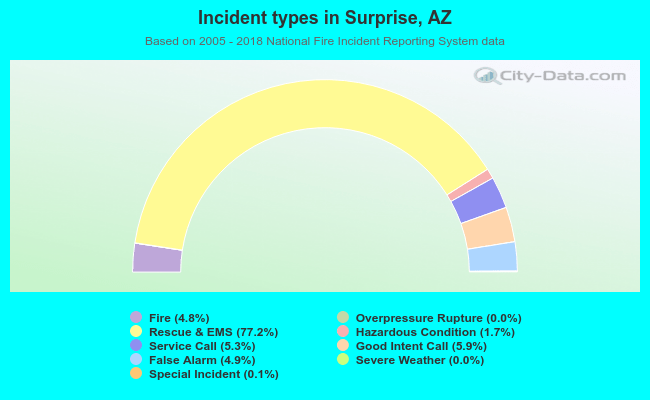 Out of all 56,673 cases reported during the years 2005 - 2018, the most belonged to the categories: Rescue & EMS (77.2%), Good Intent Call (5.9%), and Service Call (5.3%).
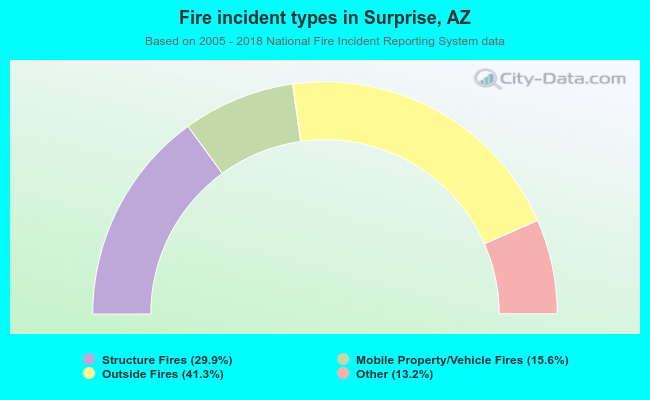 When looking into fire subcategories, the most incidents belonged to: Outside Fires (41.3%), and Structure Fires (29.9%).