Youngtown: Fire Incidents, Arizona (AZ)
Where are fire incidents reported in Youngtown, AZ
Something went wrong! Please refresh the page.
|
| |||||||||||||||||||||||||||||||||||||||||||||||||||||||||||||||||||||||||||||||||||||||||||||||||||||||||||||
2004 - 2018 National Fire Incident Reporting System (NFIRS) incidents
- Incident types reported to NFIRS in Youngtown, AZ
- 4,54782.5%Rescue & EMS
- 3326.0%Good Intent Call
- 2063.7%Service Call
- 1883.4%Fire
- 1492.7%False Alarm
- 871.6%Hazardous Condition
- Fire incident types reported to NFIRS in Youngtown, AZ
- 8143.1%Outside Fires
- 7439.4%Structure Fires
- 2312.2%Other
- 105.3%Mobile Property/Vehicle Fires
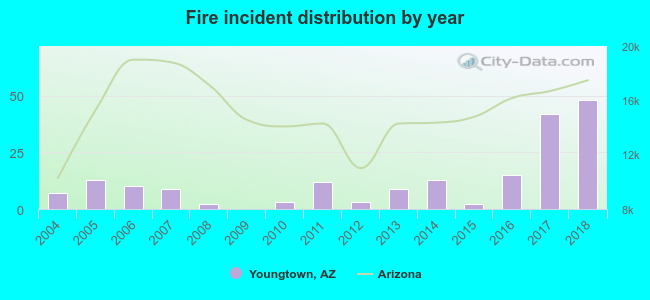 Based on the data from the years 2004 - 2018 the average number of fires per year is 13. The highest number of reported fires - 48 took place in 2018, and the least - 0 in 2009. The data has a growing trend.
The average number of yearly fire incidents per 10k residents in Youngtown, AZ compared to nearest cities:
(Note: Based on data for the last 3 years, including only cities with population 5,000 and above)
| Youngtown: | 53.5 |
| El Mirage: | 32.0 |
| Sun City: | 22.6 |
| Peoria: | 6.5 |
| Glendale: | 0.8 |
| Sun City West: | 17.7 |
| Surprise: | 18.8 |
| Litchfield Park: | 17.9 |
| Avondale: | 34.3 |
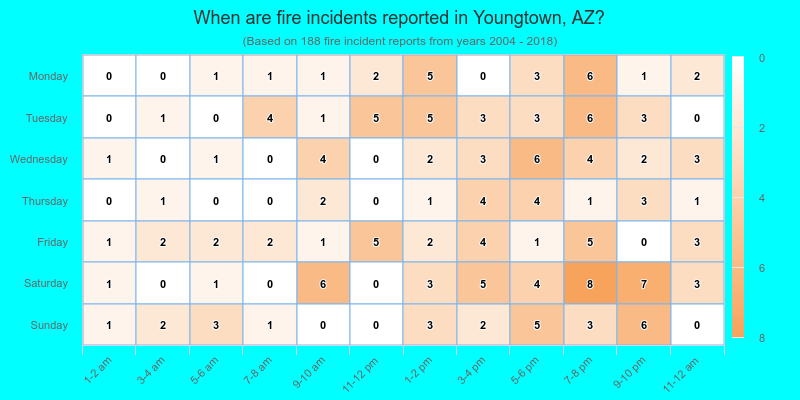
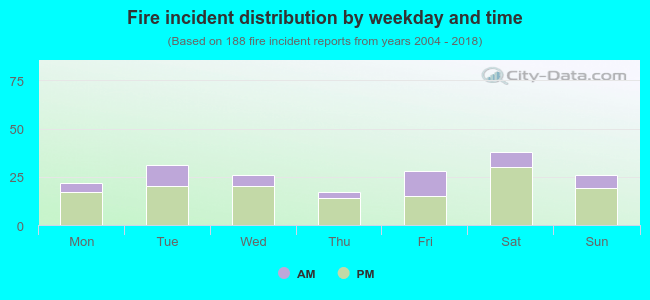 28.2% incidents where reported in the morning and 71.8% in the evening. The most fires (20.2%) took place on Saturday, and the least (9.0%) on Thursday.
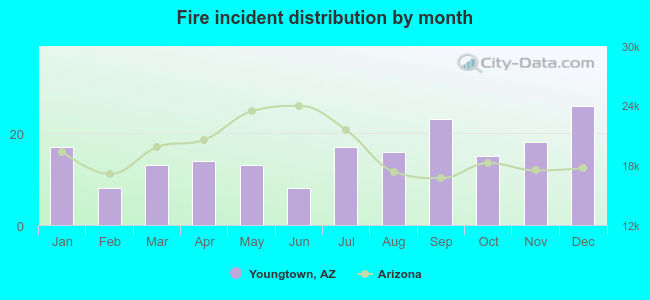 Based on the 188 reports from years 2004 - 2018 most fires (13.8%) took place during December, and the least (4.3%) in February.
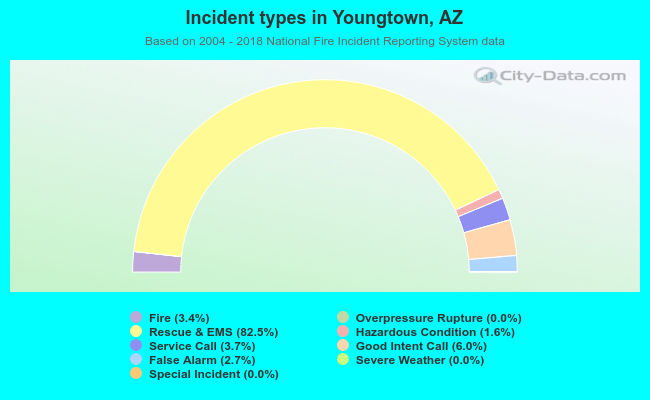 Out of all 5,512 cases reported during the years 2004 - 2018, the most belonged to the categories: Rescue & EMS (82.5%), Good Intent Call (6.0%), and Service Call (3.7%).
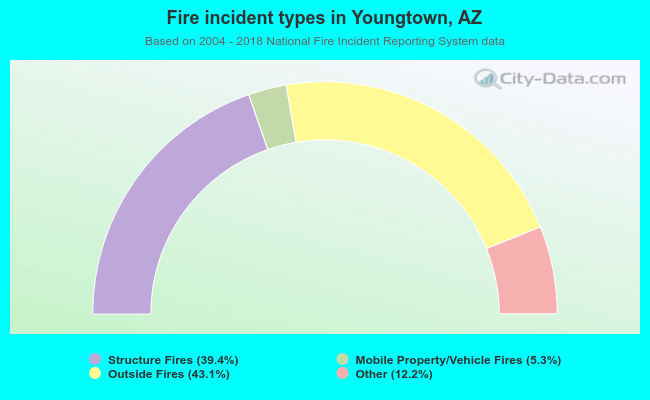 When looking into fire subcategories, the most incidents belonged to: Outside Fires (43.1%), and Structure Fires (39.4%).