Avondale: Fire Incidents, Arizona (AZ)
Where are fire incidents reported in Avondale, AZ
Something went wrong! Please refresh the page.
| Fire incidents reported | |
|---|---|
| Sreet name | Count |
| DYSART RD | 308 |
| MCDOWELL RD | 182 |
| AVONDALE BLVD | 120 |
| MAIN ST | 118 |
| BUCKEYE RD | 108 |
| EL MIRAGE RD | 100 |
| 107TH AVE | 94 |
| 4TH ST | 92 |
| CENTRAL AVE | 86 |
| I10 | 78 |
| VAN BUREN ST | 78 |
| LOWER BUCKEYE RD | 68 |
| CENTRAL AV | 64 |
| 1ST ST | 60 |
| 4TH AVE | 54 |
| 103RD AVE | 46 |
| 3RD ST | 42 |
| 99TH AVE | 42 |
| INDIAN SCHOOL RD | 38 |
| 4TH AV | 34 |
| BRINKER DR | 34 |
| 109TH AVE | 32 |
| LITCHFIELD RD | 32 |
| RANCHO SANTA FE BLVD | 32 |
| WESTERN AVE | 32 |
| 127TH AVE | 30 |
| ALVARADO RD | 28 |
| AVONDALE BL | 26 |
| 112TH DR | 24 |
| 3RD AVE | 24 |
2004 - 2018 National Fire Incident Reporting System (NFIRS) incidents
- Incident types reported to NFIRS in Avondale, AZ
- 28,08976.1%Rescue & EMS
- 2,3166.3%False Alarm
- 2,0635.6%Good Intent Call
- 2,0425.5%Fire
- 1,3763.7%Service Call
- 8622.3%Hazardous Condition
- 1540.4%Special Incident
- Fire incident types reported to NFIRS in Avondale, AZ
- 93045.5%Structure Fires
- 60329.5%Outside Fires
- 29014.2%Mobile Property/Vehicle Fires
- 21910.7%Other
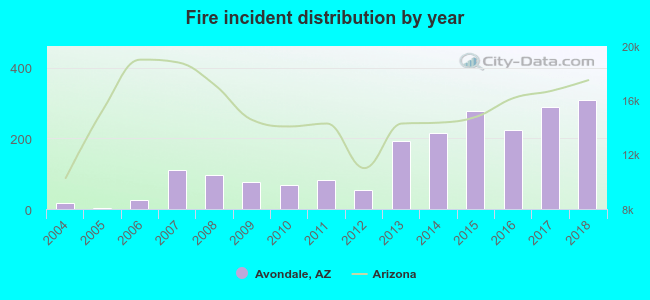 Based on the data from the years 2004 - 2018 the average number of fire incidents per year is 136. The highest number of reported fires - 308 took place in 2018, and the least - 3 in 2005. The data has a growing trend.
The average number of yearly fire incidents per 10k residents in Avondale, AZ compared to nearest cities:
(Note: Based on data for the last 3 years, including only cities with population 5,000 and above)
| Avondale: | 34.3 |
| Tolleson: | 96.7 |
| Litchfield Park: | 17.9 |
| Goodyear: | 18.8 |
| Youngtown: | 53.5 |
| El Mirage: | 32.0 |
| Glendale: | 0.8 |
| Sun City: | 22.6 |
| Peoria: | 6.5 |
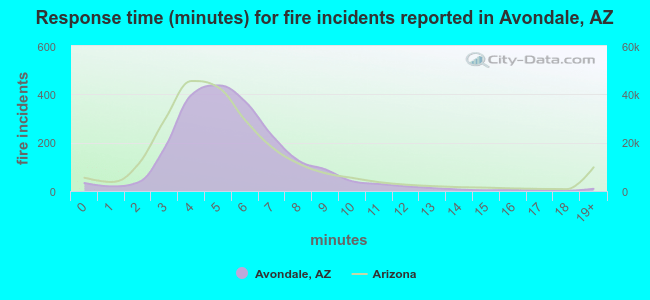 The median response time based on all reported fire incidents is 5 minutes. This is comparable to the state median value.
The median response time in Avondale, AZ compared to nearest cities:
(Note: Based on data for all years, including only cities with at least 500 fire incidents)
| Avondale: | 5 minutes |
| Goodyear: | 6 minutes |
| El Mirage: | 5 minutes |
| Glendale: | 4 minutes |
| Sun City: | 4 minutes |
| Peoria: | 5 minutes |
| Surprise: | 5 minutes |
| Phoenix: | 4 minutes |
| Buckeye: | 6 minutes |
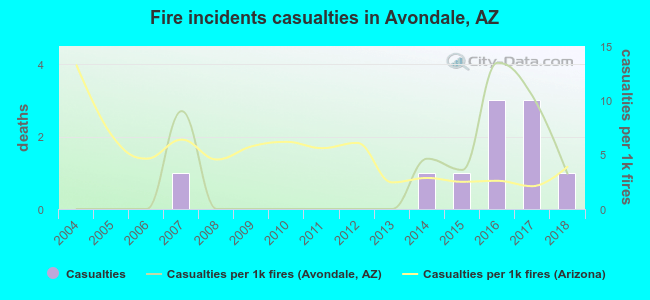 Based on the data from the years 2004 - 2018 the average number of fire-related yearly casualties is 1. The highest number of casualties - 3 took place in 2016, and the lowest - 0 in 2004. The data has an increasing trend.
The average number of casualties per 1,000 fire incidents is 3. This indicator was the highest - 13 in 2016, and the lowest 0 in 2004. The trend for casualties per 1,000 incidents is rising. Compared to the Arizona value the number of injuries per 1,000 fires is similar.
Based on the data from the years 2004 - 2018 the average number of fire-related yearly casualties is 1. The highest number of casualties - 3 took place in 2016, and the lowest - 0 in 2004. The data has an increasing trend.
The average number of casualties per 1,000 fire incidents is 3. This indicator was the highest - 13 in 2016, and the lowest 0 in 2004. The trend for casualties per 1,000 incidents is rising. Compared to the Arizona value the number of injuries per 1,000 fires is similar.
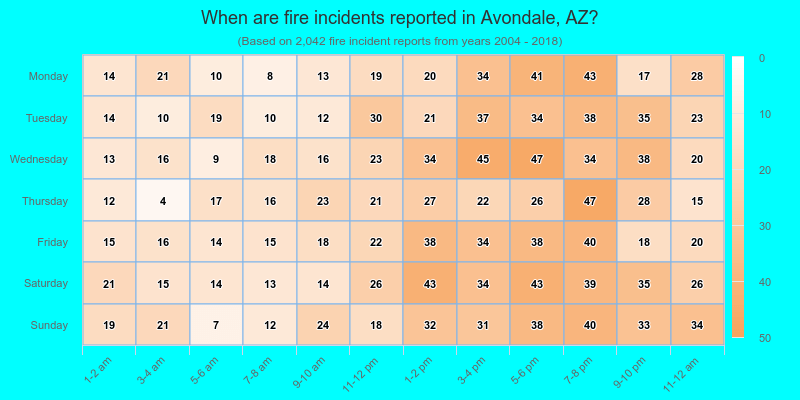
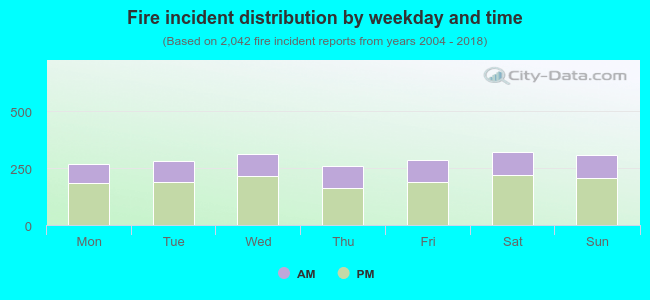 32.9% incidents where reported in the morning and 67.1% in the evening. The most fires (15.8%) took place on Saturday, and the least (12.6%) on Thursday.
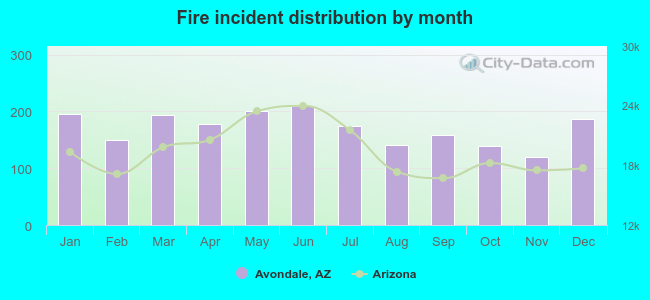 According to the 2,042 fire incidents from years 2004 - 2018 most fires (10.3%) took place during June, and the least (5.8%) in November.
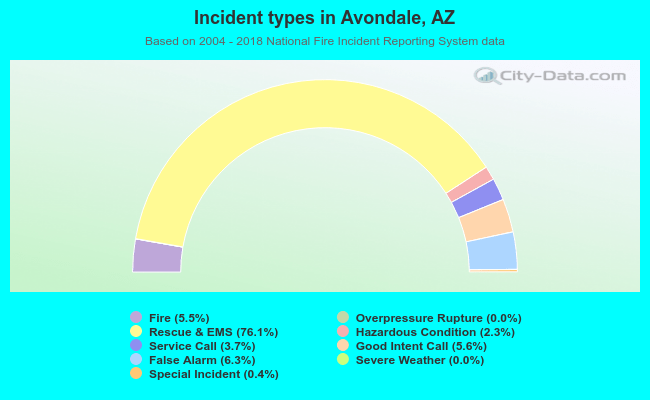 Out of all 36,919 cases reported during the years 2004 - 2018, the most belonged to the categories: Rescue & EMS (76.1%), False Alarm (6.3%), and Good Intent Call (5.6%).
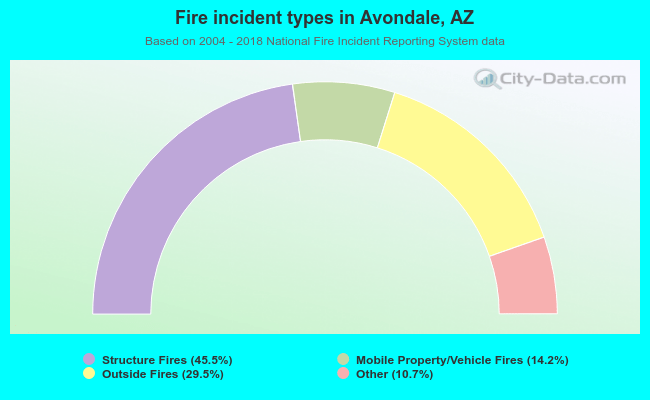 When looking into fire subcategories, the most incidents belonged to: Structure Fires (45.5%), and Outside Fires (29.5%).