Tolleson: Fire Incidents, Arizona (AZ)
Where are fire incidents reported in Tolleson, AZ
Something went wrong! Please refresh the page.
|
| |||||||||||||||||||||||||||||||||||||||||||||||||||||||||||||||||||||||||||||||||||||||||||||||||||||||||||||
2004 - 2018 National Fire Incident Reporting System (NFIRS) incidents
- Incident types reported to NFIRS in Tolleson, AZ
- 5,03474.1%Rescue & EMS
- 4606.8%Fire
- 4416.5%False Alarm
- 3935.8%Good Intent Call
- 2623.9%Service Call
- 1672.5%Hazardous Condition
- 310.5%Special Incident
- 70.1%Overpressure Rupture
- Fire incident types reported to NFIRS in Tolleson, AZ
- 14631.7%Outside Fires
- 12627.4%Structure Fires
- 11224.3%Mobile Property/Vehicle Fires
- 7616.5%Other
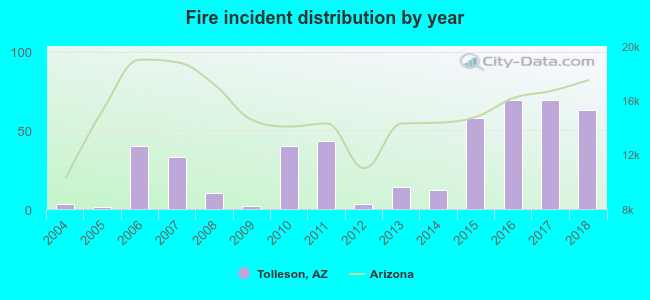 Based on the data from the years 2004 - 2018 the average number of fire incidents per year is 31. The highest number of fire incidents - 69 took place in 2016, and the least - 1 in 2005. The data has a rising trend.
The average number of yearly fire incidents per 10k residents in Tolleson, AZ compared to nearest cities:
(Note: Based on data for the last 3 years, including only cities with population 5,000 and above)
| Tolleson: | 96.7 |
| Avondale: | 34.3 |
| Litchfield Park: | 17.9 |
| Goodyear: | 18.8 |
| Glendale: | 0.8 |
| Youngtown: | 53.5 |
| El Mirage: | 32.0 |
| Sun City: | 22.6 |
| Phoenix: | 36.2 |
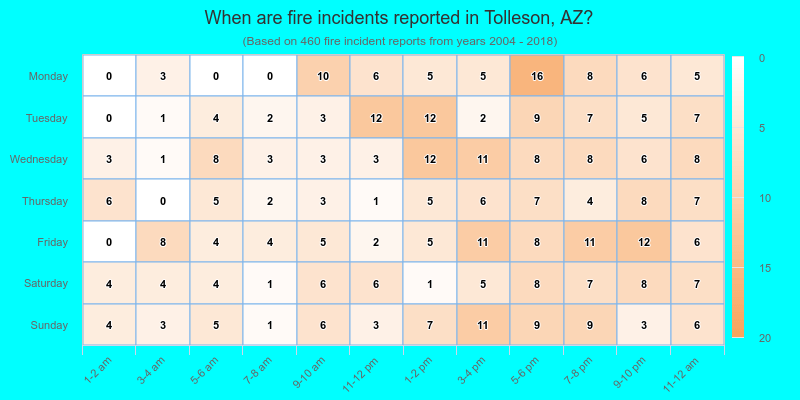
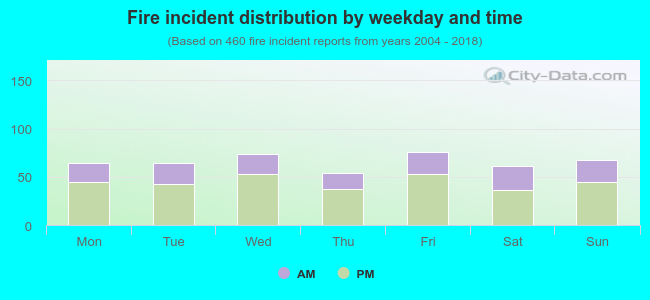 32.4% incidents where reported in the morning and 67.6% in the evening. The most fires (16.5%) took place on Friday, and the least (11.7%) on Thursday.
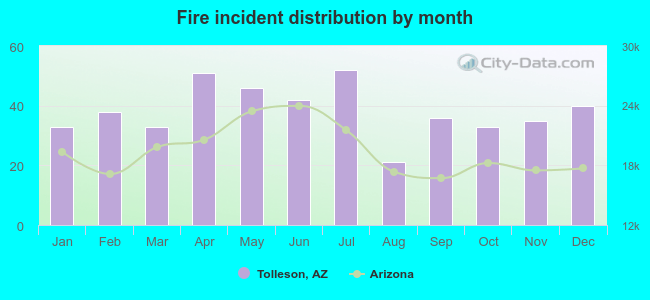 Based on the 460 fire incidents from years 2004 - 2018 most fires (11.3%) took place during July, and the least (4.6%) in August.
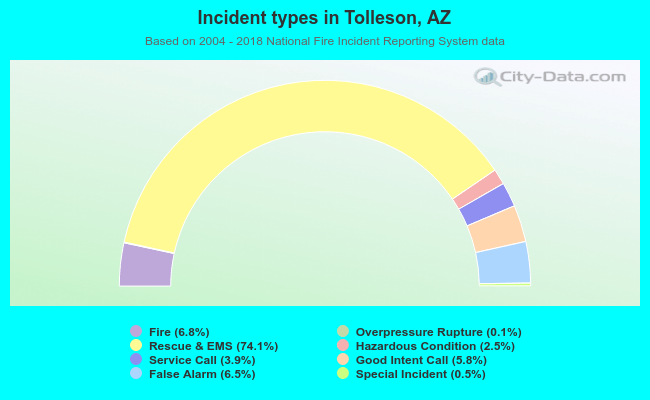 Out of all 6,795 cases reported during the years 2004 - 2018, the most belonged to the categories: Rescue & EMS (74.1%), Fire (6.8%), and False Alarm (6.5%).
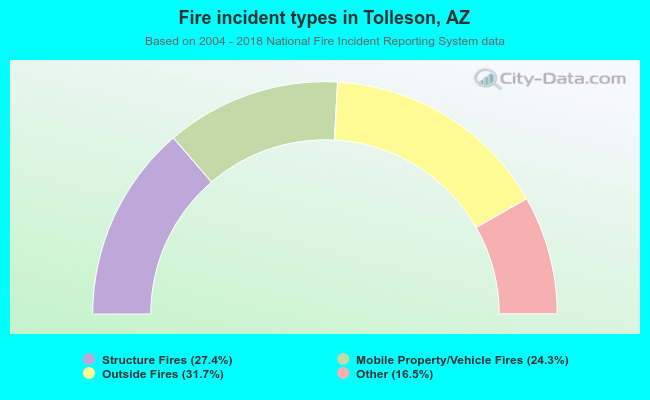 When looking into fire subcategories, the most incidents belonged to: Outside Fires (31.7%), and Structure Fires (27.4%).