South San Francisco: Fire Incidents, California (CA)
Where are fire incidents reported in South San Francisco, CA
Something went wrong! Please refresh the page.
| Fire incidents reported | |
|---|---|
| Sreet name | Count |
| AIRPORT BLVD | 136 |
| EL CAMINO REAL | 136 |
| 101 | 128 |
| GRAND AV | 94 |
| GRAND AVE | 86 |
| CALLAN BLVD | 68 |
| 280 | 58 |
| LINDEN AV | 58 |
| ALIDA WY | 50 |
| GELLERT BLVD | 46 |
| HICKEY BLVD | 42 |
| AIRPORT | 40 |
| MISSION RD | 40 |
| SPRUCE AV | 38 |
| COMMERCIAL AV | 34 |
| MCLELLAN DR | 34 |
| CARTER DR | 32 |
| COMMERCIAL AVE | 32 |
| AIRPORT BVD | 30 |
| CHESTNUT AV | 30 |
| FORBES BLVD | 30 |
| BADEN AV | 28 |
| BADEN AVE | 28 |
| EL CAMINO REAL HWY | 28 |
| MAPLE AV | 28 |
| APPIAN WY | 26 |
| CANAL ST | 26 |
| CAMARITAS AV | 24 |
| JUNIPERO SERRA | 24 |
| LINDEN AVE | 24 |
| Other | 793 |
2005 - 2018 National Fire Incident Reporting System (NFIRS) incidents
- Incident types reported to NFIRS in South San Francisco, CA
- 17,05859.3%Rescue & EMS
- 2,89910.1%Hazardous Condition
- 2,4318.5%False Alarm
- 2,3088.0%Good Intent Call
- 2,2717.9%Fire
- 1,7055.9%Service Call
- 600.2%Overpressure Rupture
- Fire incident types reported to NFIRS in South San Francisco, CA
- 1,09848.3%Structure Fires
- 72531.9%Outside Fires
- 38116.8%Mobile Property/Vehicle Fires
- 673.0%Other
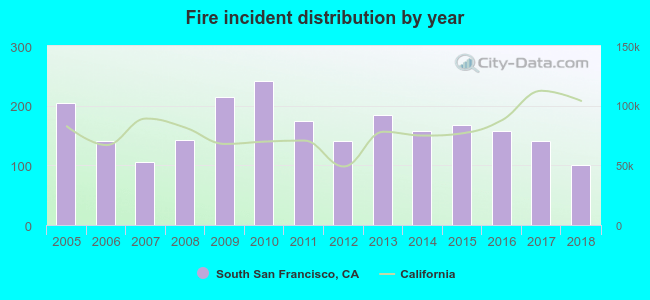 Based on the data from the years 2005 - 2018 the average number of fires per year is 162. The highest number of fires - 241 took place in 2010, and the least - 101 in 2018. The data has a decreasing trend.
The average number of yearly fire incidents per 10k residents in South San Francisco, CA compared to nearest cities:
(Note: Based on data for the last 3 years, including only cities with population 5,000 and above)
| South San Francisco: | 19.8 |
| San Bruno: | 22.9 |
| Daly City: | 14.1 |
| Pacifica: | 20.9 |
| Millbrae: | 25.4 |
| Burlingame: | 17.3 |
| San Francisco: | 36.6 |
| Hillsborough: | 12.6 |
| San Mateo: | 14.1 |
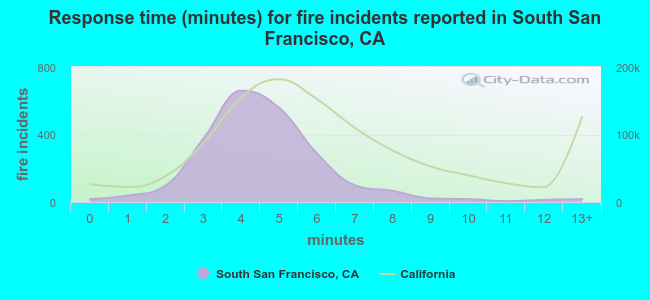 The median response time based on all reported fire incidents is 4 minutes. This is lower compared to the state median value.
The median response time in South San Francisco, CA compared to nearest cities:
(Note: Based on data for all years, including only cities with at least 500 fire incidents)
| South San Francisco: | 4 minutes |
| San Bruno: | 4 minutes |
| Brisbane: | 5 minutes |
| Daly City: | 4 minutes |
| Pacifica: | 5 minutes |
| Millbrae: | 4 minutes |
| Burlingame: | 4 minutes |
| San Francisco: | 4 minutes |
| San Mateo: | 4 minutes |
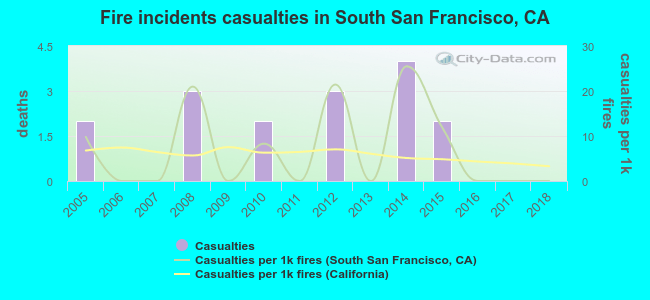 Based on the data from the years 2005 - 2018 the average number of fire-related casualties per year is 1. The highest number of injuries - 4 took place in 2014, and the lowest - 0 in 2006. The data has a decreasing trend.
The average number of casualties per 1,000 fires is 7. This indicator was the highest - 25 in 2014, and the lowest 0 in 2006. The trend for injuries per 1,000 incidents is declining. Compared to the California value the number of casualties per 1,000 fire incidents is higher.
Based on the data from the years 2005 - 2018 the average number of fire-related casualties per year is 1. The highest number of injuries - 4 took place in 2014, and the lowest - 0 in 2006. The data has a decreasing trend.
The average number of casualties per 1,000 fires is 7. This indicator was the highest - 25 in 2014, and the lowest 0 in 2006. The trend for injuries per 1,000 incidents is declining. Compared to the California value the number of casualties per 1,000 fire incidents is higher.Casualties per 1,000 incidents in South San Francisco, CA compared to nearest cities:
(Note: Based on data for all years, including only cities with at least 500 fire incidents)
| South San Francisco: | 7.0 |
| San Bruno: | 6.8 |
| Brisbane: | 2.9 |
| Daly City: | 5.2 |
| Pacifica: | 5.2 |
| Millbrae: | 2.1 |
| Burlingame: | 4.7 |
| San Francisco: | 5.9 |
| San Mateo: | 0.7 |
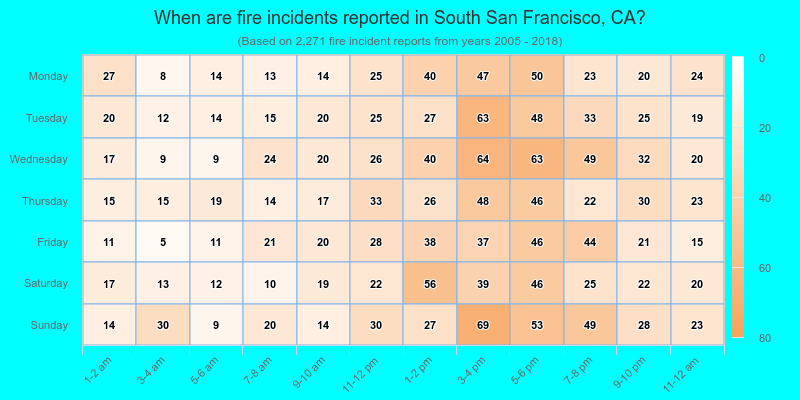
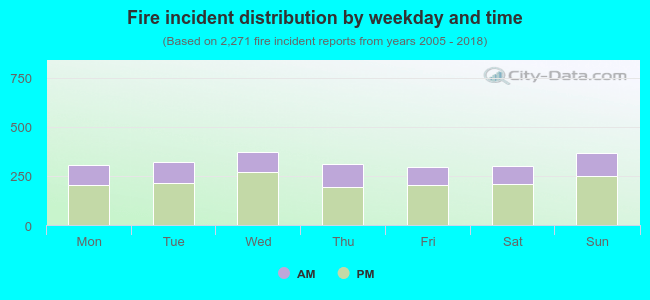 32.2% incidents where reported in the morning and 67.8% in the evening. The most fires (16.4%) took place on Wednesday, and the least (13.1%) on Friday.
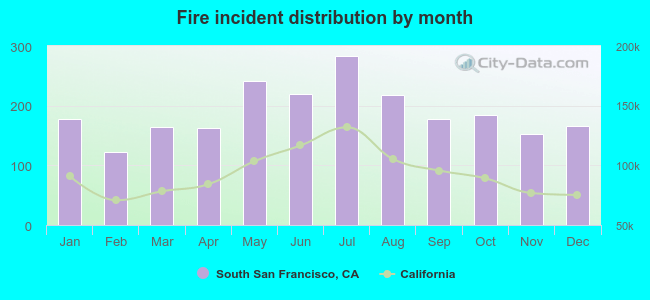 According to the 2,271 fire incident reports from years 2005 - 2018 most fires (12.5%) took place during July, and the least (5.4%) in February.
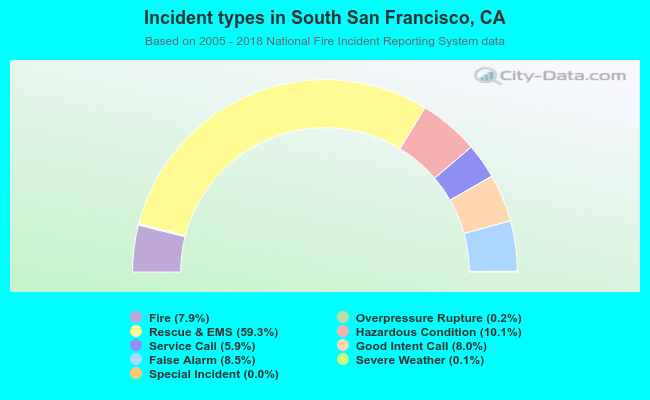 Out of all 28,759 cases reported during the years 2005 - 2018, the most belonged to the categories: Rescue & EMS (59.3%), Hazardous Condition (10.1%), and False Alarm (8.5%).
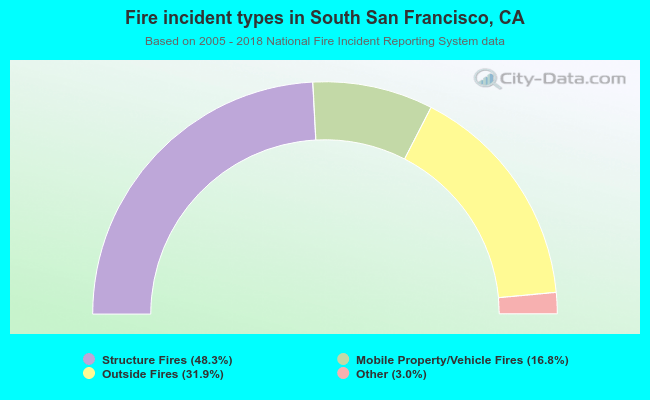 When looking into fire subcategories, the most reports belonged to: Structure Fires (48.3%), and Outside Fires (31.9%).