Hillsborough: Fire Incidents, California (CA)
Where are fire incidents reported in Hillsborough, CA
Something went wrong! Please refresh the page.
|
| |||||||||||||||||||||||||||||||||||||||||||||||||||||||||||||||||||||||||||||||||||||||||||||||||||||||||||||
2005 - 2018 National Fire Incident Reporting System (NFIRS) incidents
- Incident types reported to NFIRS in Hillsborough, CA
- 1,15635.6%Rescue & EMS
- 53816.6%Hazardous Condition
- 45614.0%False Alarm
- 42413.1%Good Intent Call
- 42213.0%Service Call
- 2457.5%Fire
- 40.1%Overpressure Rupture
- Fire incident types reported to NFIRS in Hillsborough, CA
- 9639.2%Structure Fires
- 6526.5%Outside Fires
- 4719.2%Mobile Property/Vehicle Fires
- 3715.1%Other
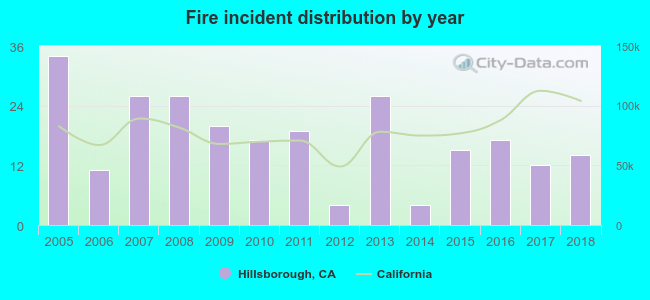 According to the data from the years 2005 - 2018 the average number of fires per year is 18. The highest number of fire incidents - 34 took place in 2005, and the least - 4 in 2012. The data has a declining trend.
The average number of yearly fire incidents per 10k residents in Hillsborough, CA compared to nearest cities:
(Note: Based on data for the last 3 years, including only cities with population 5,000 and above)
| Hillsborough: | 12.6 |
| Burlingame: | 17.3 |
| San Mateo: | 14.1 |
| Millbrae: | 25.4 |
| Belmont: | 17.4 |
| Foster City: | 10.7 |
| San Bruno: | 22.9 |
| San Carlos: | 15.2 |
| El Granada: | 4.9 |
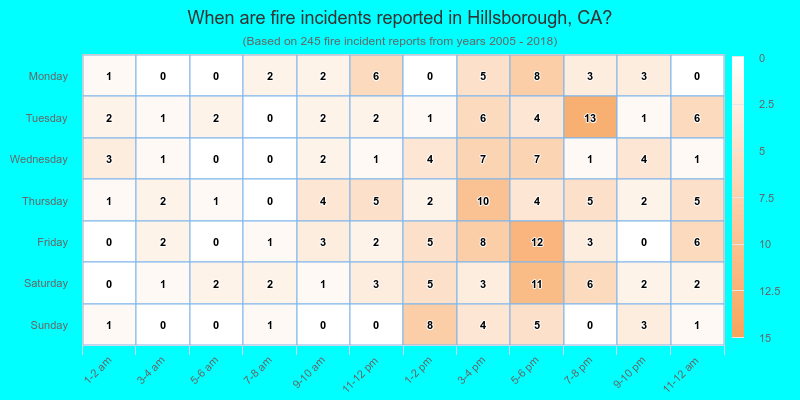
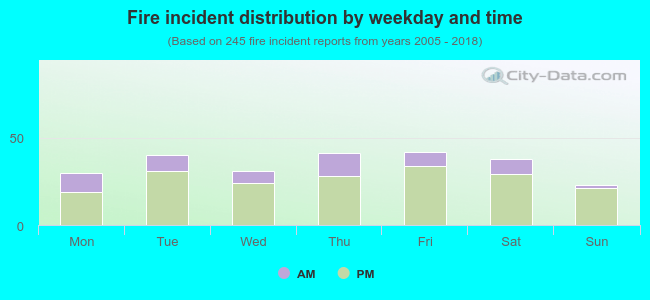 24.1% incidents where reported in the morning and 75.9% in the evening. The most fires (17.1%) took place on Friday, and the least (9.4%) on Sunday.
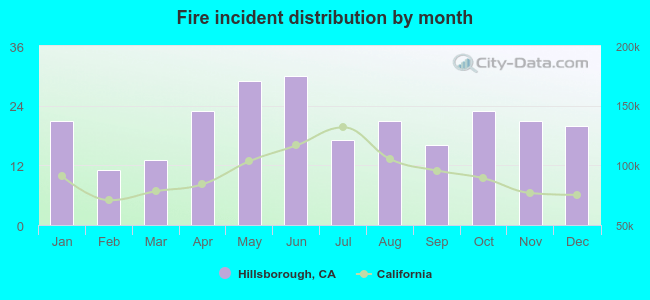 According to the 245 fire incident reports from years 2005 - 2018 most fires (12.2%) took place during June, and the least (4.5%) in February.
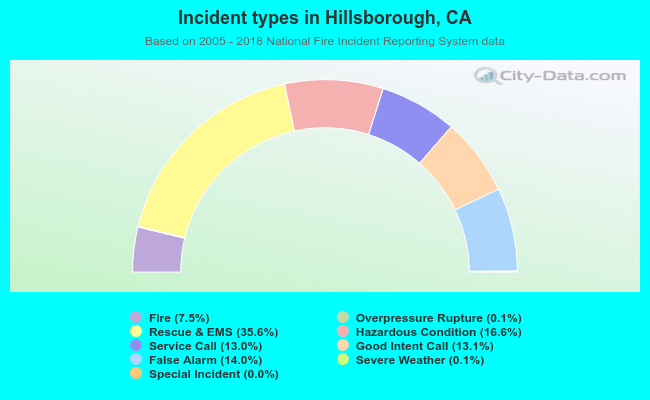 Out of all 3,249 cases reported during the years 2005 - 2018, the most belonged to the categories: Rescue & EMS (35.6%), Hazardous Condition (16.6%), and False Alarm (14.0%).
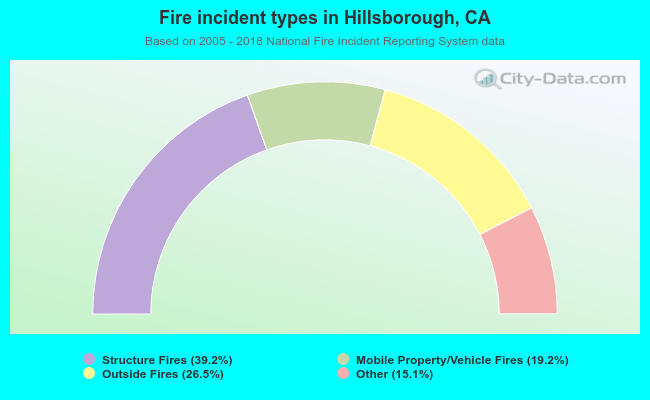 When looking into fire subcategories, the most incidents belonged to: Structure Fires (39.2%), and Outside Fires (26.5%).