Belmont: Fire Incidents, California (CA)
Where are fire incidents reported in Belmont, CA
Something went wrong! Please refresh the page.
|
| |||||||||||||||||||||||||||||||||||||||||||||||||||||||||||||||||||||||||||||||||||||||||||||||||||||||||||||
2005 - 2018 National Fire Incident Reporting System (NFIRS) incidents
- Incident types reported to NFIRS in Belmont, CA
- 6,12458.2%Rescue & EMS
- 1,07110.2%Good Intent Call
- 8247.8%Hazardous Condition
- 8237.8%False Alarm
- 8097.7%Service Call
- 6896.6%Fire
- 1531.5%Special Incident
- 170.2%Overpressure Rupture
- Fire incident types reported to NFIRS in Belmont, CA
- 36452.8%Structure Fires
- 13519.6%Outside Fires
- 11016.0%Other
- 8011.6%Mobile Property/Vehicle Fires
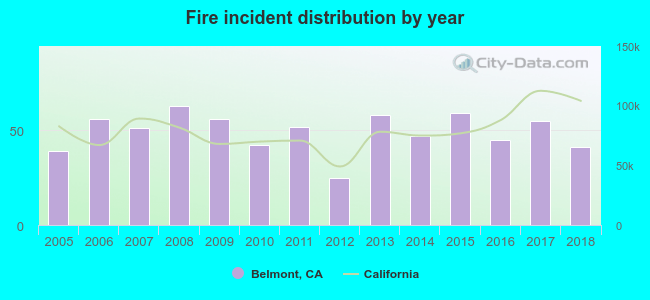 Based on the data from the years 2005 - 2018 the average number of fires per year is 49. The highest number of reported fire incidents - 63 took place in 2008, and the least - 25 in 2012. The data has a growing trend.
The average number of yearly fire incidents per 10k residents in Belmont, CA compared to nearest cities:
(Note: Based on data for the last 3 years, including only cities with population 5,000 and above)
| Belmont: | 17.4 |
| San Carlos: | 15.2 |
| Foster City: | 10.7 |
| San Mateo: | 14.1 |
| Redwood City: | 23.3 |
| Hillsborough: | 12.6 |
| Burlingame: | 17.3 |
| Atherton: | 10.3 |
| Woodside: | 83.2 |
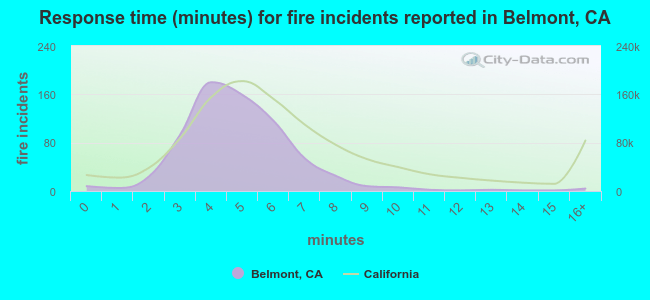 The median response time based on all reported fire incidents is 5 minutes. This is lower than the California median value.
The median response time in Belmont, CA compared to nearest cities:
(Note: Based on data for all years, including only cities with at least 500 fire incidents)
| Belmont: | 5 minutes |
| San Carlos: | 5 minutes |
| Foster City: | 4 minutes |
| San Mateo: | 4 minutes |
| Redwood City: | 5 minutes |
| Burlingame: | 4 minutes |
| Menlo Park: | 4 minutes |
| Millbrae: | 4 minutes |
| East Palo Alto: | 4 minutes |
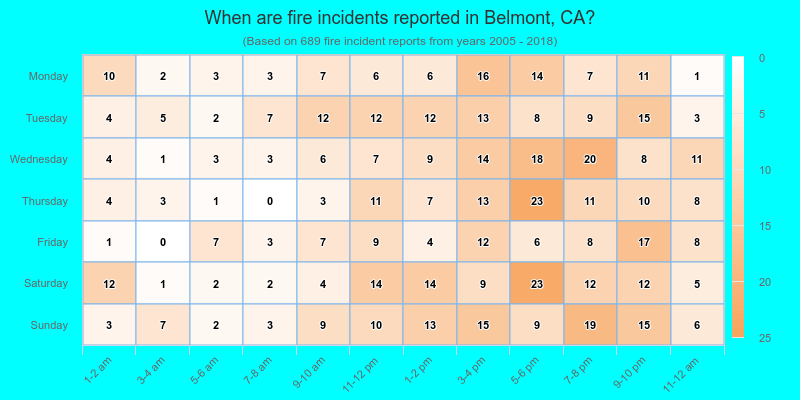
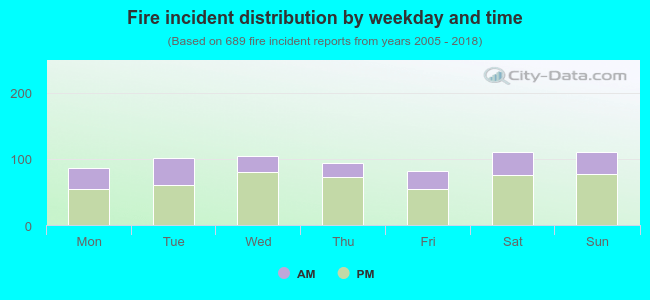 31.2% incidents where reported in the morning and 68.8% in the evening. The most fires (16.1%) took place on Sunday, and the least (11.9%) on Friday.
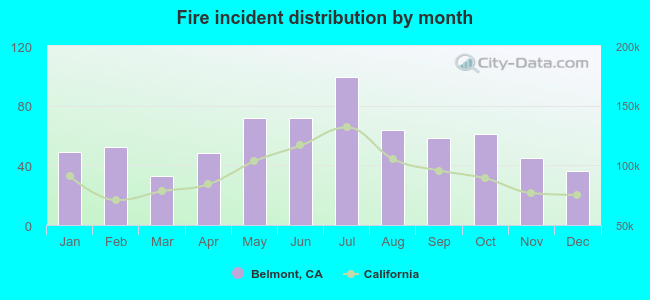 Based on the 689 reports from years 2005 - 2018 most fires (14.4%) took place during July, and the least (4.8%) in March.
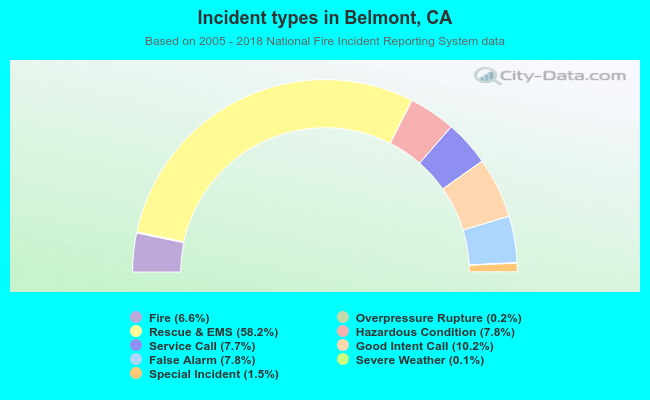 Out of all 10,517 cases reported during the years 2005 - 2018, the most belonged to the categories: Rescue & EMS (58.2%), Good Intent Call (10.2%), and Hazardous Condition (7.8%).
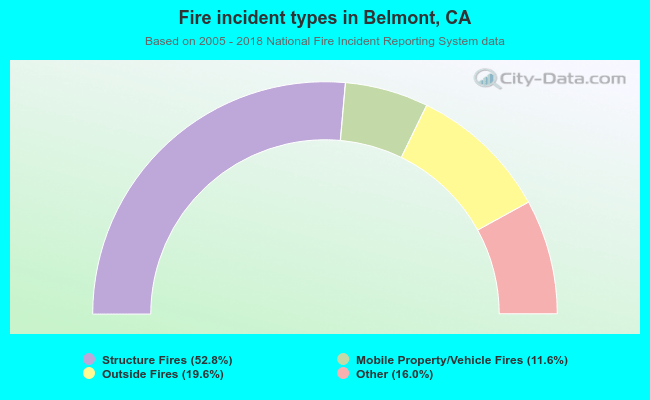 When looking into fire subcategories, the most incidents belonged to: Structure Fires (52.8%), and Outside Fires (19.6%).