Burlingame: Fire Incidents, California (CA)
Where are fire incidents reported in Burlingame, CA
Something went wrong! Please refresh the page.
| Fire incidents reported | |
|---|---|
| Sreet name | Count |
| EL CAMINO REAL | 146 |
| 101 | 114 |
| BAYSHORE HWY | 62 |
| AIRPORT BLVD | 58 |
| BROADWAY | 50 |
| ROLLINS RD | 50 |
| TROUSDALE DR | 44 |
| BURLINGAME AV | 42 |
| CALIFORNIA DR | 40 |
| LORTON AV | 22 |
| HOWARD AV | 20 |
| PARK RD | 20 |
| ADELINE DR | 18 |
| CHULA VISTA AV | 18 |
| 280 | 16 |
| LOS ROBLES DR | 16 |
| MANGINI WY | 16 |
| PRIMROSE RD | 16 |
| FLORIBUNDA AV | 14 |
| CAPUCHINO AV | 12 |
| CAROLAN AV | 12 |
| CAROLAN AVE | 12 |
| COLUMBUS AV | 12 |
| EASTON DR | 12 |
| FRONTERA WY | 12 |
| GUITTARD RD | 12 |
| LOMA VISTA DR | 12 |
| MARCO POLO WY | 12 |
| ANZA BLVD | 10 |
| BEACH RD | 10 |
2005 - 2018 National Fire Incident Reporting System (NFIRS) incidents
- Incident types reported to NFIRS in Burlingame, CA
- 6,39350.8%Rescue & EMS
- 2,16717.2%Hazardous Condition
- 1,37510.9%Good Intent Call
- 9897.9%False Alarm
- 8436.7%Fire
- 8026.4%Service Call
- 150.1%Overpressure Rupture
- Fire incident types reported to NFIRS in Burlingame, CA
- 39847.2%Structure Fires
- 23628.0%Outside Fires
- 15318.1%Mobile Property/Vehicle Fires
- 566.6%Other
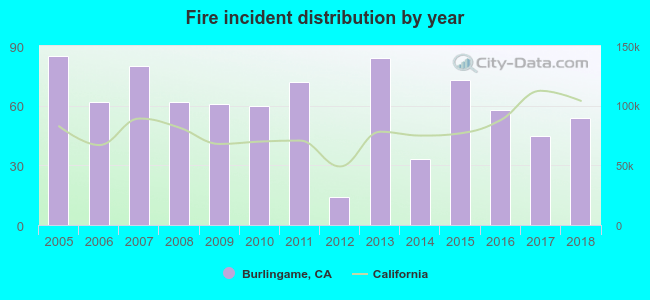 According to the data from the years 2005 - 2018 the average number of fires per year is 60. The highest number of reported fire incidents - 85 took place in 2005, and the least - 14 in 2012. The data has a dropping trend.
The average number of yearly fire incidents per 10k residents in Burlingame, CA compared to nearest cities:
(Note: Based on data for the last 3 years, including only cities with population 5,000 and above)
| Burlingame: | 17.3 |
| Hillsborough: | 12.6 |
| Millbrae: | 25.4 |
| San Mateo: | 14.1 |
| San Bruno: | 22.9 |
| Foster City: | 10.7 |
| Belmont: | 17.4 |
| South San Francisco: | 19.8 |
| Pacifica: | 20.9 |
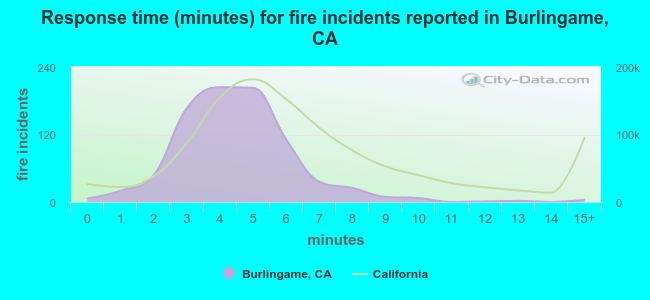 The median response time based on all reported fire incidents is 4 minutes. This is lower than the California median value.
The median response time in Burlingame, CA compared to nearest cities:
(Note: Based on data for all years, including only cities with at least 500 fire incidents)
| Burlingame: | 4 minutes |
| Millbrae: | 4 minutes |
| San Mateo: | 4 minutes |
| San Bruno: | 4 minutes |
| Foster City: | 4 minutes |
| Belmont: | 5 minutes |
| South San Francisco: | 4 minutes |
| Pacifica: | 5 minutes |
| Brisbane: | 5 minutes |
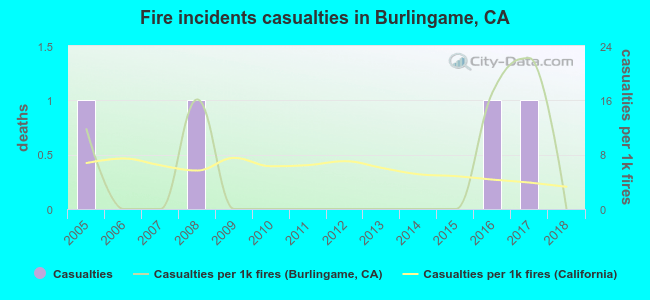 According to the reports from the years 2005 - 2018 the average number of fire-related yearly casualties is 0. The highest number of reported casualties - 1 took place in 2005, and the lowest - 0 in 2006. The data has a declining trend.
The average number of casualties per 1,000 fire incidents is 5. This indicator was the highest - 22 in 2017, and the lowest 0 in 2006. The trend for casualties per 1,000 fires is decreasing. Compared to the state value the number of casualties per 1,000 incidents is about the same.
According to the reports from the years 2005 - 2018 the average number of fire-related yearly casualties is 0. The highest number of reported casualties - 1 took place in 2005, and the lowest - 0 in 2006. The data has a declining trend.
The average number of casualties per 1,000 fire incidents is 5. This indicator was the highest - 22 in 2017, and the lowest 0 in 2006. The trend for casualties per 1,000 fires is decreasing. Compared to the state value the number of casualties per 1,000 incidents is about the same.Casualties per 1,000 incidents in Burlingame, CA compared to nearest cities:
(Note: Based on data for all years, including only cities with at least 500 fire incidents)
| Burlingame: | 4.7 |
| Millbrae: | 2.1 |
| San Mateo: | 0.7 |
| San Bruno: | 6.8 |
| Foster City: | 1.6 |
| Belmont: | 0.0 |
| South San Francisco: | 7.0 |
| Pacifica: | 5.2 |
| Brisbane: | 2.9 |
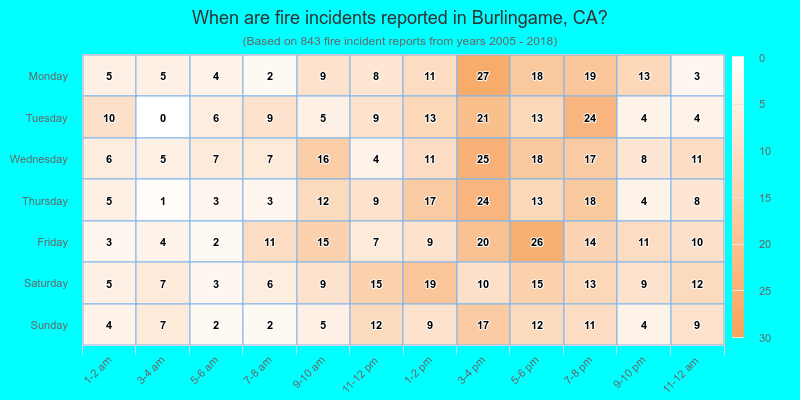
 31.9% incidents where reported in the morning and 68.1% in the evening. The most fires (16.0%) took place on Wednesday, and the least (11.2%) on Sunday.
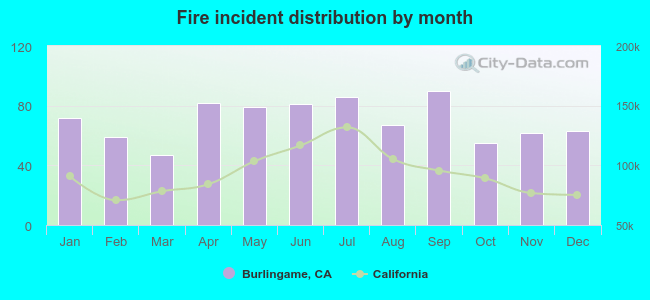 Based on the 843 reports from years 2005 - 2018 most fires (10.7%) took place during September, and the least (5.6%) in March.
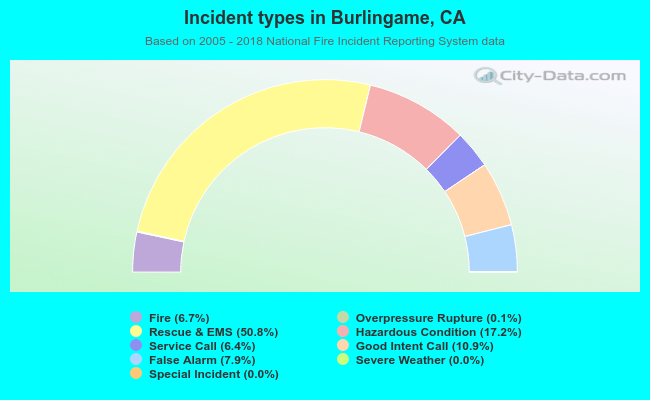 Out of all 12,589 cases reported during the years 2005 - 2018, the most belonged to the categories: Rescue & EMS (50.8%), Hazardous Condition (17.2%), and Good Intent Call (10.9%).
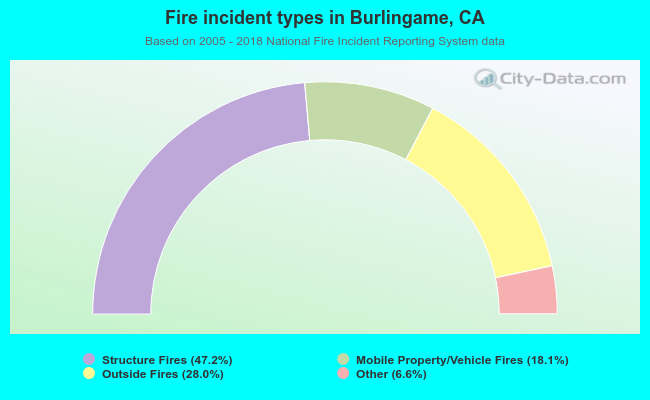 When looking into fire subcategories, the most incidents belonged to: Structure Fires (47.2%), and Outside Fires (28.0%).