San Mateo: Fire Incidents, California (CA)
Where are fire incidents reported in San Mateo, CA
Something went wrong! Please refresh the page.
| Fire incidents reported | |
|---|---|
| Sreet name | Count |
| 101 | 242 |
| EL CAMINO REAL | 236 |
| HILLSDALE BLVD | 236 |
| DELAWARE ST | 144 |
| NORFOLK ST | 112 |
| 92 | 108 |
| 3RD AV | 102 |
| AMPHLETT BLVD | 98 |
| HUMBOLDT ST | 94 |
| GRANT ST | 92 |
| IDAHO ST | 82 |
| CLAREMONT ST | 72 |
| SAN MATEO DR | 66 |
| ALAMEDA DE LAS PUL | 58 |
| B ST | 58 |
| 2ND AV | 56 |
| BAYSHORE BLVD | 56 |
| 101 HWY | 54 |
| 5TH AV | 54 |
| POPLAR AV | 54 |
| EDISON ST | 52 |
| 4TH AV | 50 |
| EL CAMINO REAL AVE | 50 |
| GRAND BLVD | 46 |
| 36TH AV | 42 |
| DETROIT DR | 40 |
| ELM ST | 40 |
| LAURIE MEADOWS DR | 40 |
| 40TH AV | 38 |
| FREMONT ST | 38 |
| Other | 426 |
2005 - 2018 National Fire Incident Reporting System (NFIRS) incidents
- Incident types reported to NFIRS in San Mateo, CA
- 24,02055.2%Rescue & EMS
- 5,58312.8%Hazardous Condition
- 4,86011.2%Good Intent Call
- 3,3737.7%Service Call
- 2,9366.7%Fire
- 2,5525.9%False Alarm
- 1730.4%Special Incident
- Fire incident types reported to NFIRS in San Mateo, CA
- 1,44349.1%Structure Fires
- 81927.9%Outside Fires
- 47516.2%Mobile Property/Vehicle Fires
- 1996.8%Other
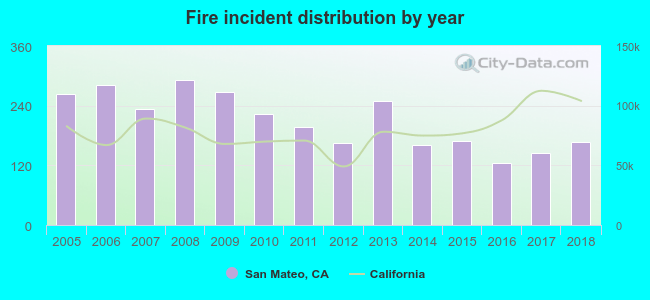 According to the data from the years 2005 - 2018 the average number of fire incidents per year is 210. The highest number of fires - 292 took place in 2008, and the least - 124 in 2016. The data has a declining trend.
The average number of yearly fire incidents per 10k residents in San Mateo, CA compared to nearest cities:
(Note: Based on data for the last 3 years, including only cities with population 5,000 and above)
| San Mateo: | 14.1 |
| Hillsborough: | 12.6 |
| Foster City: | 10.7 |
| Belmont: | 17.4 |
| Burlingame: | 17.3 |
| San Carlos: | 15.2 |
| Millbrae: | 25.4 |
| Redwood City: | 23.3 |
| San Bruno: | 22.9 |
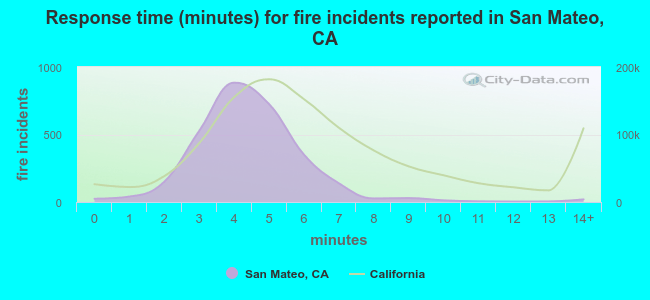 The median response time based on all reported fire incidents is 4 minutes. This is lower than the state median value.
The median response time in San Mateo, CA compared to nearest cities:
(Note: Based on data for all years, including only cities with at least 500 fire incidents)
| San Mateo: | 4 minutes |
| Foster City: | 4 minutes |
| Belmont: | 5 minutes |
| Burlingame: | 4 minutes |
| San Carlos: | 5 minutes |
| Millbrae: | 4 minutes |
| Redwood City: | 5 minutes |
| San Bruno: | 4 minutes |
| South San Francisco: | 4 minutes |
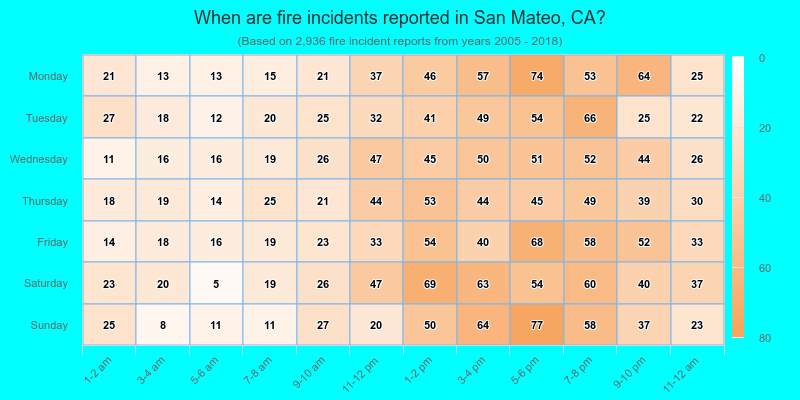
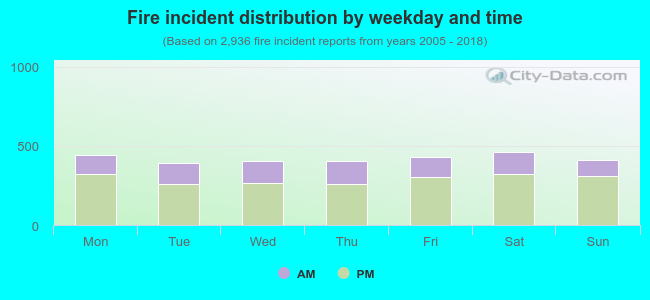 30.5% incidents where reported in the morning and 69.5% in the evening. The most fires (15.8%) took place on Saturday, and the least (13.3%) on Tuesday.
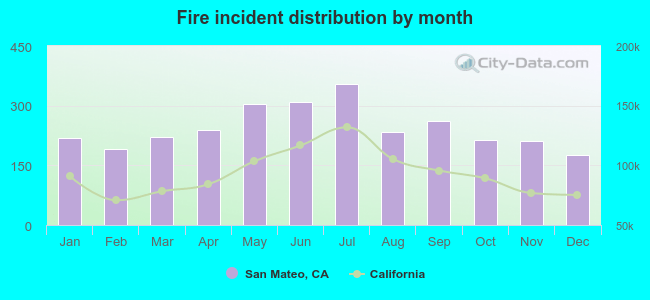 Based on the 2,936 incident reports from years 2005 - 2018 most fires (12.1%) took place during July, and the least (6.0%) in December.
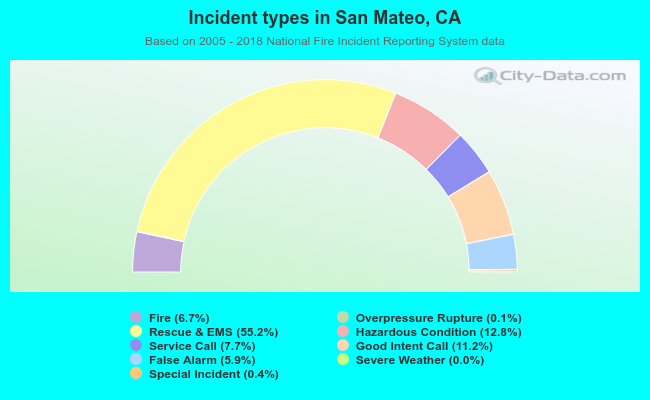 Out of all 43,544 cases reported during the years 2005 - 2018, the most belonged to the categories: Rescue & EMS (55.2%), Hazardous Condition (12.8%), and Good Intent Call (11.2%).
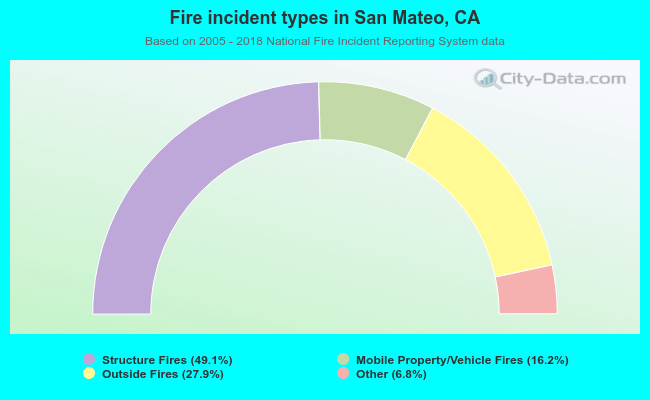 When looking into fire subcategories, the most reports belonged to: Structure Fires (49.1%), and Outside Fires (27.9%).